
Yesterday’s main Elliott wave count expected a red candlestick and a new low for Wednesday’s session which is exactly what has happened. Because the alternate Elliott wave count was invalidated, today I have just one wave count.
Summary: I expect a little more downwards movement tomorrow to a new low, and a short term target at 1,909. However, the mid line of the channel on the hourly chart is probably a better guide to where downwards movement may end than the target. When that is done, most likely during tomorrow’s session, a B wave should begin and may last about one to one and a half weeks.
Click on charts to enlarge.
The aqua blue trend lines are critical. Draw the first trend line from the low of 1,158.66 on 25th November, 2011 to the next swing low at 1,266.74 on 4th June, 2012. Create a parallel copy and place it on the low at 1,560.33 on 24th June, 2013. While price remains above the lower of these two aqua blue trend lines we must assume the trend remains upwards. This is the main reason for the bullish wave count being my main wave count.
Bullish Wave Count.
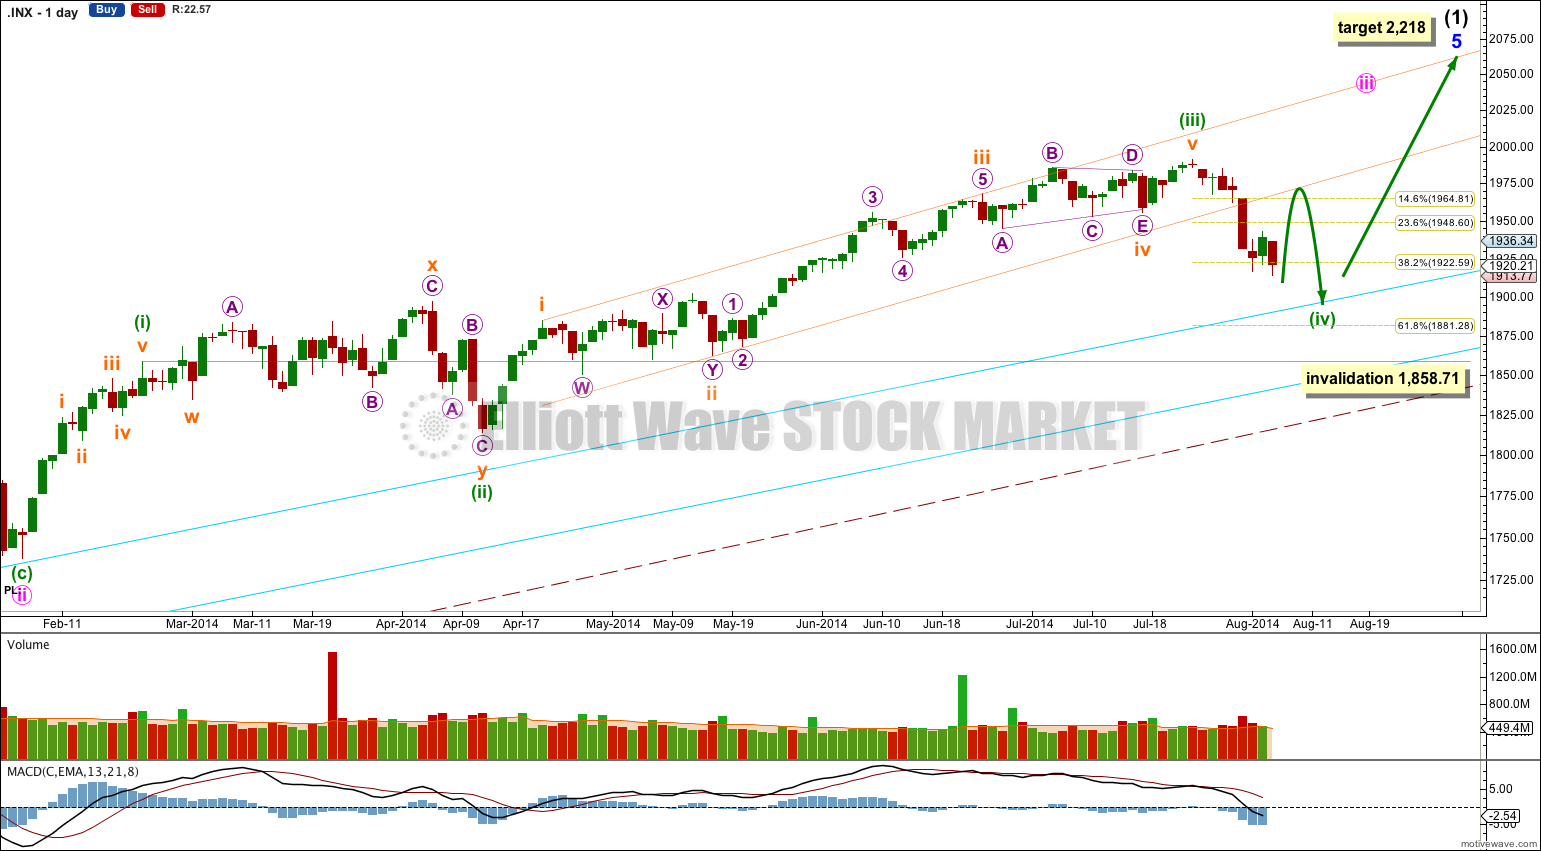
There are a couple of things about this wave count of which I am confident. I see minor wave 3 within intermediate wave (1) as over at 1,729.86 (19th September, 2013). It has the strongest upwards momentum and is just 0.76 longer than 2.618 the length of minor wave 1. At 455 days duration this is a remarkably close Fibonacci ratio. The subdivisions within it are perfect. If this is correct then minor wave 4 ends at 1,646.47 and this is where minor wave 5 begins.
Minor wave 5 is unfolding as an impulse. If minor wave 5 has passed its middle then I would expect to see more divergence between price and MACD develop over coming weeks.
Along the way up towards the final target I would expect to see two more corrections complete: the current correction for minuette wave (iv) and one more for minute wave iv.
Minuette wave (iv) may not move into minuette wave (i) price territory below 1,858.71.
At 2,218 minor wave 5 would reach equality in length with minor wave 3. This target may be met in October.
I have drawn a parallel channel about minuette wave (iii) using Elliott’s first technique: draw the first trend line from the highs of subminuette waves i to iii, then place a parallel copy on the low of subminuette wave ii. Minuette wave (iv) has arrived and breaches the channel about minuette wave (iii). Minuette wave (iv) may reach as low as the 0.618 Fibonacci ratio of minuette wave (iii) at 1,881.28, which would provide alternation in depth of correction between minuette waves (ii) and (iv), (minuette wave (ii) was a shallow 37% correction). Downwards movement may find final support about or just above the upper aqua blue trend line, continuing a pattern which has lasted about a year now.
The large maroon – – – channel is copied over from the weekly chart. It is drawn in exactly the same way on bull and bear wave counts. For the bull wave count this channel is termed a base channel about primary waves 1 and 2. A lower degree second wave should not breach the lower edge of a base channel drawn about a first and second wave one or more degrees higher. The lower maroon – – – trend line differentiates the bull and bear wave counts at cycle degree and monthly chart level.
In the short term, tomorrow, I expect the S&P to move into a low degree B wave. B waves exhibit the greatest variety in form and structure. They are the most difficult movements to analyse and multiple wave counts will be possible. They are often choppy overlapping sideways movements, but they are sometimes quick sharp zigzags. Flexibility and patience are essential during B waves.
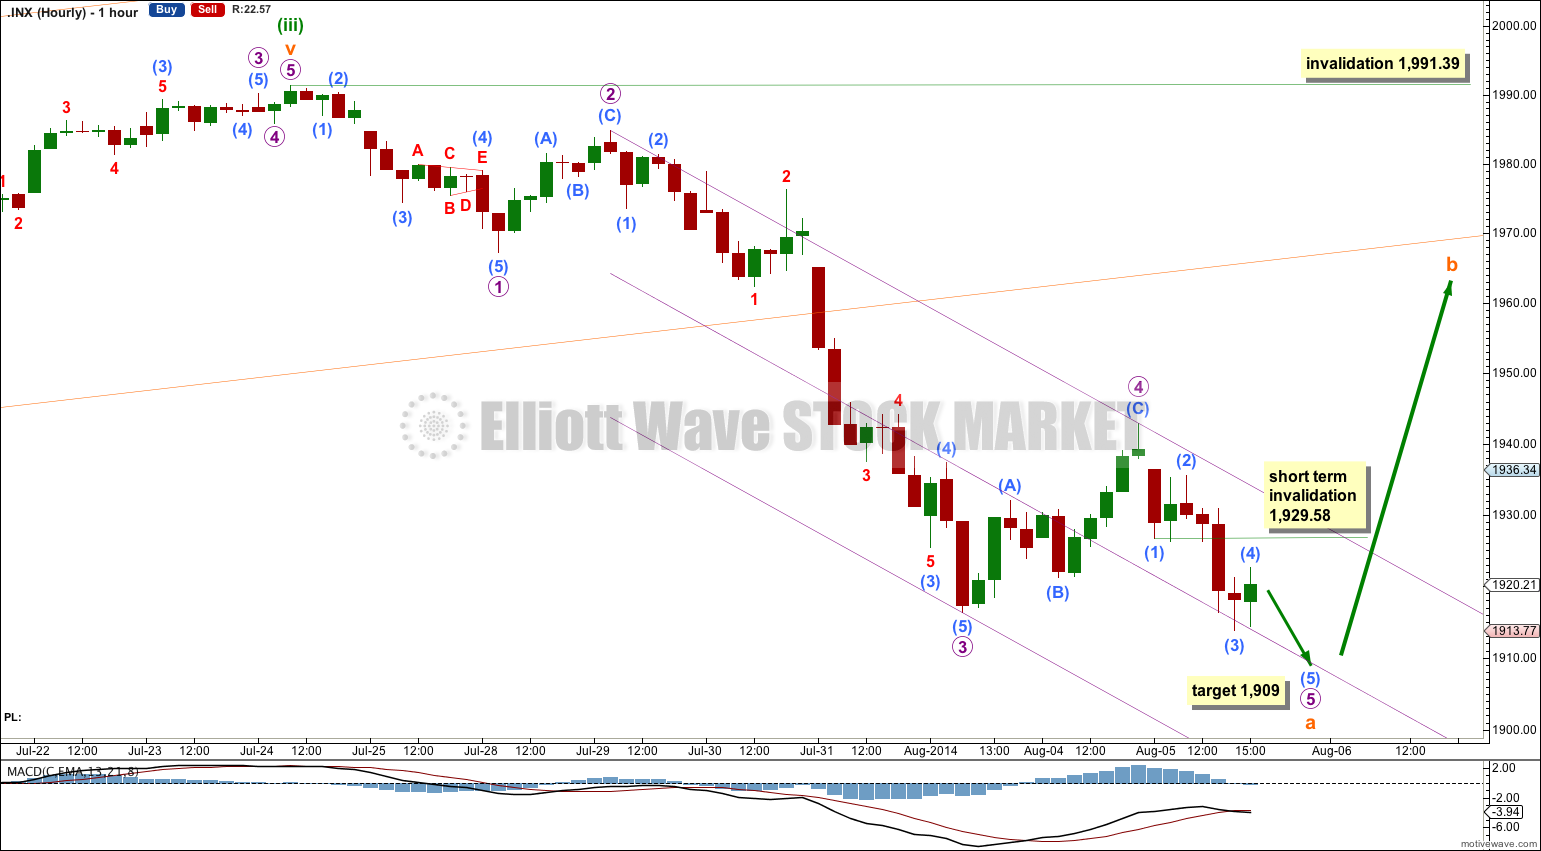
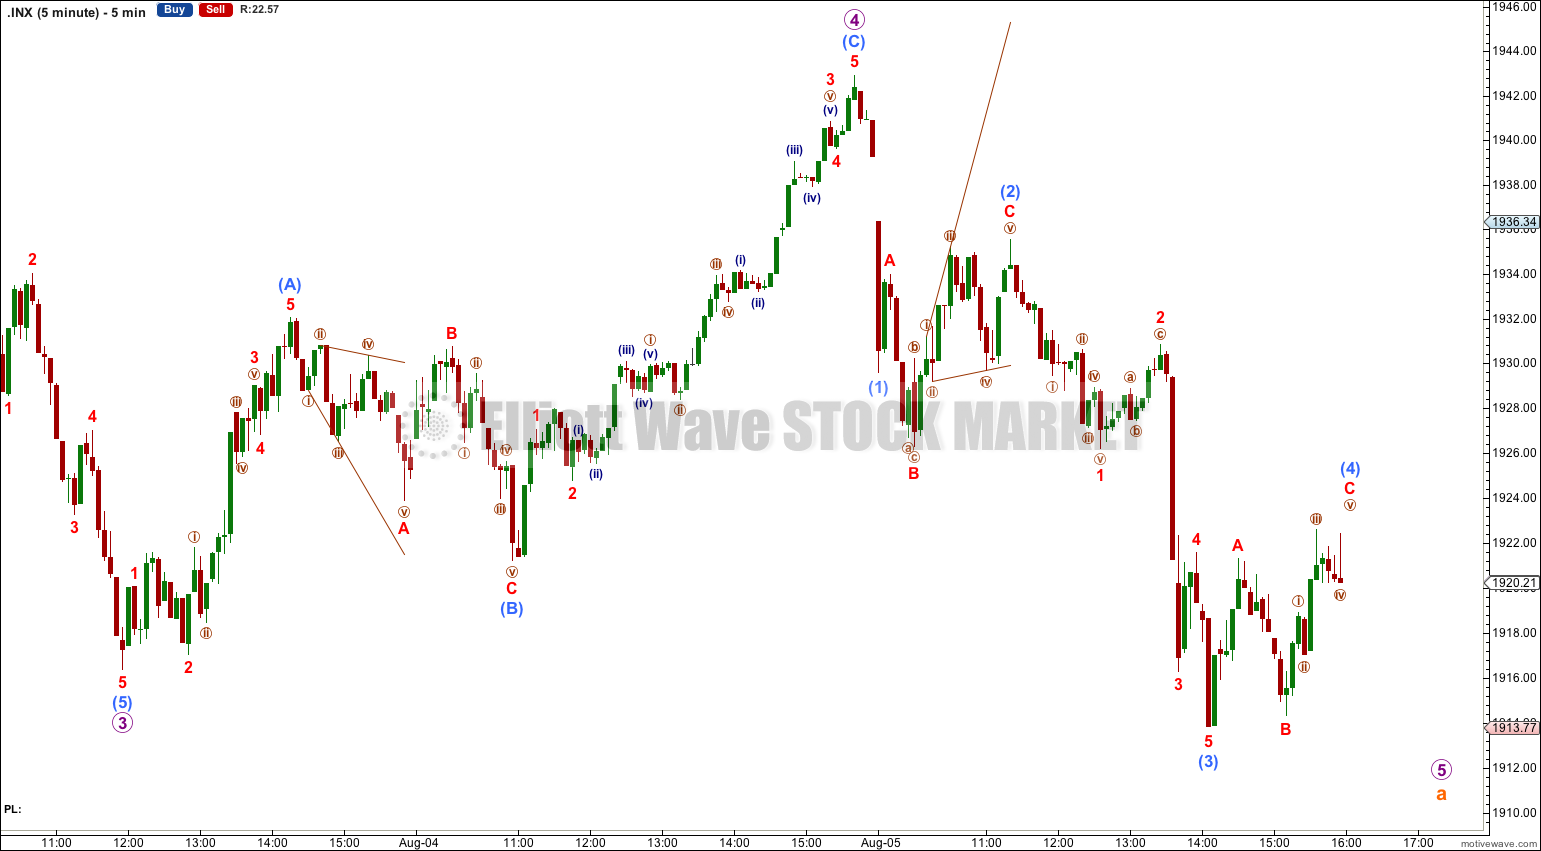
Subminuette wave a is now a very typical looking five wave impulse which is almost complete. It should end tomorrow.
Within subminuette wave a micro wave 3 is 5.44 points longer than 2.618 the length of micro wave 1. I will not expect to see a Fibonacci ratio between micro wave 5 and either of 1 or 3.
Within micro wave 4 submicro wave (4) may not move into submicro wave (1) price territory above 1,929.58 (this figure is determined from the five minute chart).
Within micro wave 5 submicro wave (3) is just 0.22 points longer than 1.618 the length of submicro wave (1) (figures are calculated from the five minute chart below). I would not expect to see a Fibonacci ratio between submicro wave (5) and either of (1) or (3).
This makes target calculation rather difficult.
At 1,909 submicro wave (5) would reach equality in length with submicro wave (1). This is somewhat likely, but the mid line of the parallel channel about this downwards wave may be a more reliable guide to where downwards movement may end.
Draw the channel about subminuette wave a using Elliott’s second technique: draw the first trend line from the ends of micro waves 2 to 4, then place a parallel copy on the end of micro wave 3. Create a mid line. I will expect one more short downwards wave to a new low tomorrow which may end about the mid line of this channel.
Once we have a new low and the final fifth wave down may be complete, then a subsequent breach of the downwards purple channel would be confirmation that subminuette wave a is over and subminuette wave b has begun. At that point there are more than thirteen possible corrective structures that subminuette wave b may take. Because subminuette wave a subdivides as a five subminuette wave b may not move beyond its start above 1,991.39.
Minuette wave (ii) was a shallow sideways combination which lasted a total Fibonacci 34 days. I would expect minuette wave (iv) to be a zigzag most likely (which is how it is subdividing so far) and to be deeper than 0.382 of minuette wave (iii). I would expect minuette wave (iv) to be somewhat in proportion to minuette wave (ii) because this is what gives a wave count the right look. Minuette wave (iv) may last a total Fibonacci 21 days. So far it has lasted eight.
Bearish Alternate Wave Count
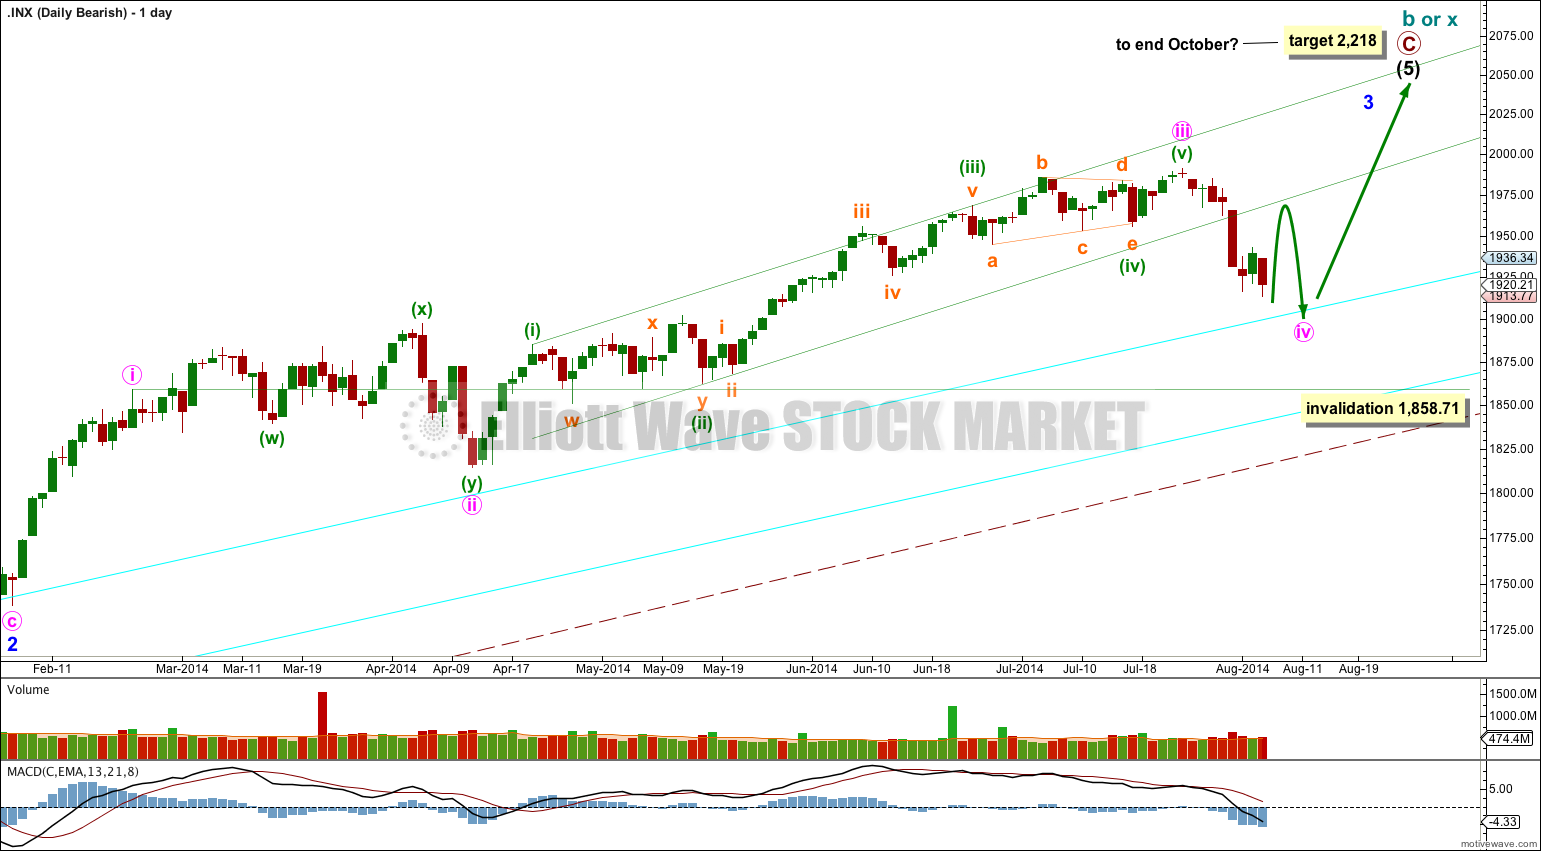
This bearish alternate wave count expects that the correction is not over. The flat correction which ended at 666.79 was only cycle wave a (or w) of a larger super cycle second wave correction.
The structure and subdivisions within primary wave C for the bear wave count are the same as for intermediate wave (1) for the bull wave count. Thus the short to mid term outlook is identical.
The differentiation between the bull and bear wave count is the maroon – – – channel. The bull wave count should see price remain above the lower maroon – – – trend line. The bear wave count requires a clear breach of this trend line. If this trend line is breached by a full weekly candlestick below it and not touching it then this bear wave count would be my main wave count and I would then calculate downwards targets.
We should always assume the trend remains the same until proven otherwise; the trend is your friend. While price remains above the lower maroon – – – trend line I will assume that the S&P 500 remains within a bull market.
This analysis is published about 06:46 p.m. EST.