
Last Elliott wave analysis had expected downwards movement to a short term target at 1,914 and the alternate expected upwards movement. Price moved upwards.
Summary: I expect a new low below 1,916.37 is likely tomorrow. That would complete the A wave of this correction. When wave A is complete then I expect very choppy overlapping movement most likely for the rest of this week.
Click on charts to enlarge.
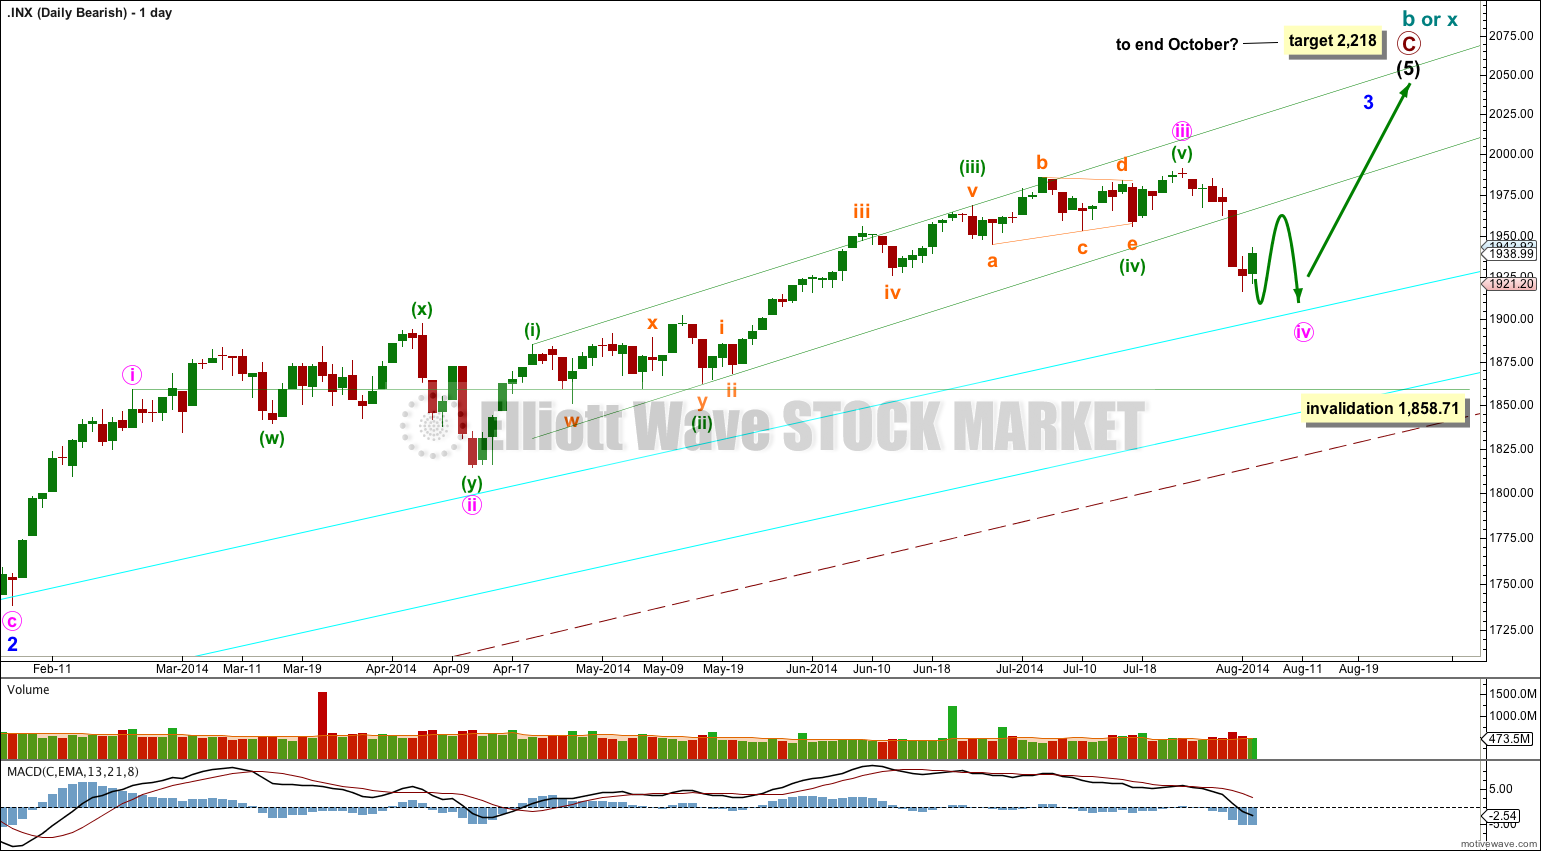
The aqua blue trend lines are critical. Draw the first trend line from the low of 1,158.66 on 25th November, 2011 to the next swing low at 1,266.74 on 4th June, 2012. Create a parallel copy and place it on the low at 1,560.33 on 24th June, 2013. While price remains above the lower of these two aqua blue trend lines we must assume the trend remains upwards. This is the main reason for the bullish wave count being my main wave count.
Bullish Wave Count.
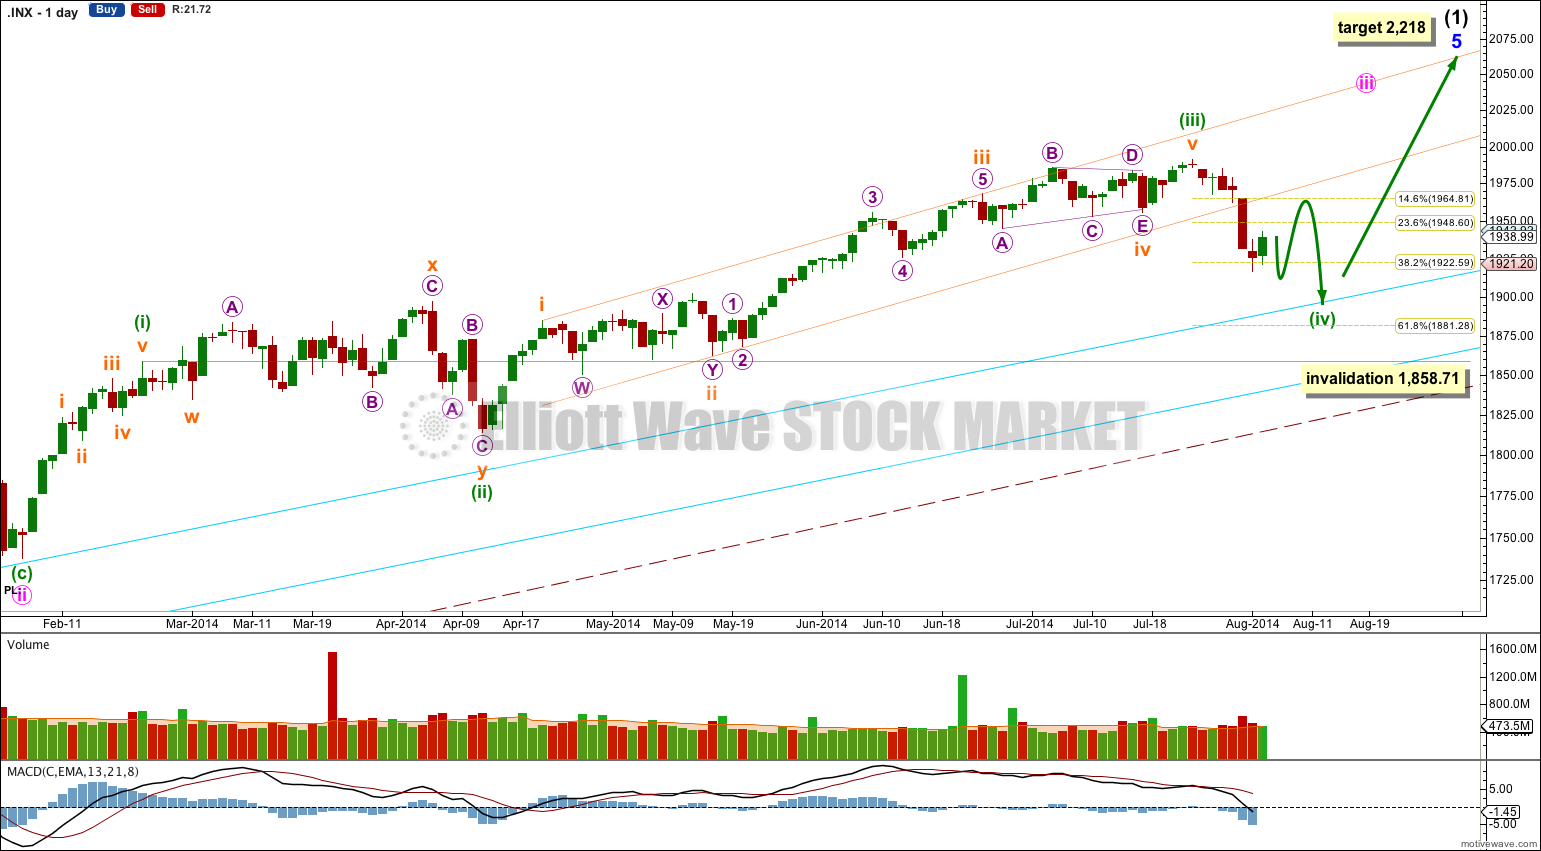
There are a couple of things about this wave count of which I am confident. I see minor wave 3 within intermediate wave (1) as over at 1,729.86 (19th September, 2013). It has the strongest upwards momentum and is just 0.76 longer than 2.618 the length of minor wave 1. At 455 days duration this is a remarkably close Fibonacci ratio. The subdivisions within it are perfect. If this is correct then minor wave 4 ends at 1,646.47 and this is where minor wave 5 begins.
Minor wave 5 may be only one of two structures: a simple impulse or an ending diagonal. At this stage an ending diagonal looks very unlikely; minor wave 5 is unfolding as an impulse. If minor wave 5 has passed its middle then I would expect to see more divergence between price and MACD develop over coming weeks.
Along the way up towards the final target I would expect to see two more corrections complete: the current correction for minuette wave (iv) and one more for minute wave iv.
Minuette wave (iv) may not move into minuette wave (i) price territory below 1,858.71.
At 2,218 minor wave 5 would reach equality in length with minor wave 3. This target may be met in October.
I have drawn a parallel channel about minuette wave (iii) using Elliott’s first technique: draw the first trend line from the highs of subminuette waves i to iii, then place a parallel copy on the low of subminuette wave ii. A clear breach of this channel to the downside provides strong confirmation that minuette wave (iv) has arrived. Minuette wave (iv) may reach as low as the 0.618 Fibonacci ratio of minuette wave (iii) at 1,881.28, which would provide alternation in depth of correction between minuette waves (ii) and (iv), minuette wave (ii) was a shallow 37% correction. Downwards movement may find final support about or just above the upper aqua blue trend line, continuing a pattern which has lasted about a year now.
The large maroon – – – channel is copied over from the weekly chart. It is drawn in exactly the same way on bull and bear wave counts. For the bull wave count this channel is termed a base channel about primary waves 1 and 2. A lower degree second wave should not breach the lower edge of a base channel drawn about a first and second wave one or more degrees higher. The lower maroon – – – trend line differentiates the bull and bear wave counts at cycle degree and monthly chart level.
In the short term, next week, I expect the S&P to move into a low degree B wave. B waves exhibit the greatest variety in form and structure. They are the most difficult movements to analyse and multiple wave counts will be possible. They are often choppy overlapping sideways movements, but they are sometimes quick sharp zigzags. Flexibility and patience are essential during B waves.
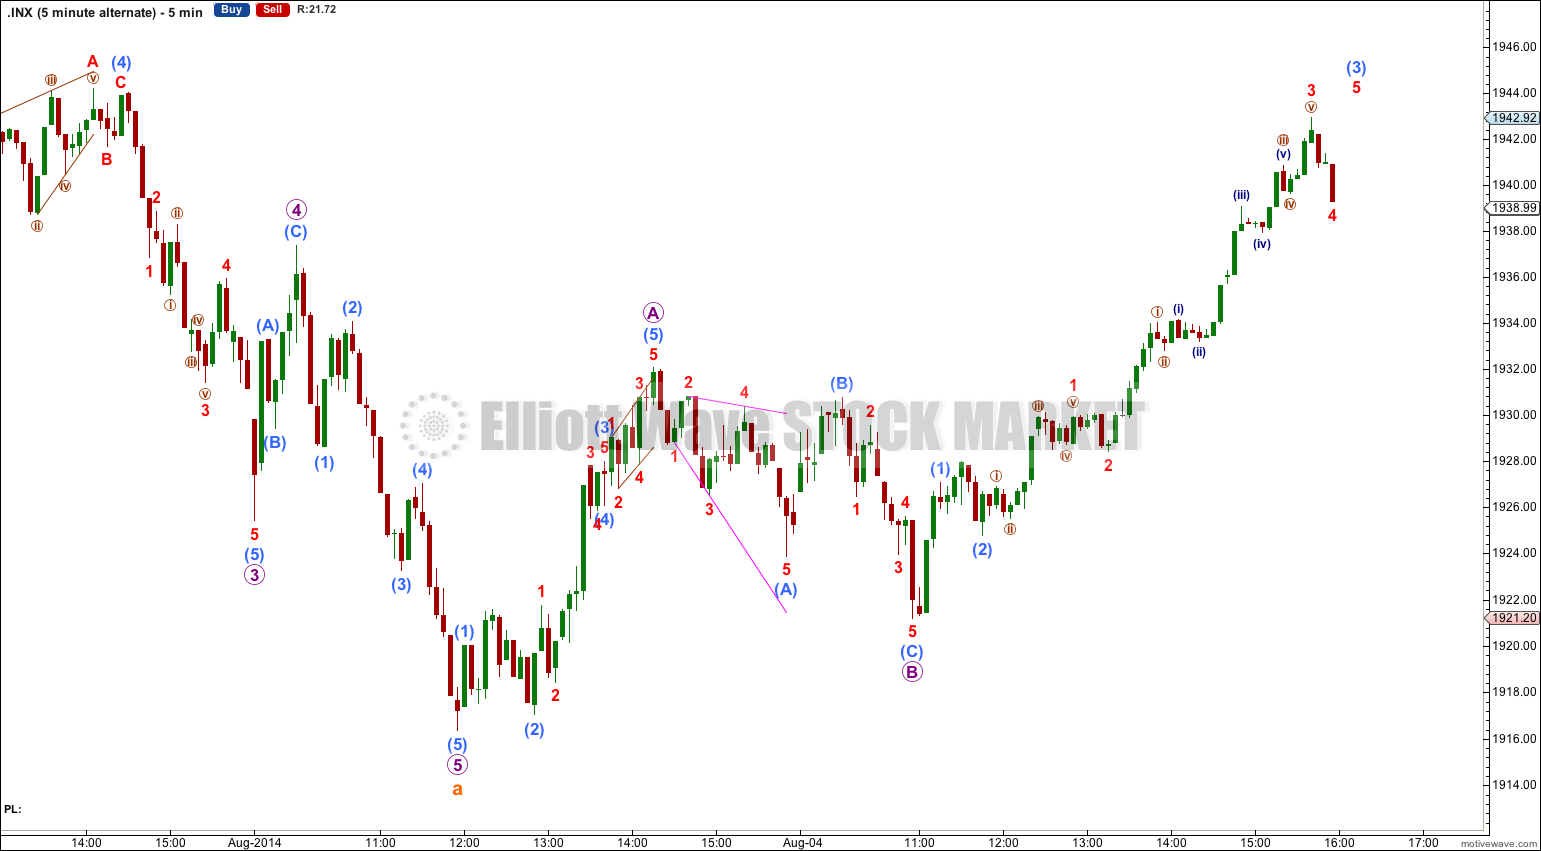
Main Hourly Wave Count.
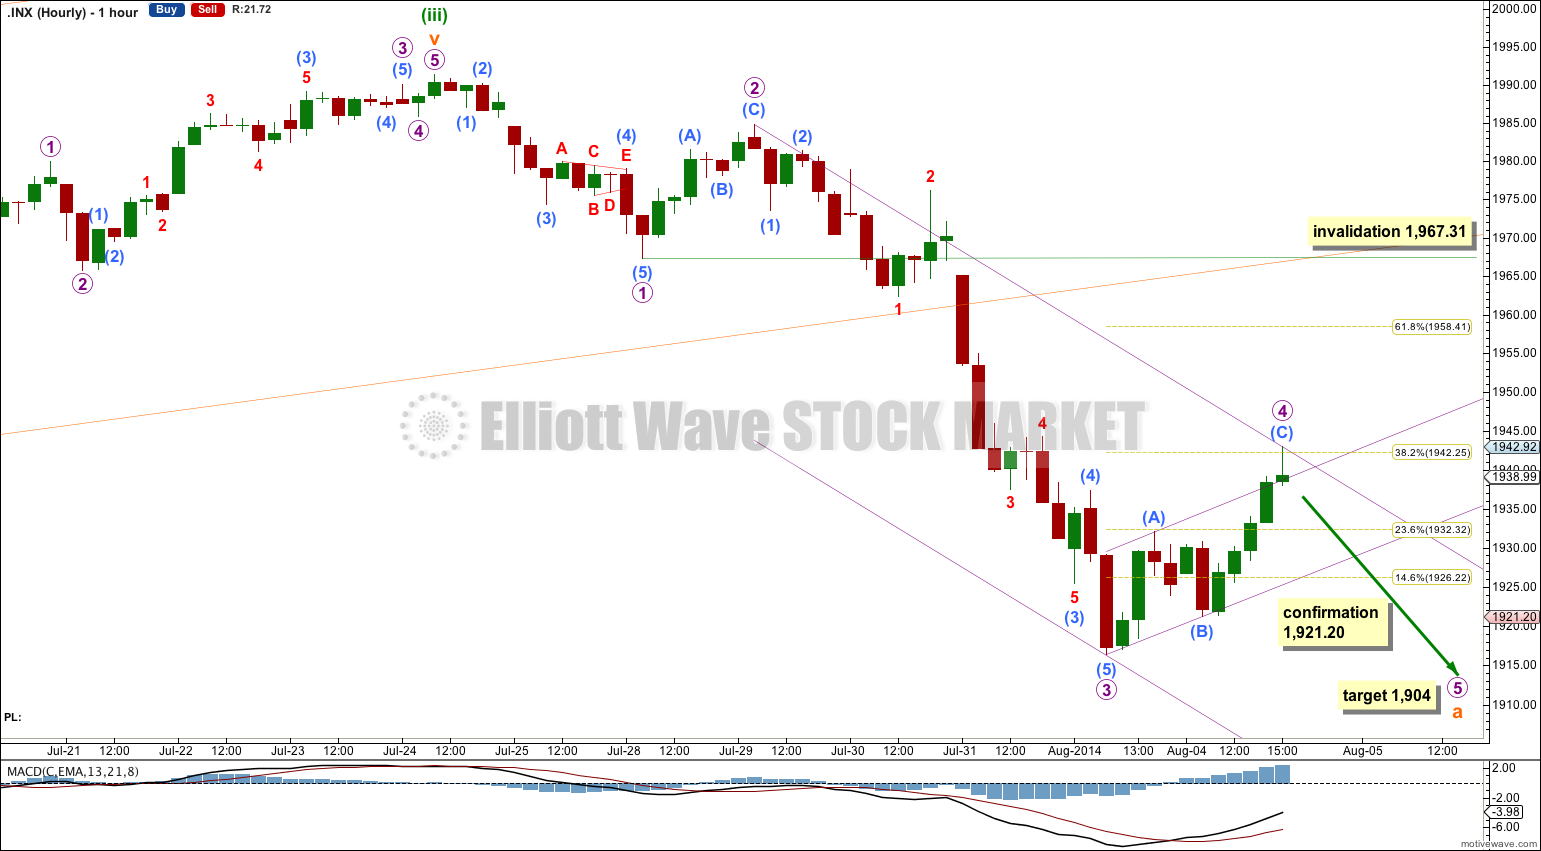
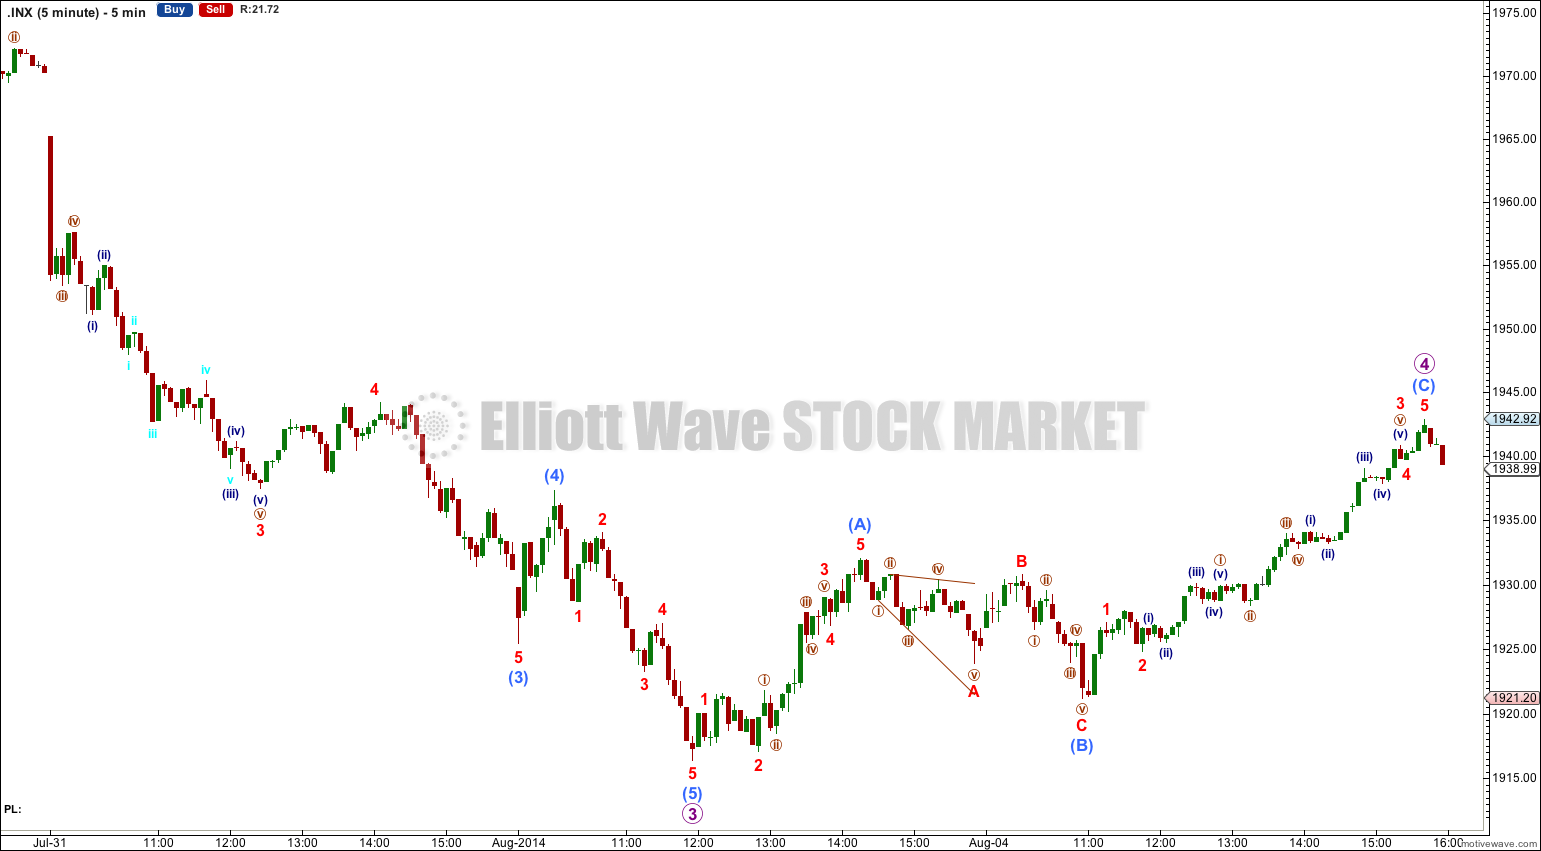
This main wave count has the best overall look and all subdivisions fit on the five minute chart. It expects that minuette wave (iv) will unfold as a zigzag which is the most likely structure to provide alternation with the combination of minuette wave (ii).
So far to the downside it looks like a five wave impulse is almost complete. Micro wave 3 is 5.44 points longer than 2.618 the length of micro wave 1 (this is a 7.9% variation; I consider less than 10% acceptable). At 1,904 micro wave 5 would reach 1.618 the length of micro wave 1. However, as there is already a Fibonacci ratio between micro waves 1 and 3 it is less likely that micro wave 5 would also exhibit a Fibonacci ratio. The purple channel may be a better guide to where micro wave 5 may end. It would most likely at least make a slight new low below the end of micro wave 3 at 1,918.37 to avoid a truncation, and is most likely to end mid way within the channel. It may also, less likely, end at the lower edge of the channel.
If micro wave 4 continues higher it may not move into micro wave 1 price territory above 1,967.31.
There is alternation between micro waves 2 and 4 although both are zigzags. Micro wave 2 was a deep 73% correction. Within micro wave 2 submicro wave (C) is shorter than submicro wave (A). Micro wave 4 is a shallow 39% correction. Within micro wave 4 submicro wave (C) is longer than submicro wave (A).
One more wave down would give subminuette wave a a typical look as a five wave impulse. It would also allow the fifth wave to show lesser momentum and for divergence between price and MACD to develop.
If this wave count is correct then when subminuette wave a is complete subminuette wave b should unfold over the next few days. It may be very choppy and overlapping or it may be a brief sharp zigzag.
Alternate Hourly Wave Count.
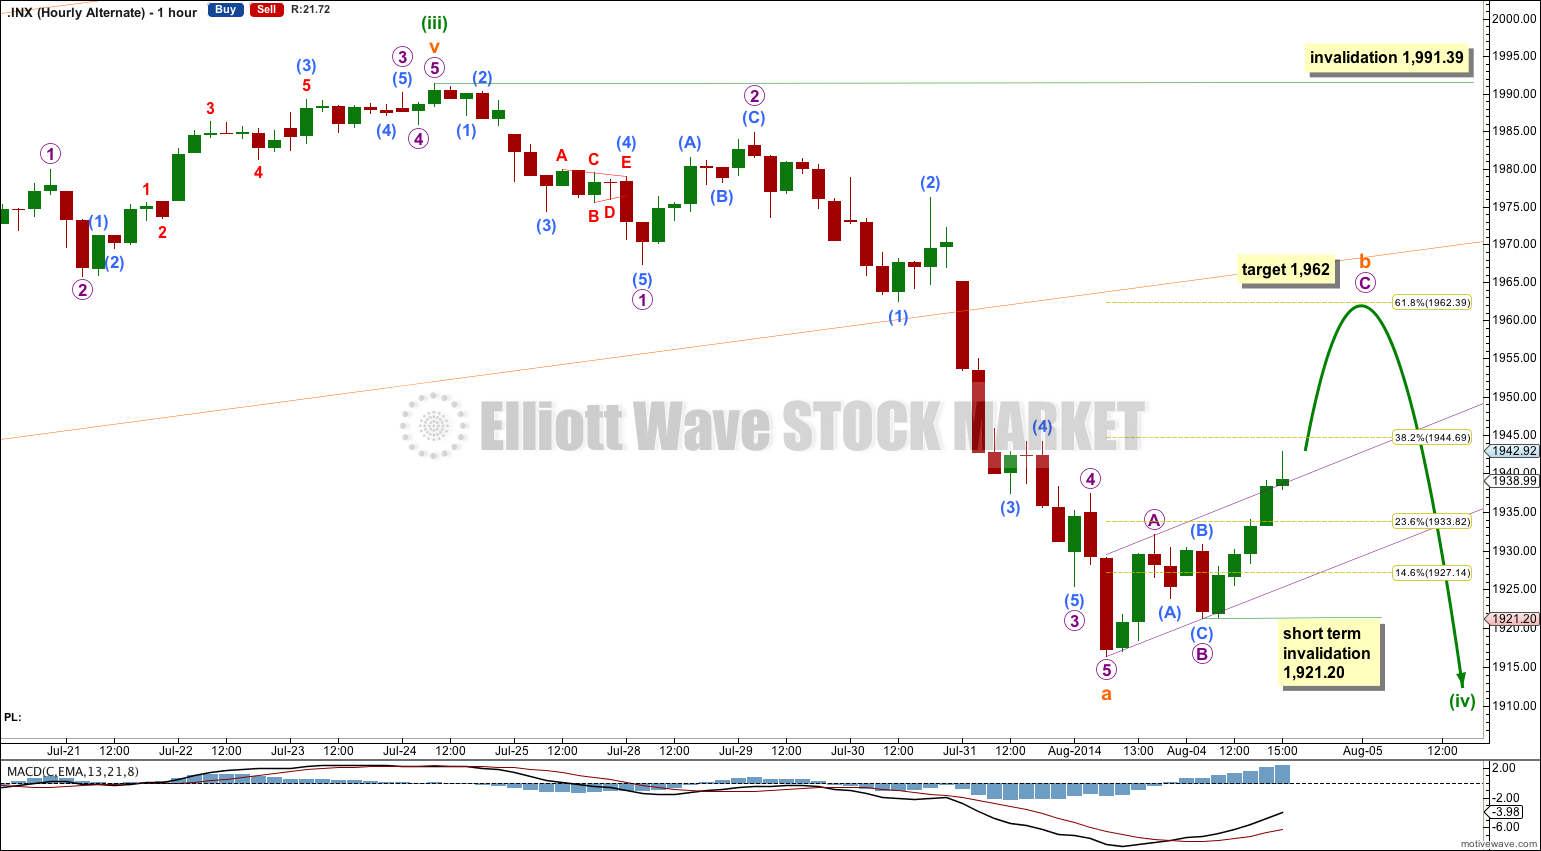
It is possible that subminuette wave a is a completed five wave impulse downwards. However, for this alternate subminuette wave a does not look like an obvious five wave structure because micro waves 2 and 4 are disproportionate. Here subminuette wave a looks more like a three. This reduces the probability of this wave count to an alternate.
Ratios within subminuette wave a are: micro wave 3 is 3.60 points short of 2.618 the length of micro wave 1, and micro wave 5 is just 1.73 points short of 0.382 the length of micro wave 3.
Ratios within micro wave 3 are: submicro wave (3) is just 2.49 points longer than 1.618 the length of submicro wave (1), and submicro wave (5) has no Fibonacci ratio to submicro waves (3) or (1).
Subminuette wave b may be unfolding as a zigzag. At 1,962 micro wave C would reach 2.618 the length of micro wave A and subminuettte wave b would end close to the 0.618 Fibonacci ratio of subminuette wave a, ending just below the lower edge of the orange channel copied over from the daily chart.
Subminuette wave b may not move beyond the start of subminuette wave a above 1,991.39.
Bearish Alternate Wave Count
This bearish alternate wave count expects that the correction is not over. The flat correction which ended at 666.79 was only cycle wave a (or w) of a larger super cycle second wave correction.
The structure and subdivisions within primary wave C for the bear wave count are the same as for intermediate wave (1) for the bull wave count. Thus the short to mid term outlook is identical.
The differentiation between the bull and bear wave count is the maroon – – – channel. The bull wave count should see price remain above the lower maroon – – – trend line. The bear wave count requires a clear breach of this trend line. If this trend line is breached by a full weekly candlestick below it and not touching it then this bear wave count would be my main wave count and I would then calculate downwards targets.
We should always assume the trend remains the same until proven otherwise; the trend is your friend. While price remains above the lower maroon – – – trend line I will assume that the S&P 500 remains within a bull market.
This analysis is published about 06:58 p.m. EST.