
Downwards movement was expected. We have a new low and a red candlestick.
I have a new alternate wave count for you.
Summary: Another fourth wave correction may have arrived last Friday. This would be fully confirmed with movement below 1,955.59. We may get this confirmation this week. This correction may last either 13 or 21 days. In the short term for tomorrow I expect a third wave down to continue towards 1,946. A third wave down would be confirmed with a new low below 1,962.42.
Click on charts to enlarge.
The aqua blue trend lines are critical. Draw the first trend line from the low of 1,158.66 on 25th November, 2011 to the next swing low at 1,266.74 on 4th June, 2012. Create a parallel copy and place it on the low at 1,560.33 on 24th June, 2013. While price remains above the lower of these two aqua blue trend lines we must assume the trend remains upwards. This is the main reason for the bullish wave count being my main wave count.
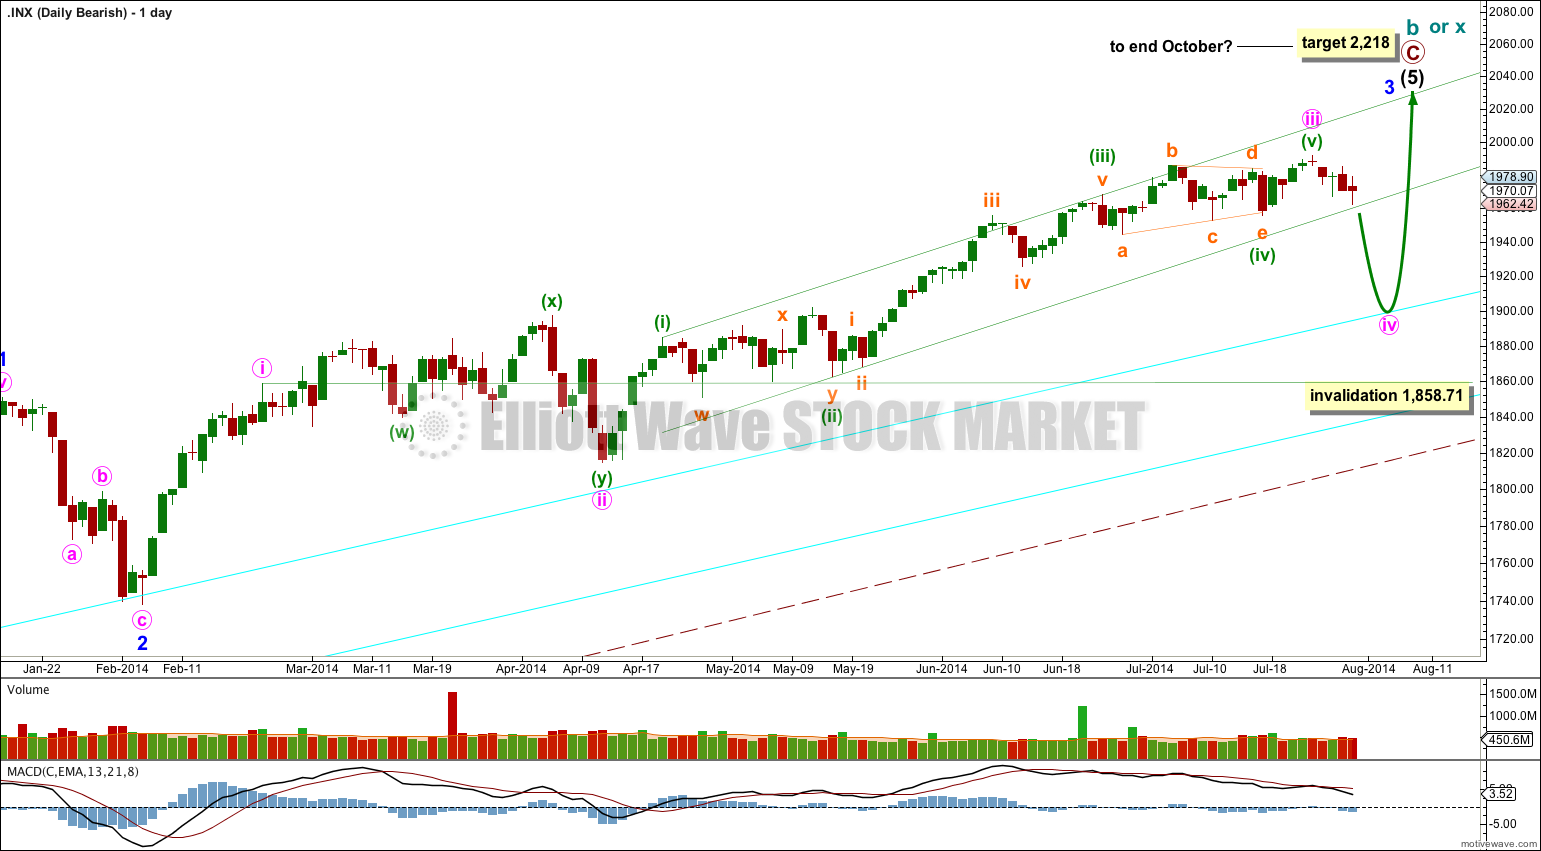
Bullish Wave Count.
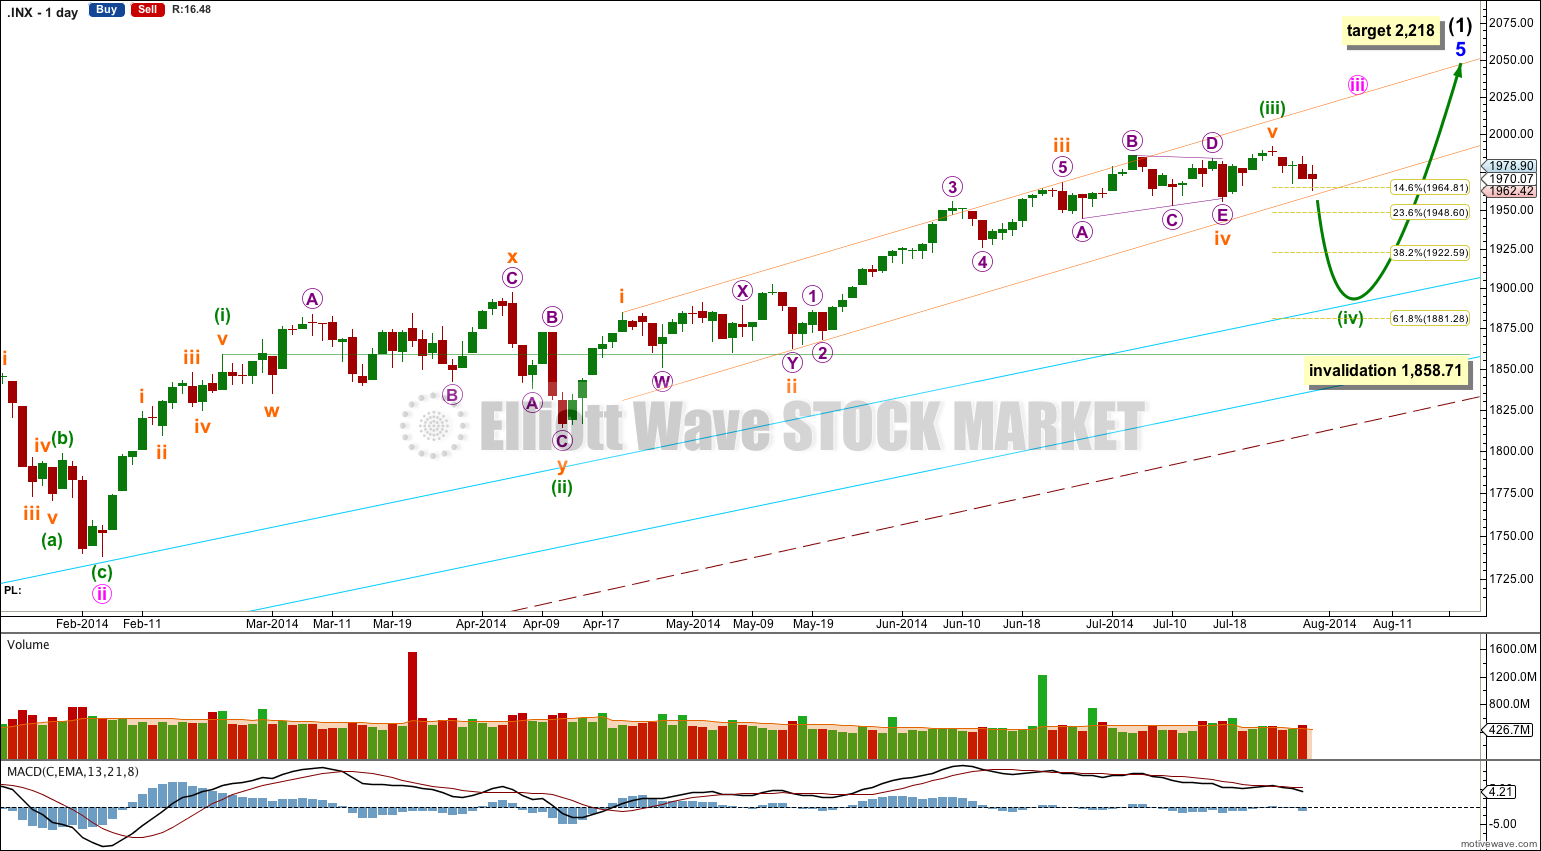
There are a couple of things about this wave count of which I am confident. I see minor wave 3 within intermediate wave (1) as over at 1,729.86 (19th September, 2013). It has the strongest upwards momentum and is just 0.76 longer than 2.618 the length of minor wave 1. At 455 days duration this is a remarkably close Fibonacci ratio. The subdivisions within it are perfect. If this is correct then minor wave 4 ends at 1,646.47 and this is where minor wave 5 begins.
Minor wave 5 may be only one of two structures: a simple impulse or an ending diagonal. At this stage an ending diagonal looks very unlikely; minor wave 5 is unfolding as an impulse. If minor wave 5 has passed its middle then I would expect to see more divergence between price and MACD develop over coming weeks.
Along the way up towards the final target I would expect to see two more corrections complete: the current correction for minuette wave (iv) and one more for minute wave iv.
Minuette wave (iv) may not move into minuette wave (i) price territory below 1,858.71.
At 2,218 minor wave 5 would reach equality in length with minor wave 3. This target may be met in October.
I have drawn a parallel channel about minuette wave (iii) using Elliott’s first technique: draw the first trend line from the highs of subminuette waves i to iii, then place a parallel copy on the low of subminuette wave ii. A clear breach of this channel to the downside would provide strong confirmation that minuette wave (iv) has arrived. Minuette wave (iv) may reach as low as the 0.618 Fibonacci ratio of minuette wave (iii) at 1,881.28, which would provide alternation in depth of correction between minuette waves (ii) and (iv). Downwards movement may find final support about or just above the upper aqua blue trend line, continuing a pattern which has lasted about a year now.
The large maroon – – – channel is copied over from the weekly chart. It is drawn in exactly the same way on bull and bear wave counts. For the bull wave count this channel is termed a base channel about primary waves 1 and 2. A lower degree second wave should not breach the lower edge of a base channel drawn about a first and second wave one or more degrees higher. The lower maroon – – – trend line differentiates the bull and bear wave counts at cycle degree and monthly chart level.
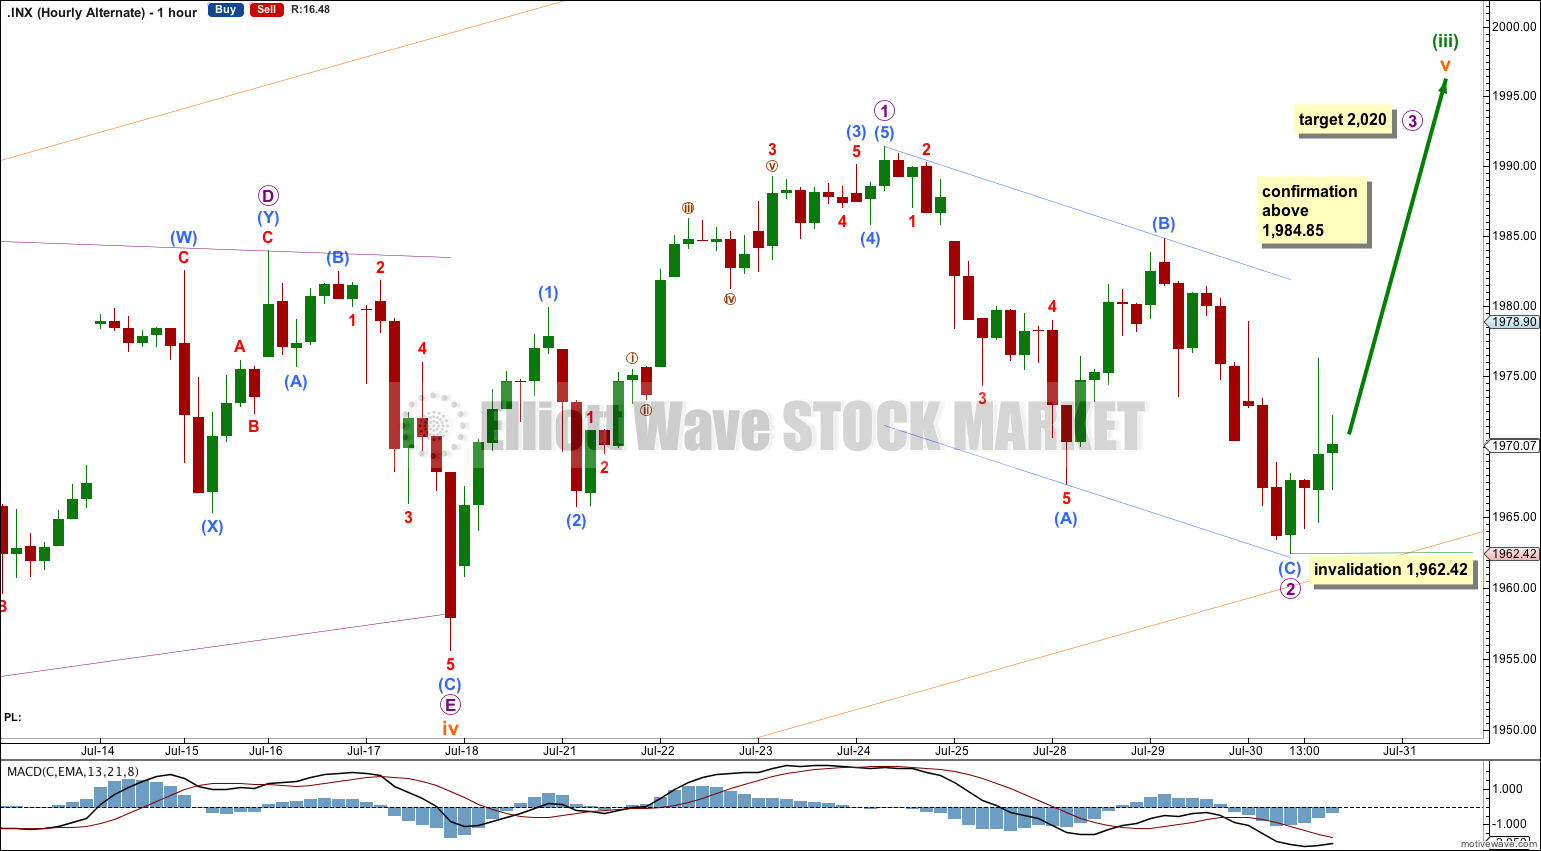
Main Hourly Wave Count.
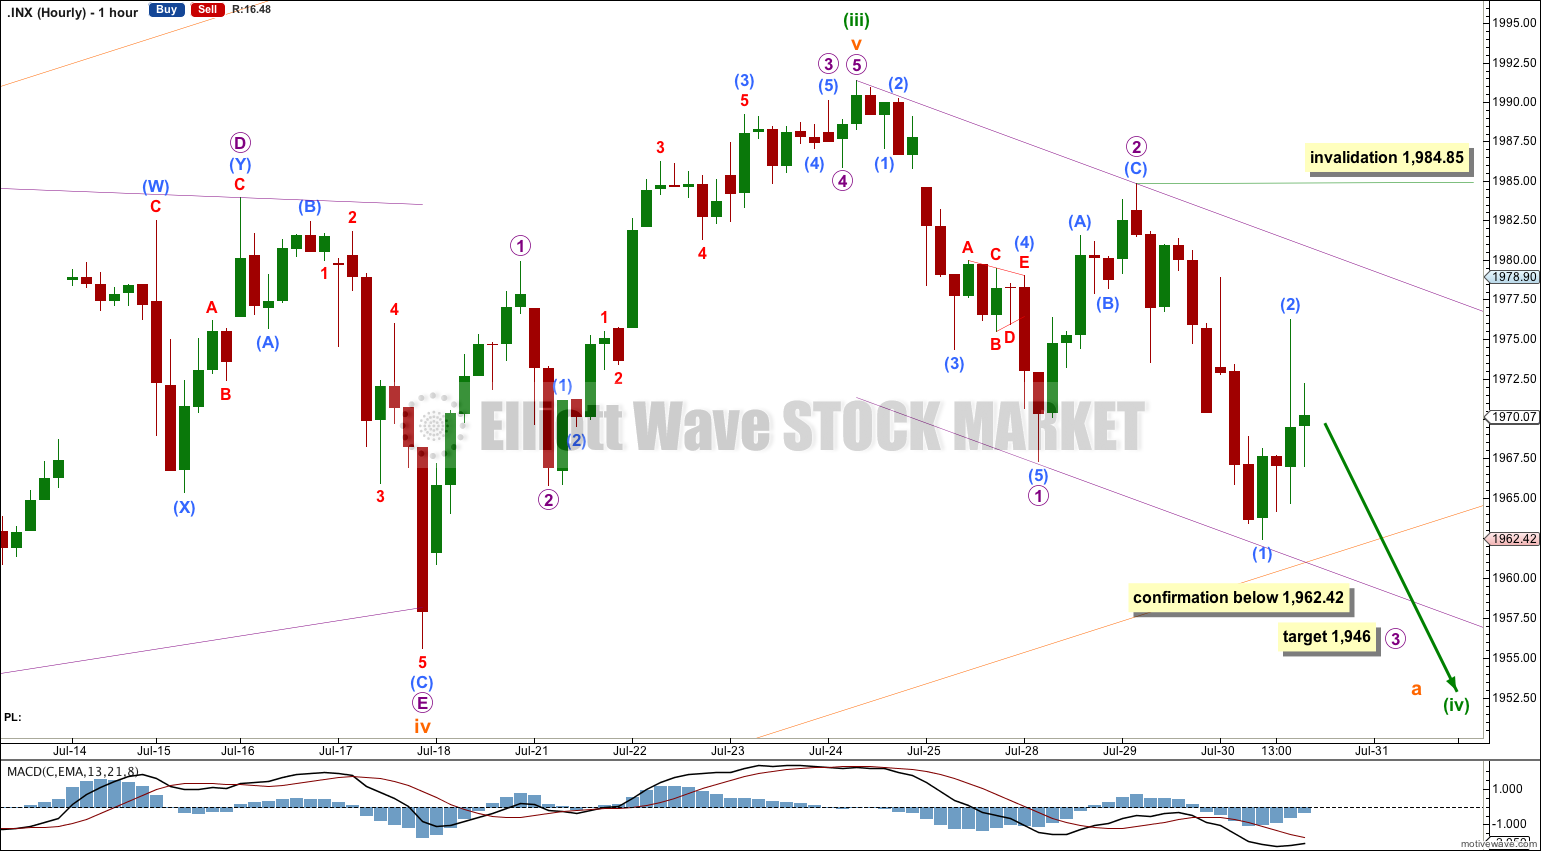
If this main hourly wave count is correct then it should be confirmed tomorrow with a new low below 1,962.42. At that point I would have confidence that a third wave down is underway. Further downwards movement to a new low below 1,955.59 would provide full confidence.
At 1,946 micro wave 3 would reach 1.618 the length of micro wave 1.
The purple channel is a base channel about micro waves 1 and 2. Any further upwards movement should find strong resistance at the upper edge of this channel. If a third wave down is beginning then it should have the strength to break through support at the lower edge of this channel. If this wave count is correct that should happen tomorrow.
This main hourly wave count expects that minuette wave (iv) will unfold as a zigzag or multiple zigzag structure. Within a single or multiple zigzag wave A subdivides as a five. This is the most likely type of structure for this fourth wave position given the guideline of alternation.
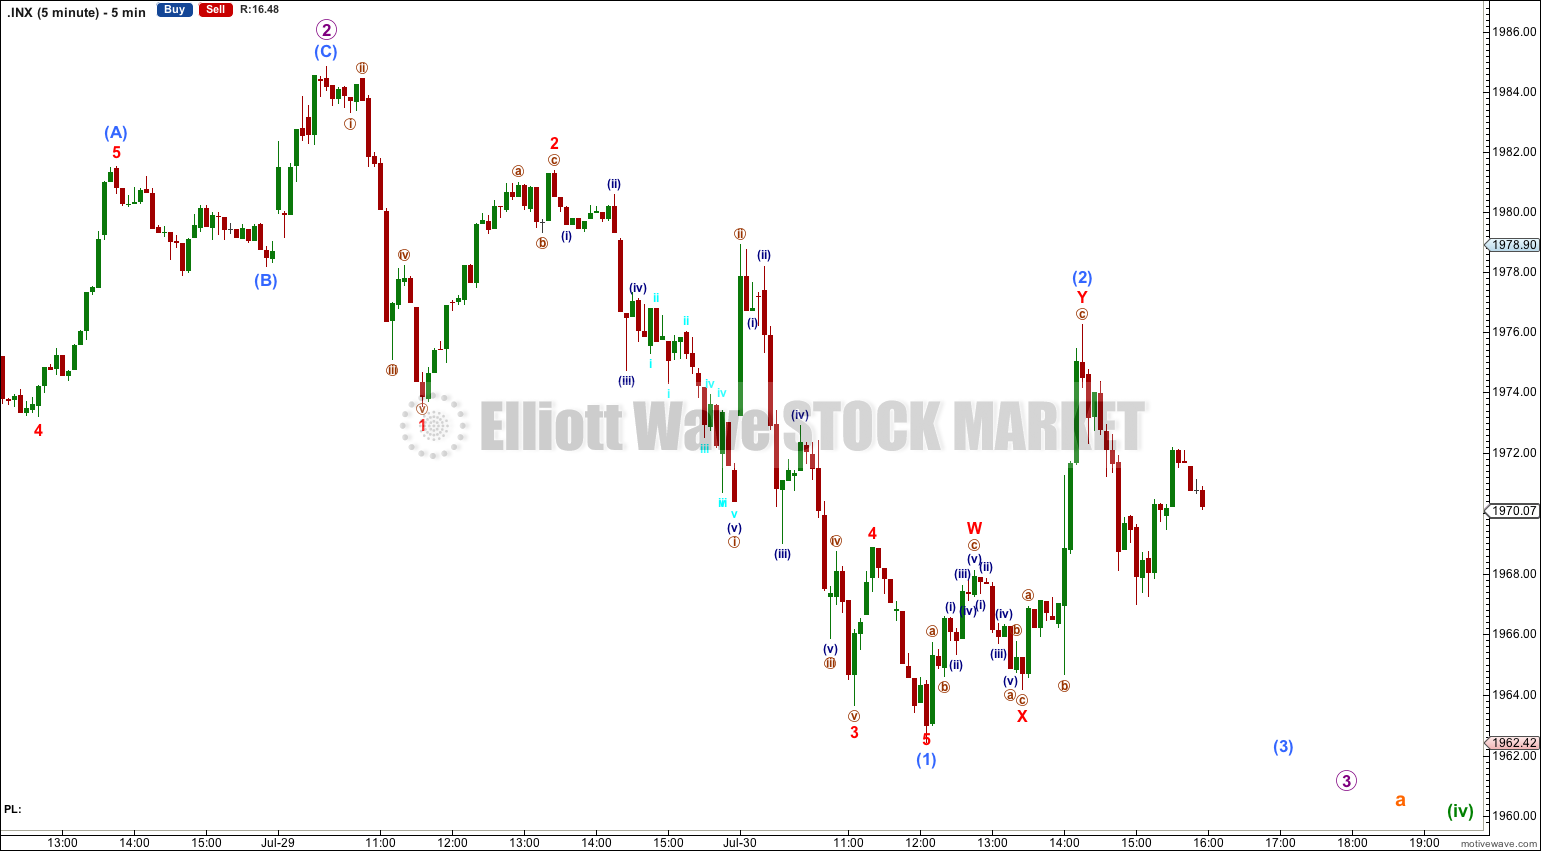
Within micro wave 3 if submicro wave (2) moves higher it may not move beyond the start of submicro wave (1) above 1,984.85.
First Alternate Hourly Wave Count.
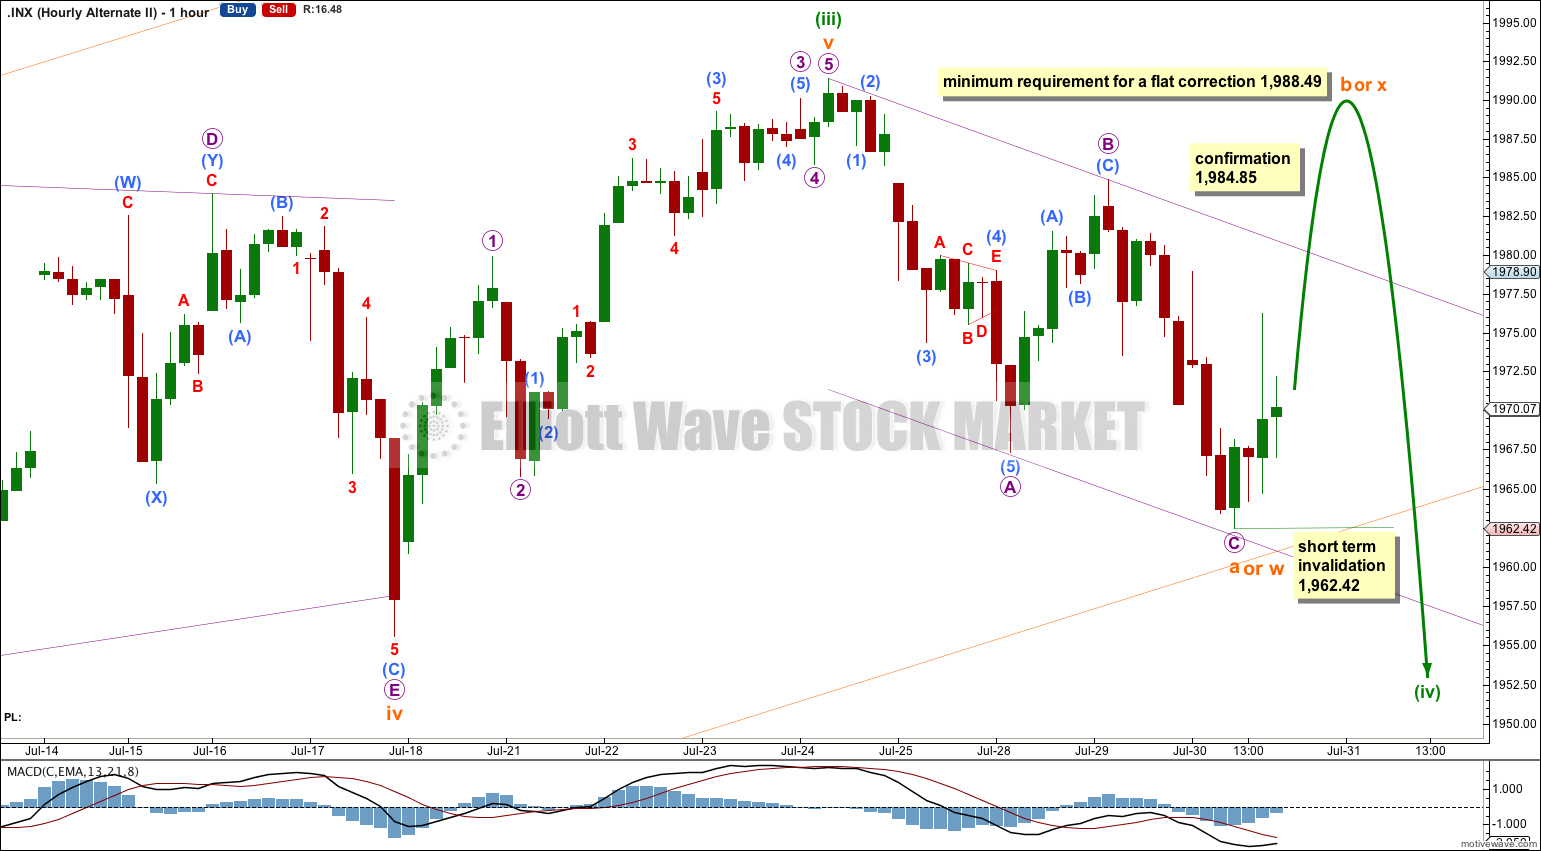
Although minuette wave (iv) is very likely to subdivide as a single or multiple zigzag structure, this is not the only possible structure which would provide some alternation with minuette wave (ii).
Minuette wave (iv) may also subdivide as a triangle, single flat correction or multiple flat correction. It may also subdivide as a double combination although then it would have no structural alternation with minuette wave (ii). Alternation is a guideline, not a rule, and does not have to always be expressed in structure. It can be expressed in alternation within similar structures and in depth. Flexibility is essential when looking for alternation.
So far there is a complete zigzag downwards. This may be subminuette wave a within a triangle or flat correction. It may also be the first part of a combination, although that is the least likely option.
If minuette wave (iv) is a flat correction then within it subminuette wave b must reach a minimum 90% the length of subminuette wave a. This would be achieved at 1,988.49.
If minuette wave (iv) is a triangle there is no minimum upwards price point which must be reached for subminuette wave b.
For both a flat and triangle the B wave may move beyond the start of the A wave, as in an expanded flat or running triangle. This means that a new high above 1,991.39 is possible and could still be part of this fourth wave correction.
In the short term if the upper edge of the channel is breached by upwards movement tomorrow then this wave count would have earliest indication it may be correct. It would be confirmed with movement above 1,984.85.
Any movement to a new low below 1,962.42 tomorrow would invalidate this wave count.
Second Alternate Hourly Wave Count.
By simply moving the degree of labeling within subminuette wave v down one degree it is possible that only the first wave within it is complete.
This alternate expects subminuette wave v to be a long extension. In my experience fifth waves following triangles are more often short than long so this wave count has a lower probability than the main wave count.
Micro wave 2 is now a complete zigzag. Submicro wave (C) found support exactly at the lower edge of the channel about this zigzag. This structure looks perfect.
Within micro wave 3 no second wave correction may move beyond its start below 1,962.42.
Bearish Alternate Wave Count
This bearish alternate wave count expects that the correction is not over. The flat correction which ended at 666.79 was only cycle wave a (or w) of a larger super cycle second wave correction.
The structure and subdivisions within primary wave C for the bear wave count are the same as for intermediate wave (1) for the bull wave count. Thus the short to mid term outlook is identical.
The differentiation between the bull and bear wave count is the maroon – – – channel. The bull wave count should see price remain above the lower maroon – – – trend line. The bear wave count requires a clear breach of this trend line. If this trend line is breached by a full weekly candlestick below it and not touching it then this bear wave count would be my main wave count and I would then calculate downwards targets.
We should always assume the trend remains the same until proven otherwise; the trend is your friend. While price remains above the lower maroon – – – trend line I will assume that the S&P 500 remains within a bull market.
This analysis is published about 09:40 p.m. EST.