
A member has asked (in the nicest possible way) for me to update Nasdaq charts. Here it is.
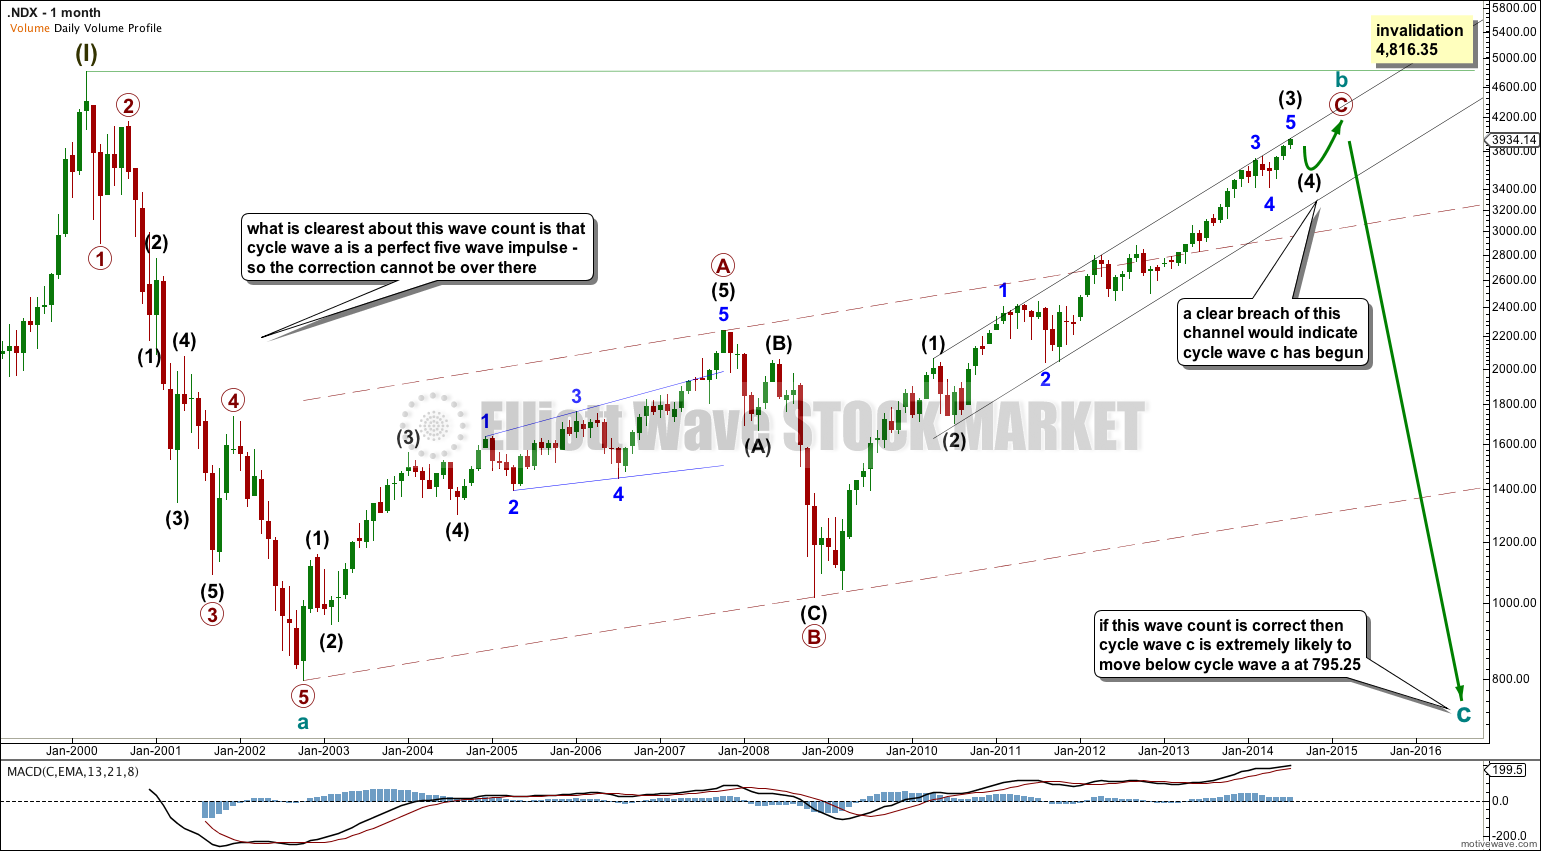
The clearest thing on the monthly chart is the big move downwards ending at 795.25 in October 2002. This structure is a five wave impulse. It moves against the trend, so it is corrective. A single five wave structure cannot be a complete correction.
When cycle wave b upwards is complete cycle wave c would be highly likely to move price below 795.25 to avoid a truncation.
Cycle wave b may not move beyond the start of cycle wave a. I would not expect new all time highs above 4,816.35 from the Nasdaq for a long time yet.
I expect a big fourth wave correction to come, before a new high. After that… crash?
Click on the charts below to enlarge.
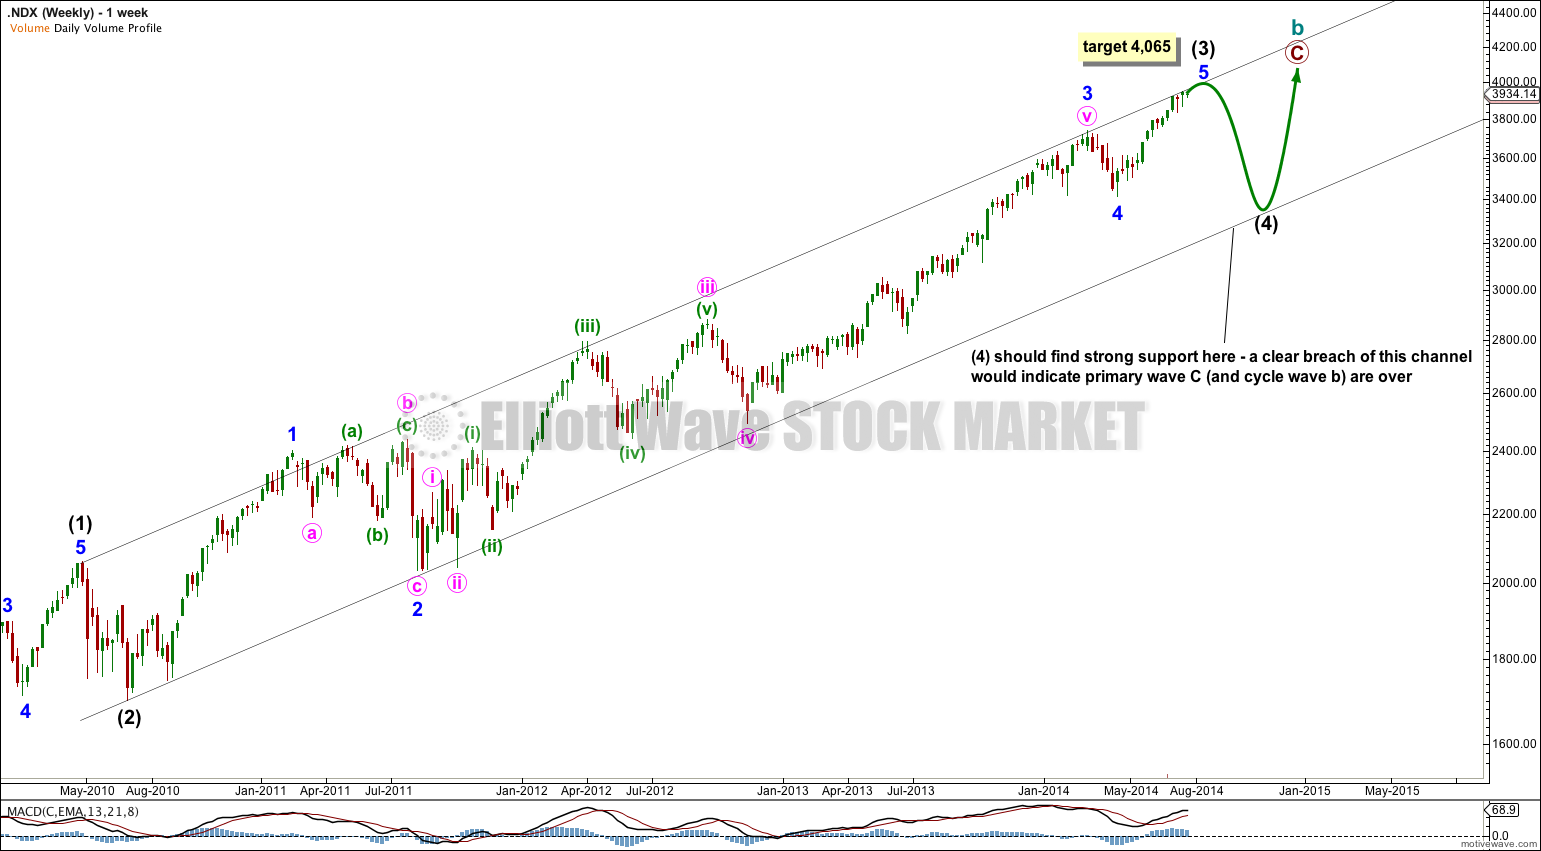
I’m impressed with how intermediate wave (3) fits so nicely in this channel.
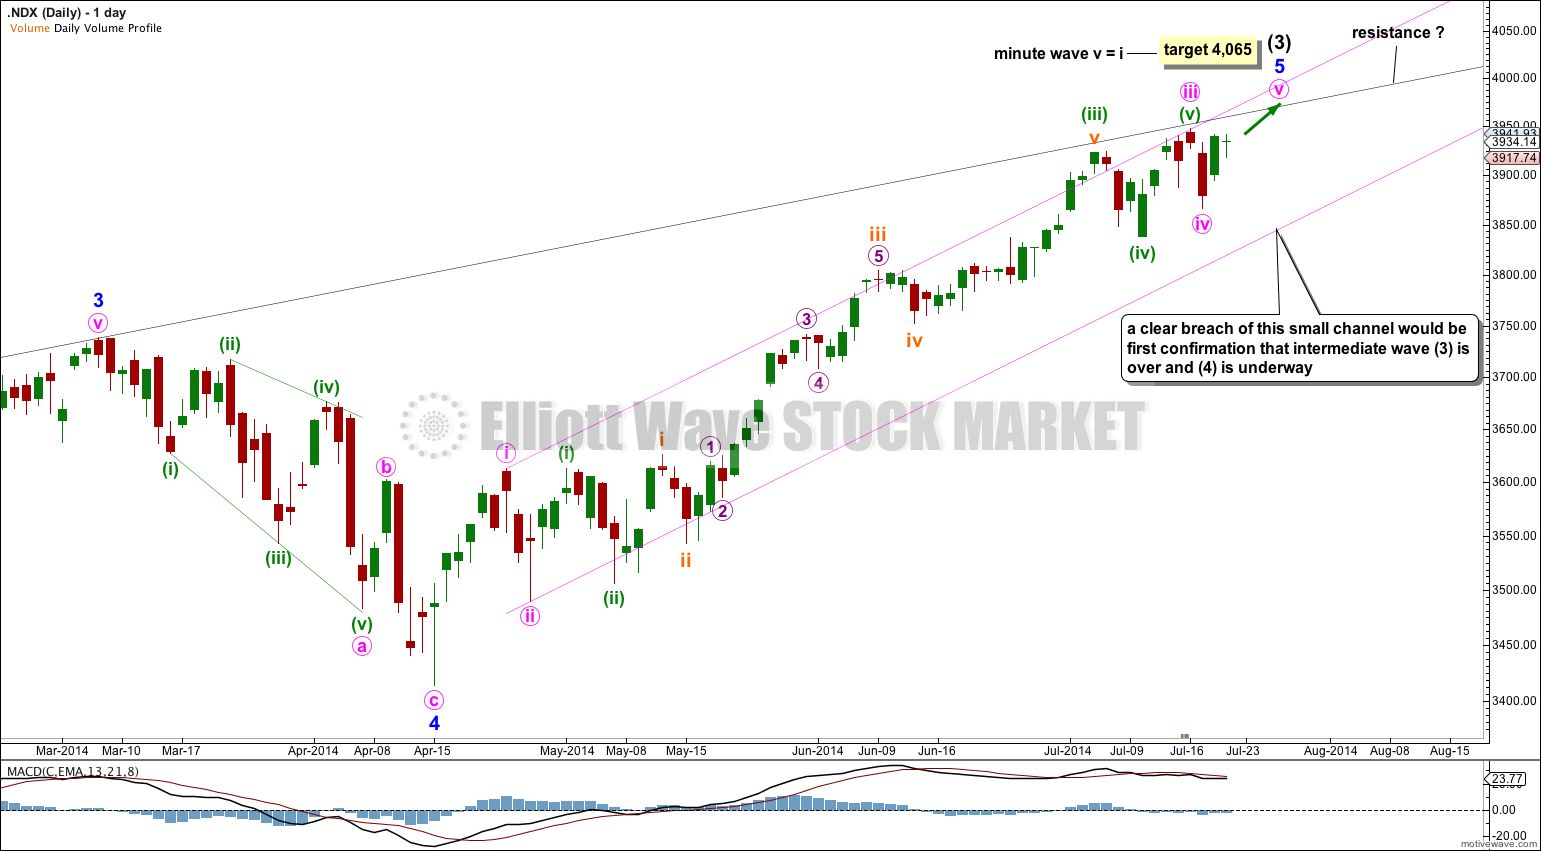
This pink channel is important for indicating the arrival of intermediate wave (4).
– This analysis is for members only,