
The main hourly Elliott wave count was invalidated by upwards movement. I still expect this correction is unfolding and is incomplete.
Summary: The main wave count expects a little more sideways movement before a final wave down to complete this correction. The downwards movement should slightly breach the orange channel on the daily chart. If, however, we see a new high above 1,985.59 the alternate is confirmed and would expect more upwards movement to a target at 2,004 to 2,010.
Click on charts to enlarge.
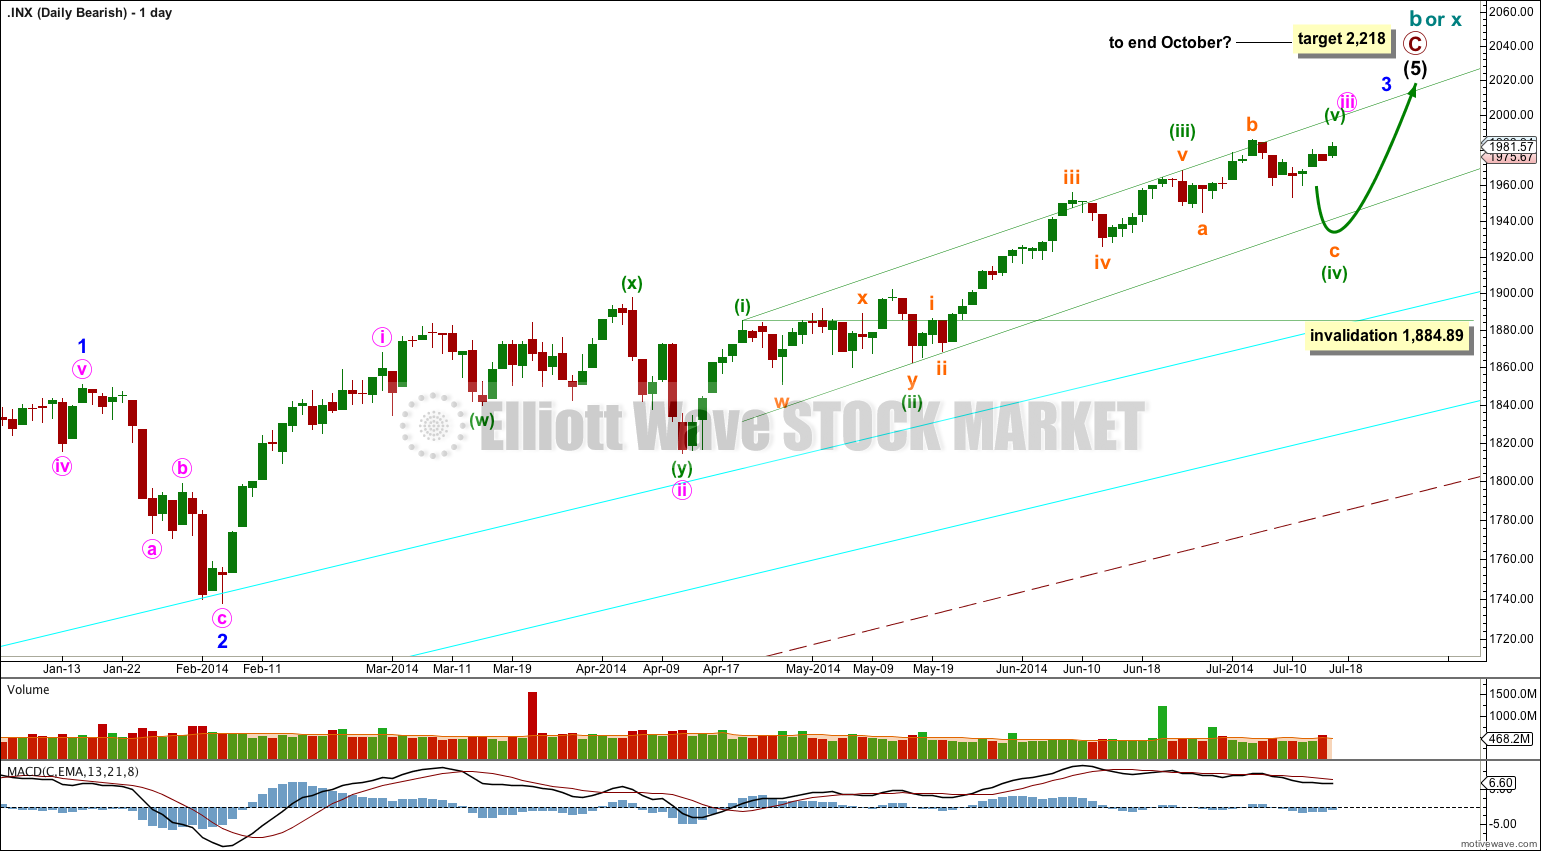
The aqua blue trend lines are critical. Draw the first trend line from the low of 1,158.66 on 25th November, 2011 to the next swing low at 1,266.74 on 4th June, 2012. Create a parallel copy and place it on the low at 1,560.33 on 24th June, 2013. While price remains above the lower of these two aqua blue trend lines we must assume the trend remains upwards. This is the main reason for the bullish wave count being my main wave count.
Bullish Wave Count.
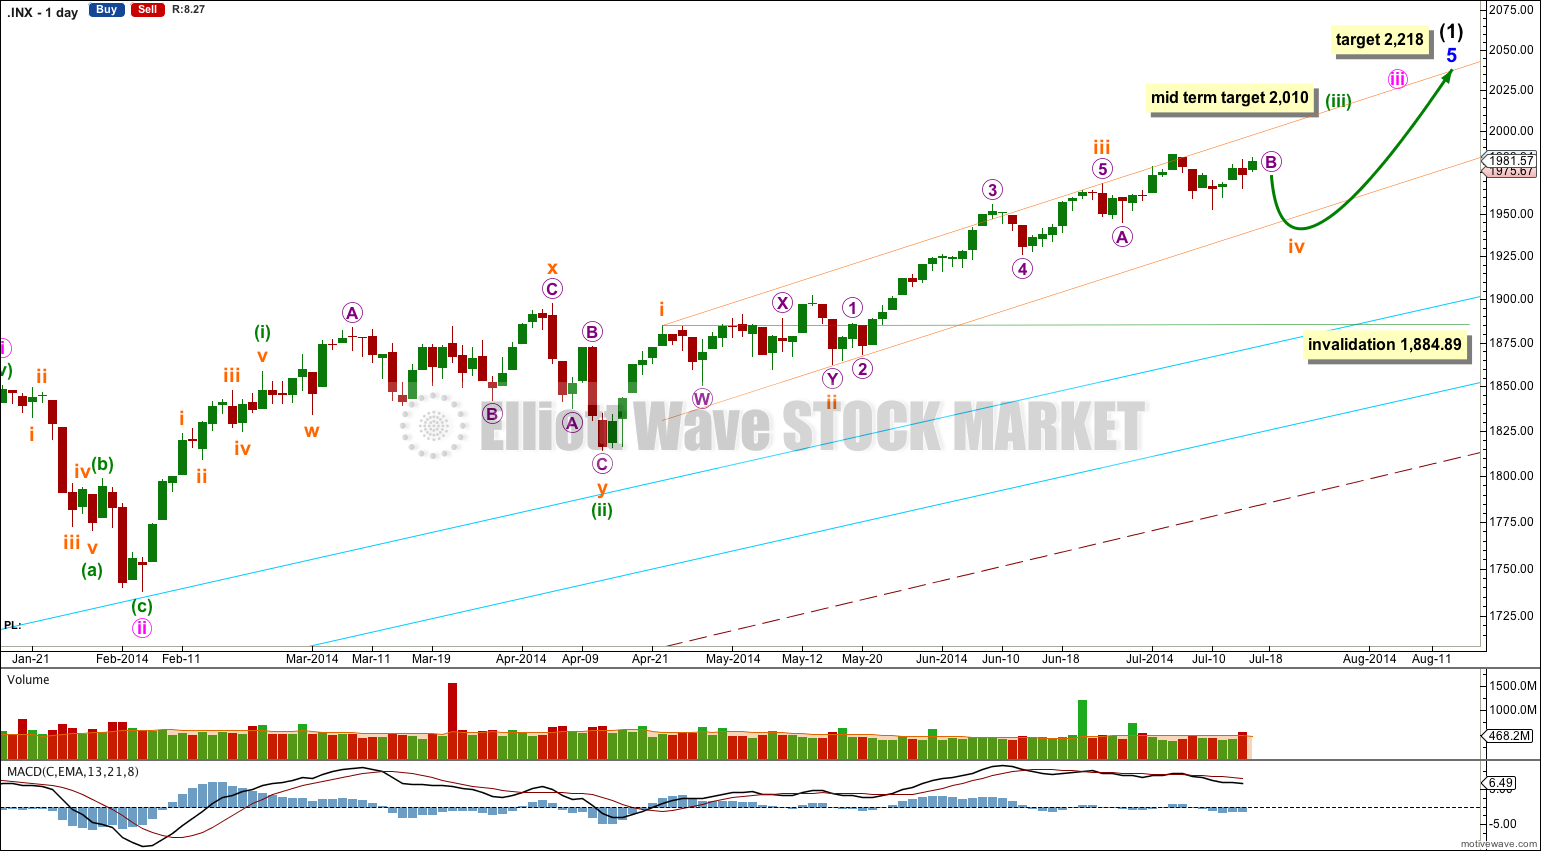
There are a couple of things about this wave count of which I am confident. I see minor wave 3 within intermediate wave (1) as over at 1,729.86 (19th September, 2013). It has the strongest upwards momentum and is just 0.76 longer than 2.618 the length of minor wave 1. At 455 days duration this is a remarkably close Fibonacci ratio. The subdivisions within it are perfect. If this is correct then minor wave 4 ends at 1,646.47 and this is where minor wave 5 begins.
Minor wave 5 may be only one of two structures: a simple impulse or an ending diagonal. At this stage an ending diagonal looks less likely, and most recent upwards movement is looking like a third wave so a more common impulse is more likely.
Along the way up towards the final target I would expect to see three more corrections complete. The first for subminuette wave iv is most likely to be somewhat in proportion to subminuette wave ii which lasted 17 days. So far subminuette wave iv has lasted 15 days and is incomplete.
Subminuette wave iv may not move into subminuette wave i price territory below 1,884.89.
At 2,010 minuette wave (iii) would reach 1.618 the length of minuette wave (i).
At 2,218 minor wave 5 would reach equality in length with minor wave 3. This target may be met in October.
I have drawn a parallel channel about minuette wave (iii) using Elliott’s first technique: draw the first trend line from the highs of subminuette waves i to iii, then place a parallel copy on the low of subminuette wave ii. The upper edge of this channel is slightly overshot, and this may indicate an overshoot on the opposite side may happen when subminuette wave iv ends.
There is still divergence with price trending higher and MACD trending lower on the weekly chart, and a little on the daily chart for most recent movement. This classic technical divergence indicates that a correction should unfold.
The large maroon – – – channel is copied over from the weekly chart. It is drawn in exactly the same way on bull and bear wave counts. For the bull wave count this channel is termed a base channel about primary waves 1 and 2. A lower degree second wave should not breach the lower edge of a base channel drawn about a first and second wave one or more degrees higher. The lower maroon – – – trend line differentiates the bull and bear wave counts at cycle degree and monthly chart level.
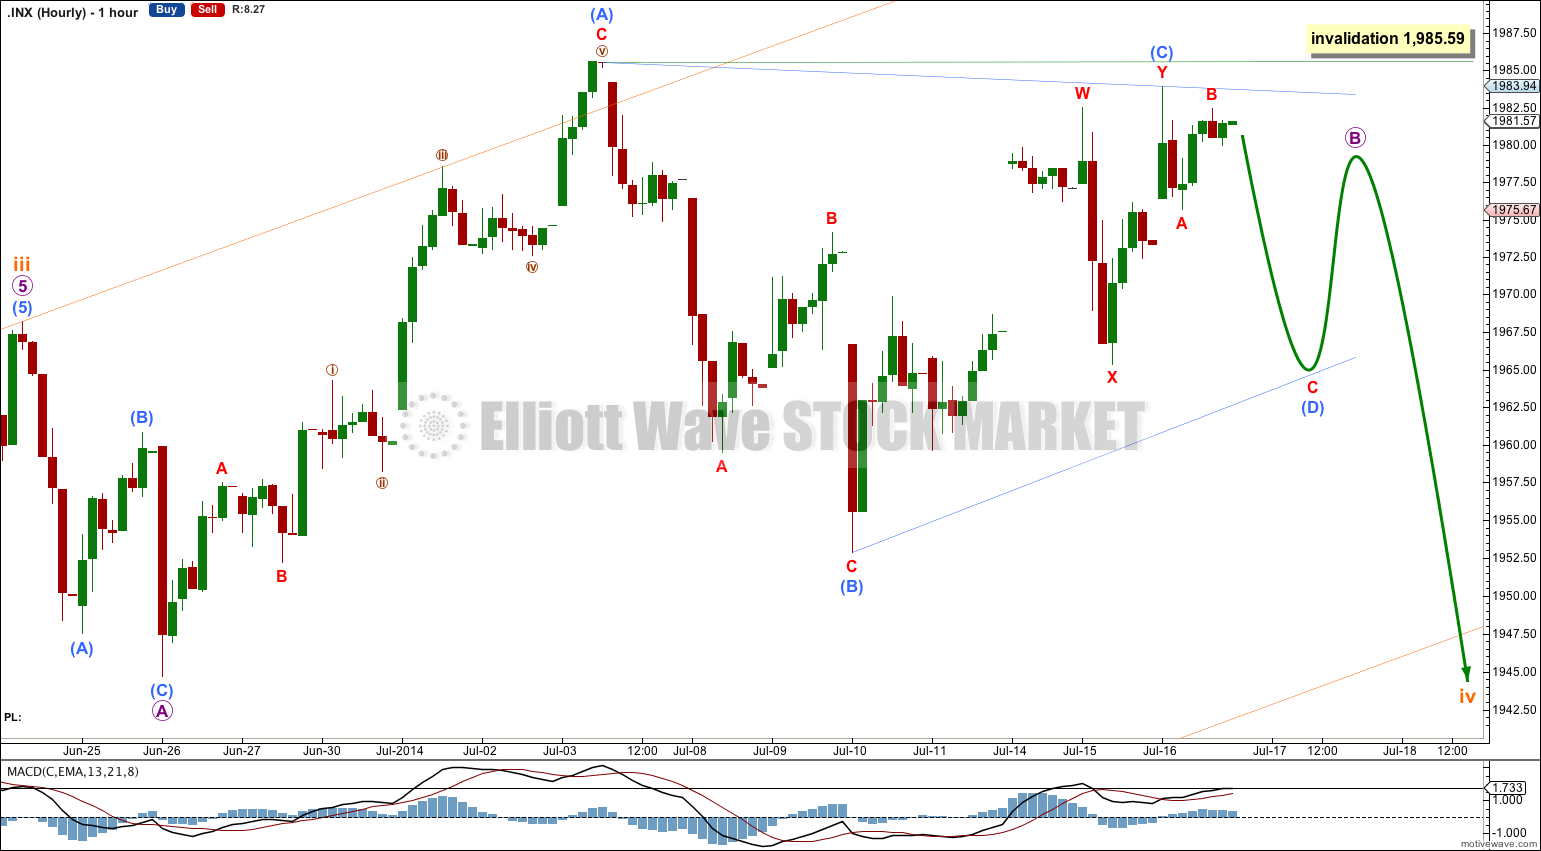
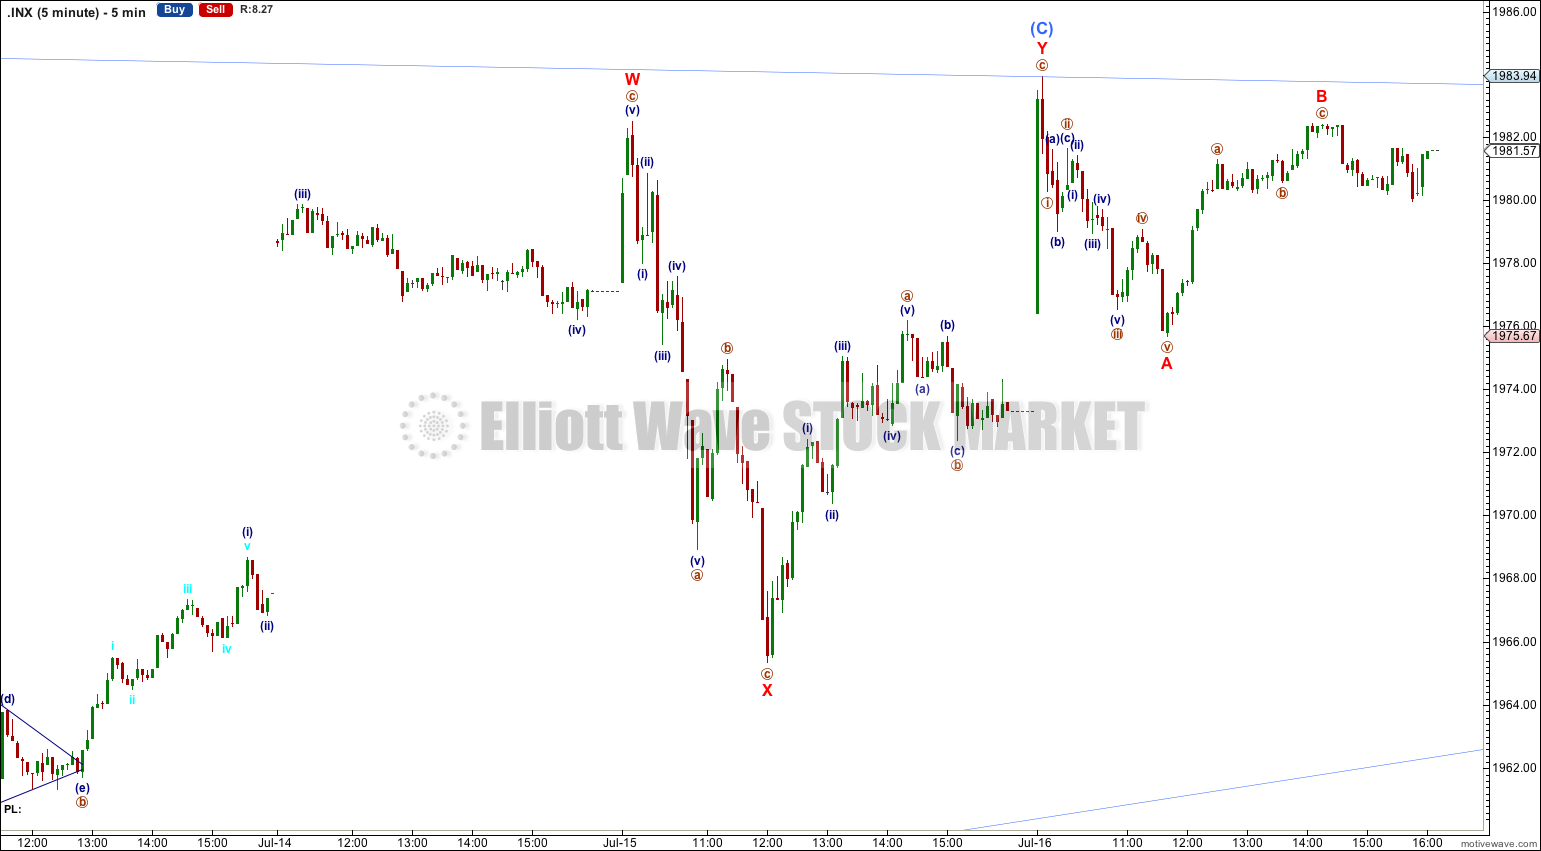
Subminuette wave iv may still be unfolding as an expanded flat correction, but micro wave B within it is most likely incomplete.
Micro wave B may be completing as a regular contracting triangle. Only submicro waves (D) and (E) need to complete.
Within the triangle if submicro wave (C) moves higher it may not move beyond the end of submicro wave (A) above 1,985.59.
At its end micro wave B must effect a new retracement of micro wave A, and it is most likely to effect a retracement between 100% to 138% of micro wave A. Micro wave B is most likely to end between 1,968.17 to 1,977.09.
When micro wave B is complete then micro wave C downwards is extremely likely to make at least a slight new low below the end of micro wave A at 1,944.69 to avoid a truncation and a very rare running flat.
Micro wave C would most likely slightly overshoot the lower edge of the orange channel copied over here from the daily chart.
Alternate Bullish Wave Count.
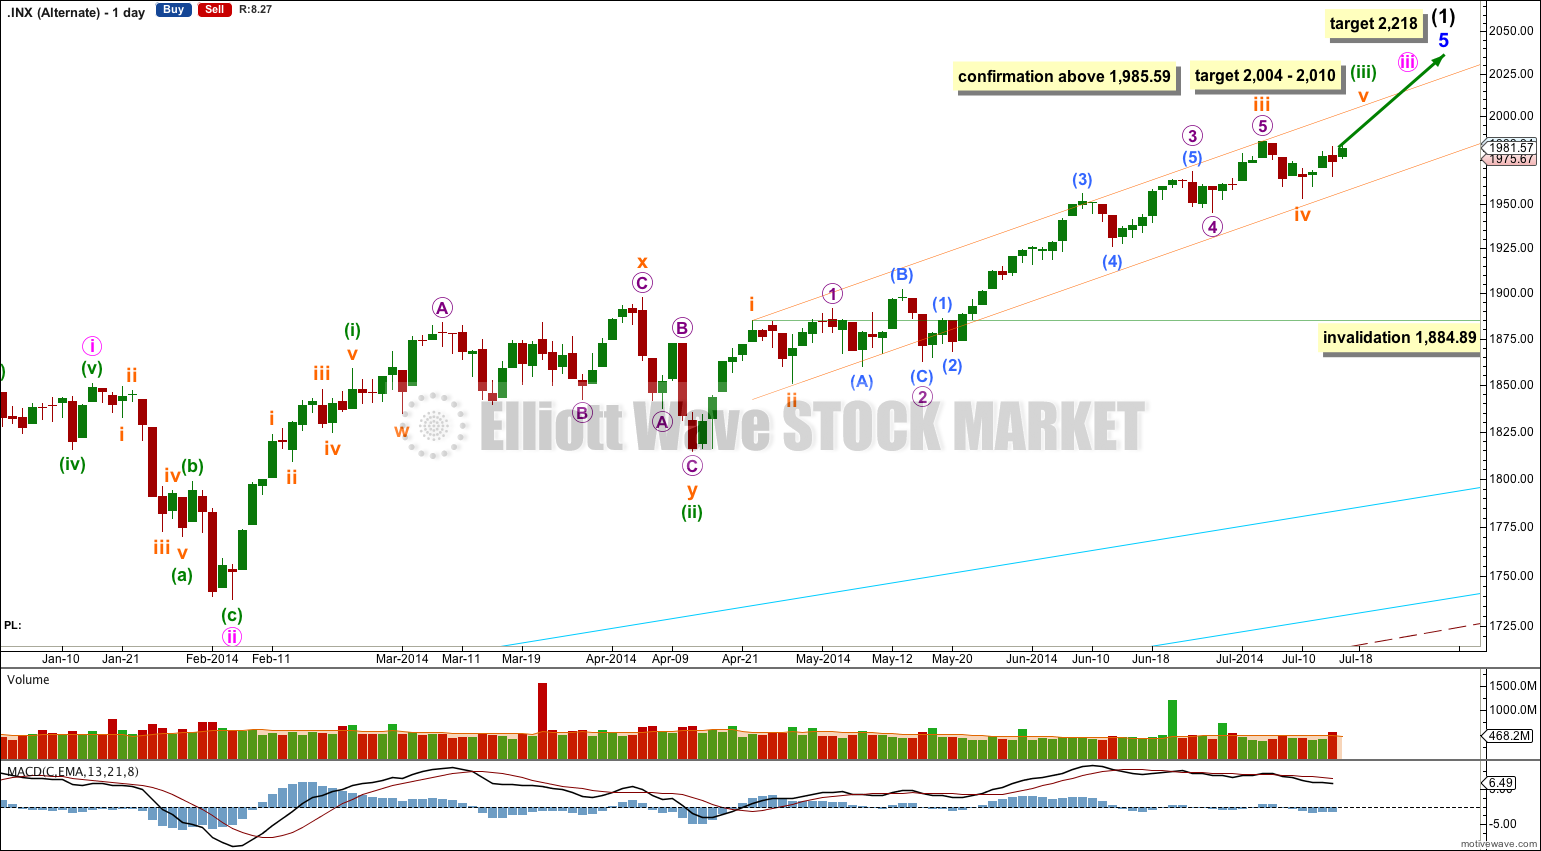
It is possible that subminuette wave iv is complete, as a zigzag that’s nicely in proportion with subminuette wave ii (both waves lasted four days).
Within subminuette wave iii this wave count sees micro wave 2 as a very rare running flat correction. Normally running flats only show up in the middle of very strong movements, but this one is not exactly in the middle of a very strong movement. This reduces the probability significantly for this wave count.
At this stage this wave count would be confirmed with a new high above 1,985.59. If this price point is passed my target for the trend to be interrupted by the next fourth wave correction is 2,004 to 2,010.
At 2,010 minuette wave (iii) would reach 1.618 the length of minuette wave (i). At 2,004 subminuette wave v would reach 0.382 the length of subminuette wave iii.
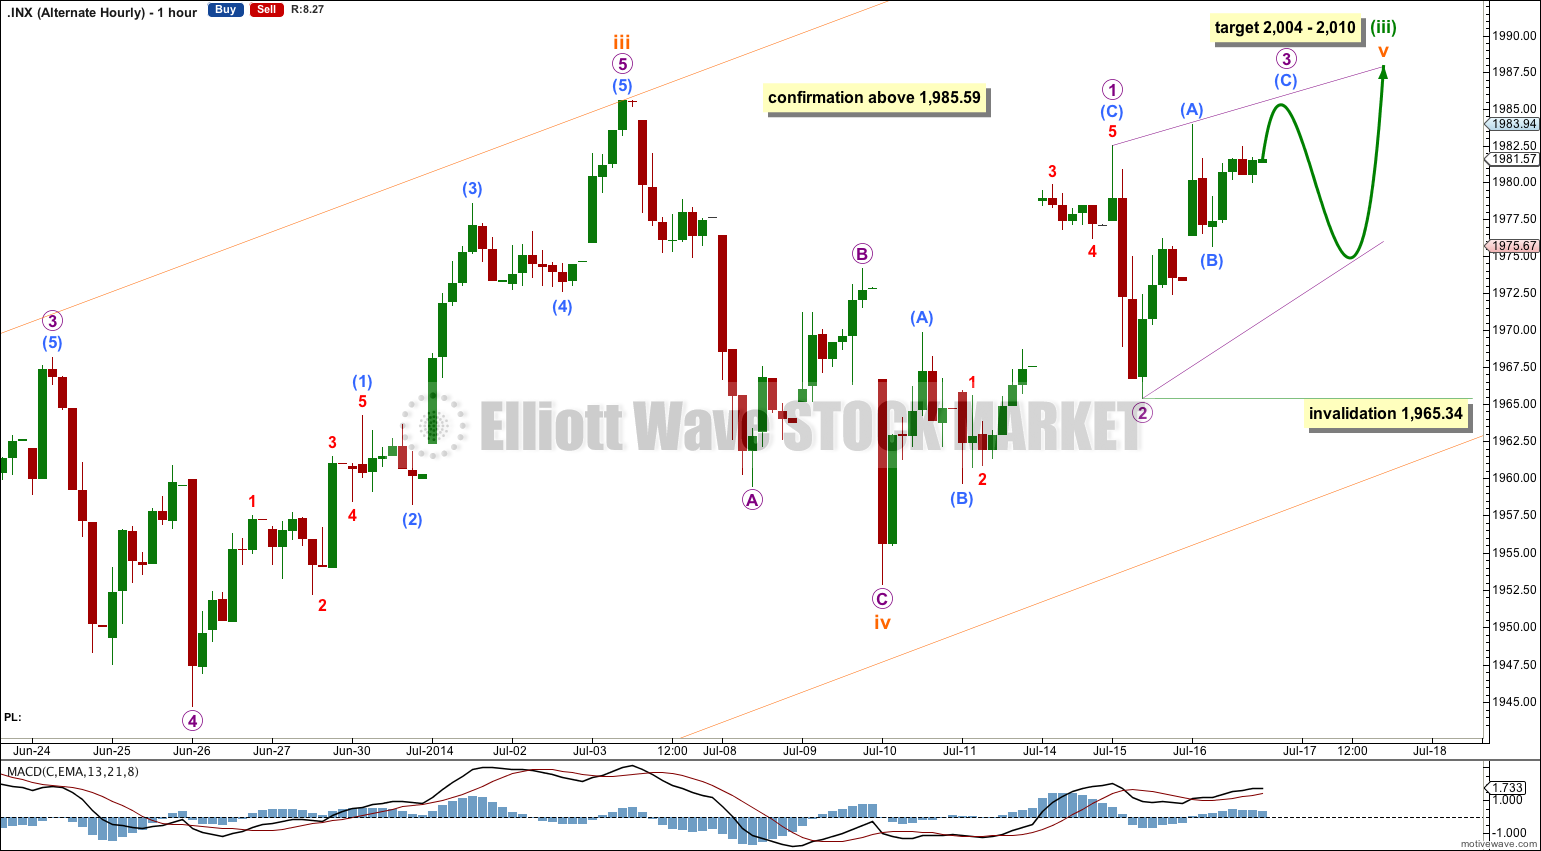
Subminuette wave v may be unfolding as an ending diagonal.
Within an ending diagonal all subwaves may only subdivide as single zigzags.
When micro wave 3 of the diagonal is a complete zigzag then micro wave 4 must move back down into micro wave 1 price territory. Micro wave 4 may not move below the end of micro wave 2 at 1,965.34.
Bearish Alternate Wave Count.
This bearish alternate wave count expects that the correction is not over. The flat correction which ended at 666.79 was only cycle wave a (or w) of a larger super cycle second wave correction.
The structure and subdivisions within primary wave C for the bear wave count are the same as for intermediate wave (1) for the bull wave count. Thus the short to mid term outlook is identical.
The differentiation between the bull and bear wave count is the maroon – – – channel. The bull wave count should see price remain above the lower maroon – – – trend line. The bear wave count requires a clear breach of this trend line. If this trend line is breached by a full weekly candlestick below it and not touching it then this bear wave count would be my main wave count and I would then calculate downwards targets.
We should always assume the trend remains the same until proven otherwise; the trend is your friend. While price remains above the lower maroon – – – trend line I will assume that the S&P 500 remains within a bull market.
This analysis is published about 09:54 p.m. EST.