
A new high invalidated the hourly wave counts. I have a new alternate for you. I still expect the main wave count has a higher probability.
Summary: Although we saw a new high this could still be a part of a small correction. I expect this to most likely complete with a few days downwards movement to a target at 1,924. I have an alternate which expects a continuation of upwards movement, and it would be confirmed with movement above 1,991.65.
Click on charts to enlarge.
The aqua blue trend lines are critical. Draw the first trend line from the low of 1,158.66 on 25th November, 2011 to the next swing low at 1,266.74 on 4th June, 2012. Create a parallel copy and place it on the low at 1,560.33 on 24th June, 2013. While price remains above the lower of these two aqua blue trend lines we must assume the trend remains upwards. This is the main reason for the bullish wave count being my main wave count.
Bullish Wave Count.

The bull wave count expects a cycle wave IV was over at the end of the credit crunch and a new bull market for cycle wave V began there.
The maroon channel is a base channel about primary waves 1 and 2. That primary wave 3 began two years and eight months ago and still has not broken above this channel, as it should, gives some cause for concern with this wave count. That is why I still follow the bearish wave count idea.
At 2,917 primary wave 3 would reach 2.618 the length of primary wave 1. It must break above the upper edge of the base channel for this wave count to have the right look.
I have noticed an interesting relationship with RSI and big trend changes over the last few years for the S&P. Prior to each major high RSI had moved above 70. Prior to each major low RSI had moved below 30. At each major high RSI moved above 70 more than a year before the high was reached, and it showed divergence with price.
RSI moved above 70 back in February 2013, more than a year ago, but RSI has not yet shown divergence, and has not made a last final failure swing. If it follows that these two things happen then I would consider that strong indication that the bear waved count may be correct.
October and March seem to be common months for major turning points in the S&P over the last several years. I will look to this October as a possible high. It may be that intermediate wave (1) ends there.
There are a couple of things about this wave count of which I am confident. I see minor wave 3 within intermediate wave (1) as over at 1,729.86 (19th September, 2013). It has the strongest upwards momentum and is just 0.76 longer than 2.618 the length of minor wave 1. At 455 days duration this is a remarkably close Fibonacci ratio. The subdivisions within it are perfect. If this is correct then minor wave 4 ends at 1,646.47 and this is where minor wave 5 begins.
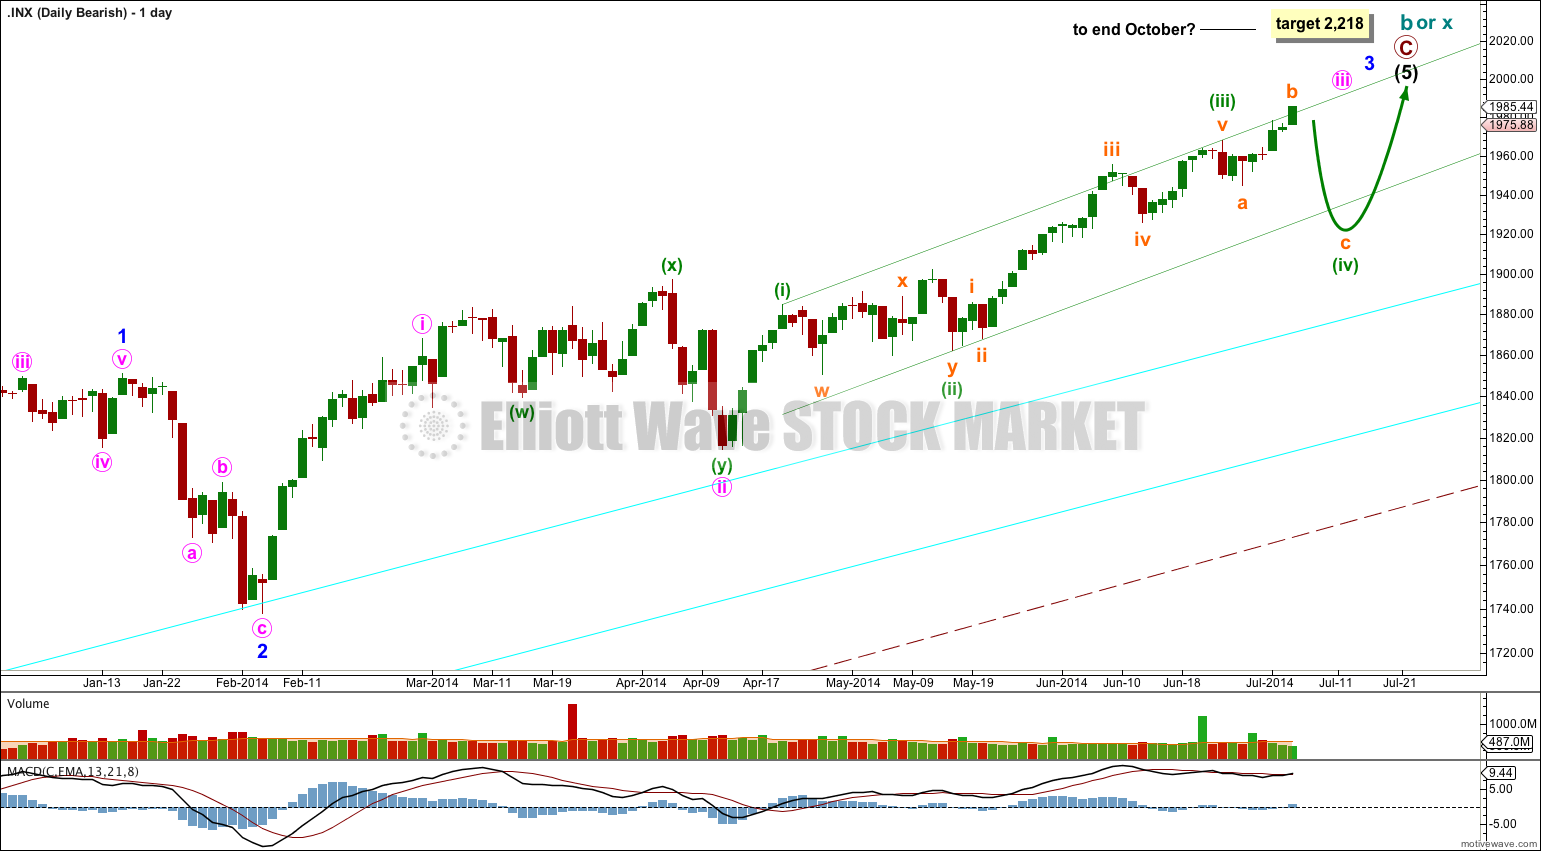
Minor wave 5 may be only one of two structures: a simple impulse or an ending diagonal. At this stage an ending diagonal looks less likely, and current upwards movement is looking like a third wave so a more common impulse is more likely.
Along the way up towards the final target I would expect to see three more corrections complete. The first for subminuette wave iv is most likely to be somewhat in proportion to subminuette wave ii which lasted 17 days. So far subminuette wave iv has lasted only seven days and is very likely to continue.
Subminuette wave iii is 8.31 points short of 1.618 the length of subminuette wave i.
Ratios within subminuette wave iii are: micro wave 3 has no Fibonacci ratio to micro wave 1, and micro wave 5 is 4.14 points longer than 1.618 the length of micro wave 1.
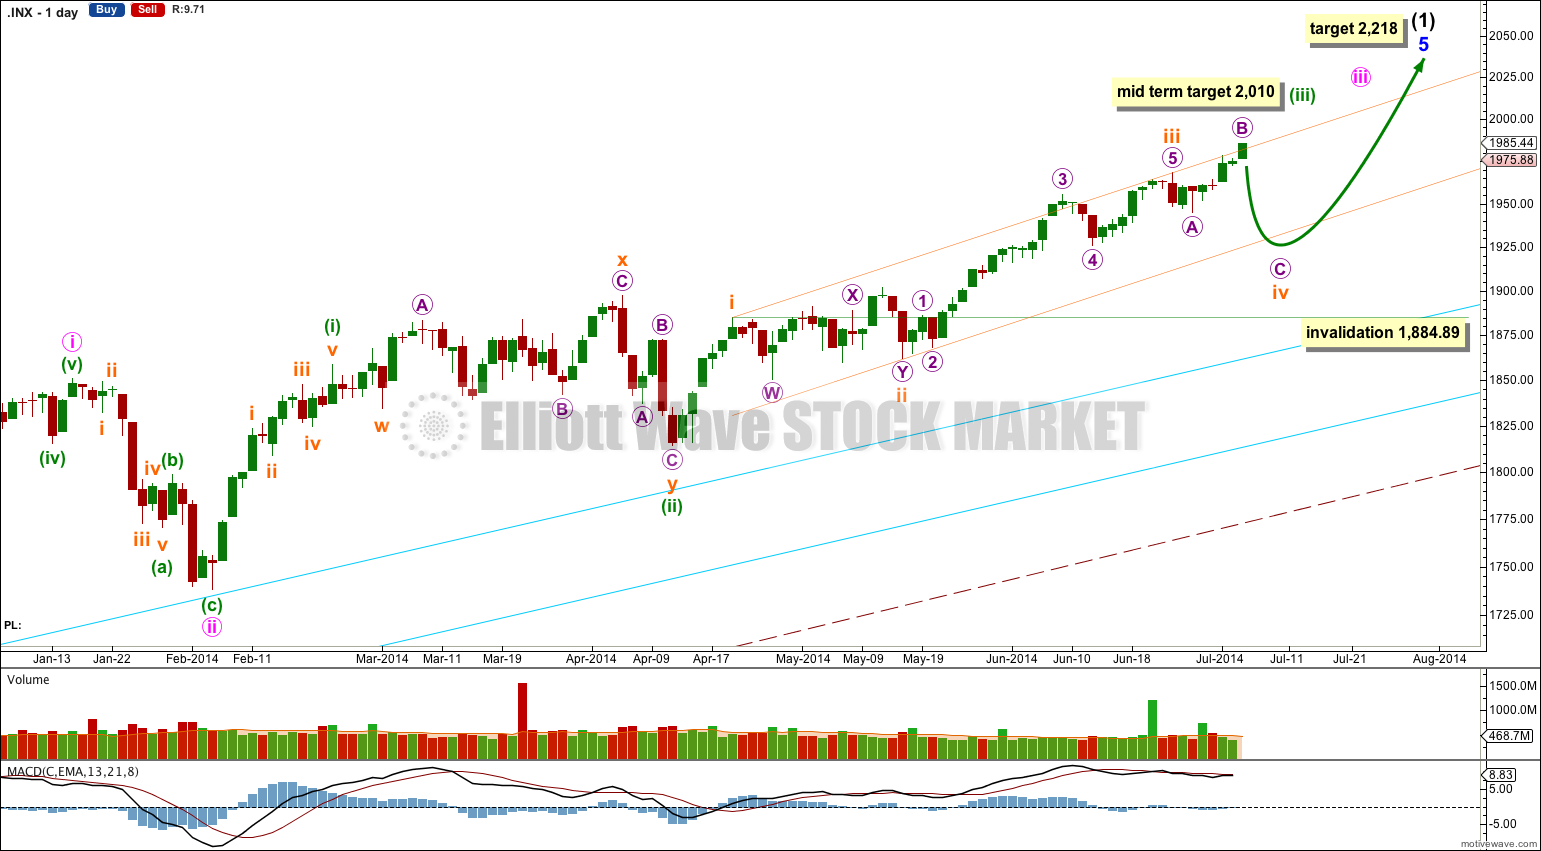
Subminuette wave iv may not move into subminuette wave i price territory below 1,884.89.
At 2,010 minuette wave (iii) would reach 1.618 the length of minuette wave (i).
At 2,218 minor wave 5 would reach equality in length with minor wave 3.
I have drawn a parallel channel about minuette wave (iii) using Elliott’s first technique: draw the first trend line from the highs of subminuette waves i to iii, then place a parallel copy on the low of subminuette wave ii. The upper edge of this channel is slightly overshot, and this may indicate an overshoot on the opposite side may happen when subminuette wave iv ends.
There is still divergence with price trending higher and MACD trending lower on the weekly chart, and a little on the daily chart for most recent movement. This classic technical divergence supports indicates that a correction should unfold.
The large maroon – – – channel is copied over from the weekly chart. It is drawn in exactly the same way on bull and bear wave counts. For the bull wave count this channel is termed a base channel about primary waves 1 and 2. A lower degree second wave should not breach the lower edge of a base channel drawn about a first and second wave one or more degrees higher. The lower maroon – – – trend line differentiates the bull and bear wave counts.
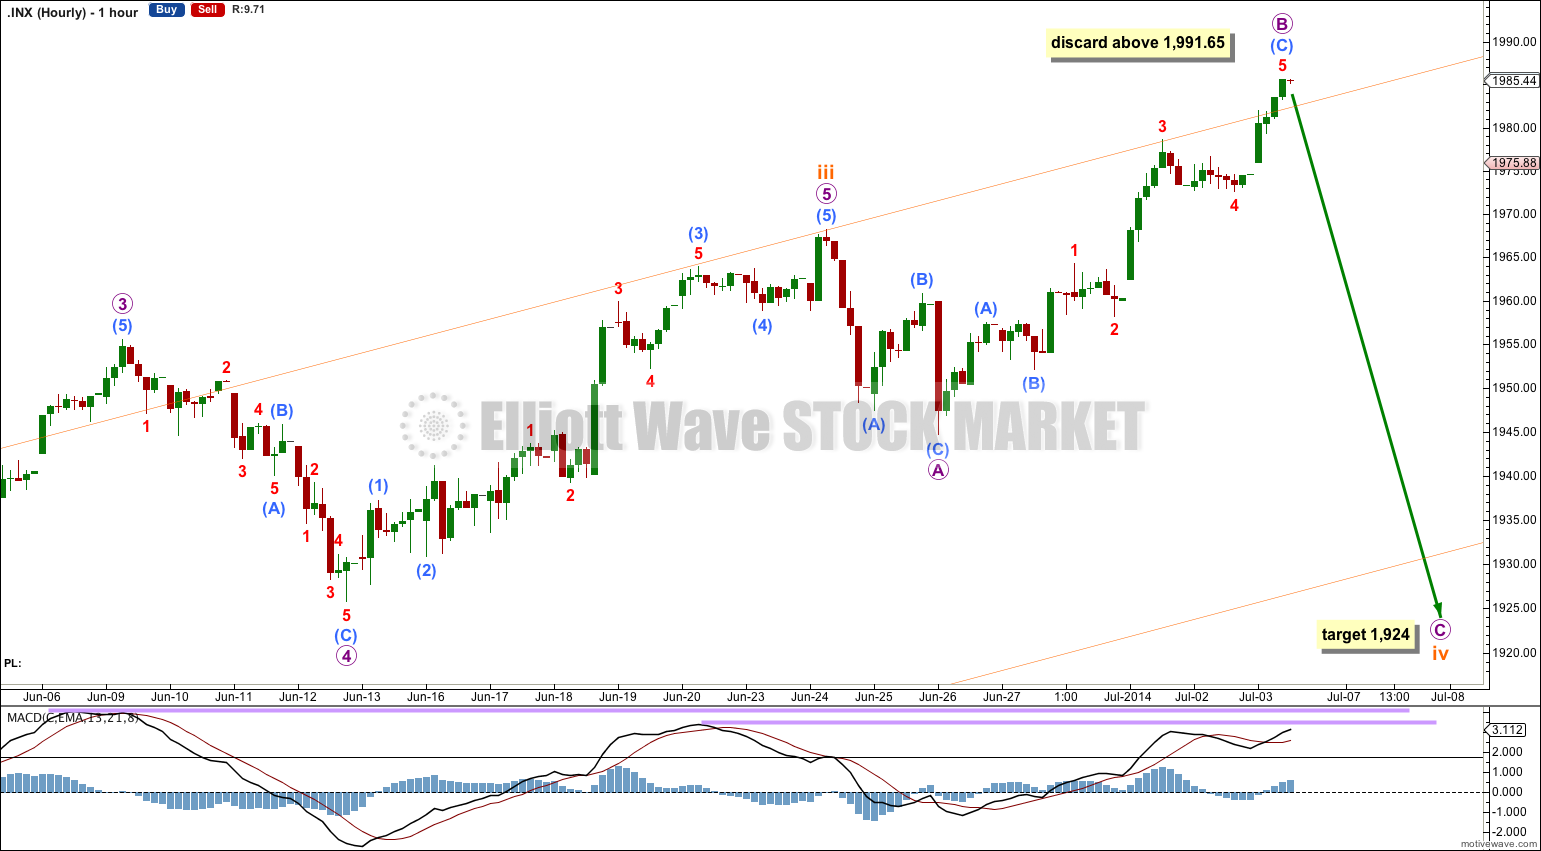
The expanded flat correction for subminuette wave iv remains valid. Only when micro wave B reaches twice the length of micro wave A at 1,991.65 would I discard this wave count. At that stage it would still be technically valid (there is no maximum length for a B wave within a flat correction) but the probability would be so low it should be discarded.
Micro wave B is so far 174% the length of micro wave A, more than the common length of 138% but still valid.
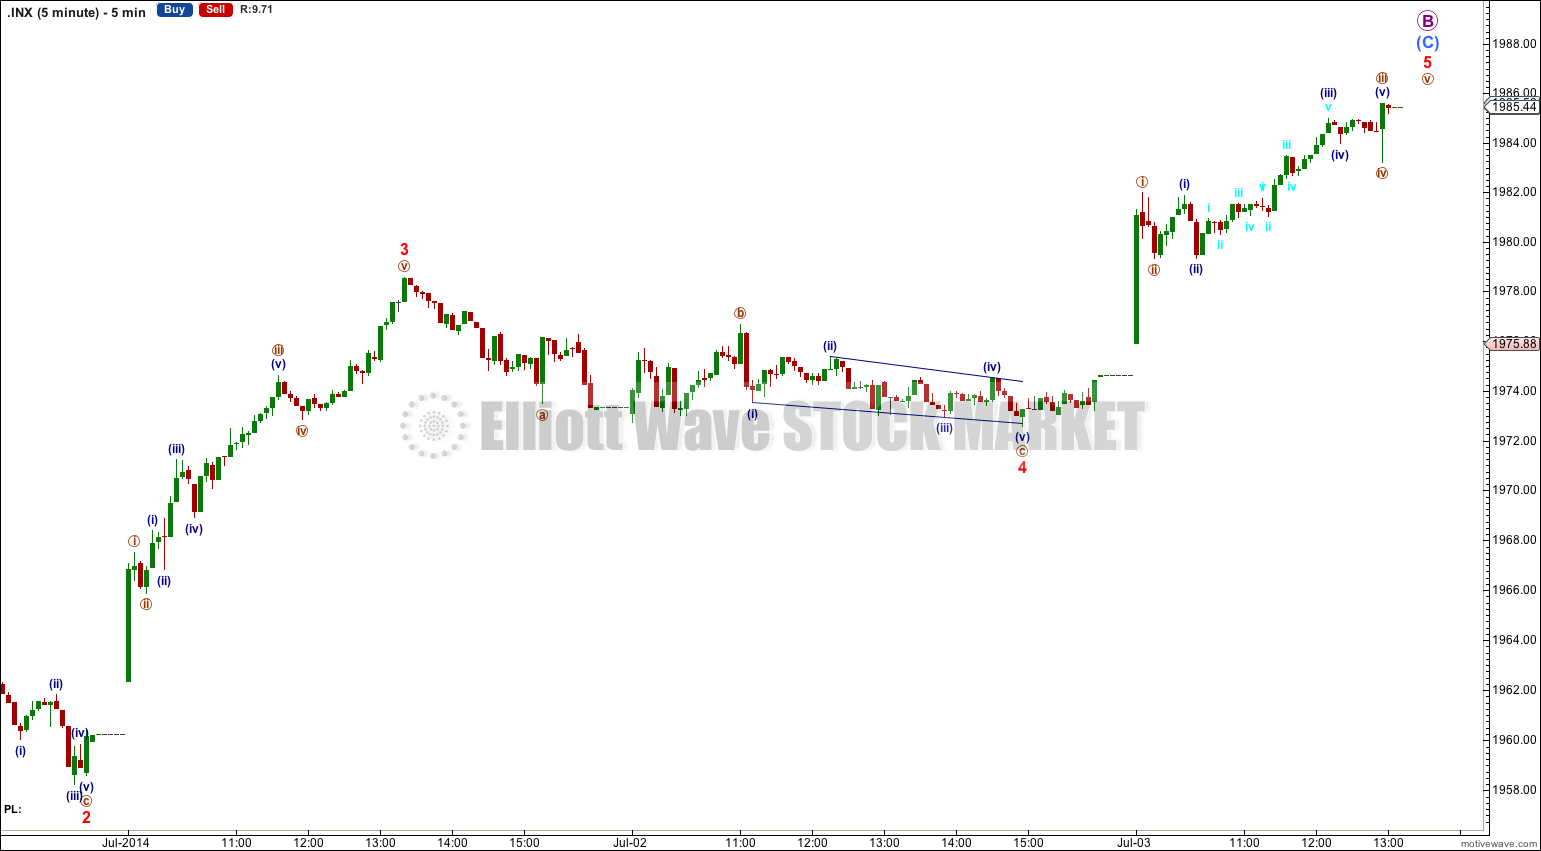
Within micro wave B submicro wave (B) is just 0.15 short of 2.618 the length of submicro wave (A).
Ratios within submicro wave (C) are: minuscule wave 3 is 0.85 points longer than 1.618 the length of minuscule wave 1, and minuscule wave 5 is 0.95 longer than equality with minuscule wave 1.
The overshoot of the upper edge of the channel may indicate an overshoot of the lower edge to come.
At 1,924 micro wave C would reach 2.618 the length of micro wave A.
Alternate Bullish Wave Count.
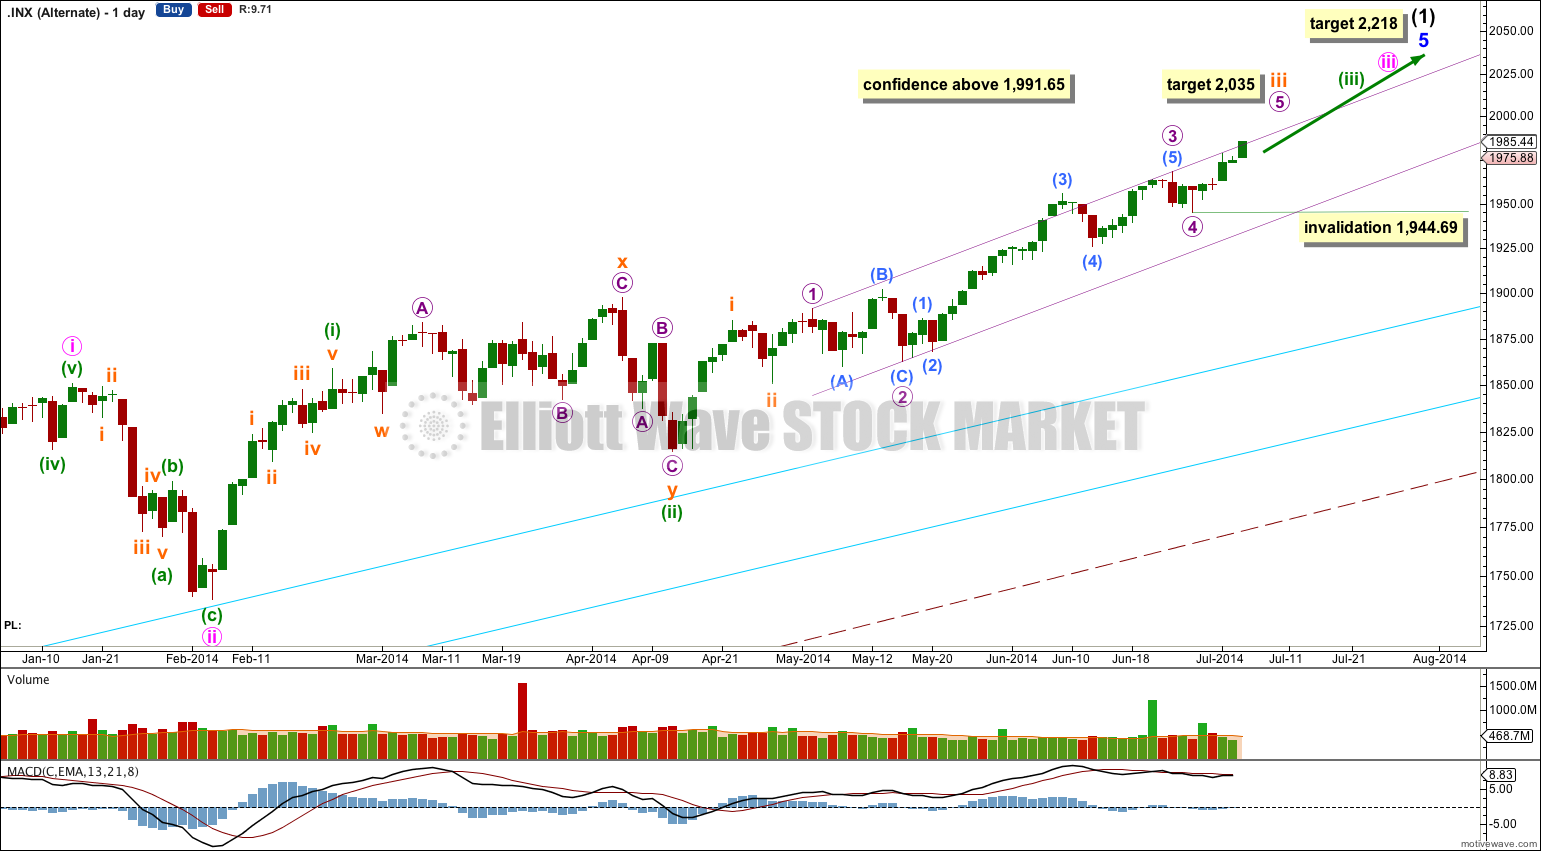
I will continue to consider all possibilities. The invalidation of yesterday’s hourly wave count makes me consider the possibility that subminuette wave iv has not yet arrived.
If subminuette wave ii ended more quickly as a small zigzag then subminuette wave iii may be in its final fifth wave upwards, and instead of A-B-C as on the hourly chart this alternate would see upwards movement for micro wave 5 subdividing so far into 1-2-3. Further upwards movement would be required.
At 2,035 subminuette wave iii would reach 2.618 the length of subminuette wave i.
Within subminuette wave iii micro wave 3 is just 0.79 short of 2.618 the length of micro wave 1.
The reason why this is an alternate is the structure of micro wave 2. It is seen here as a very rare running flat correction. This reduces the probability of this wave count.
Bearish Alternate Wave Count.
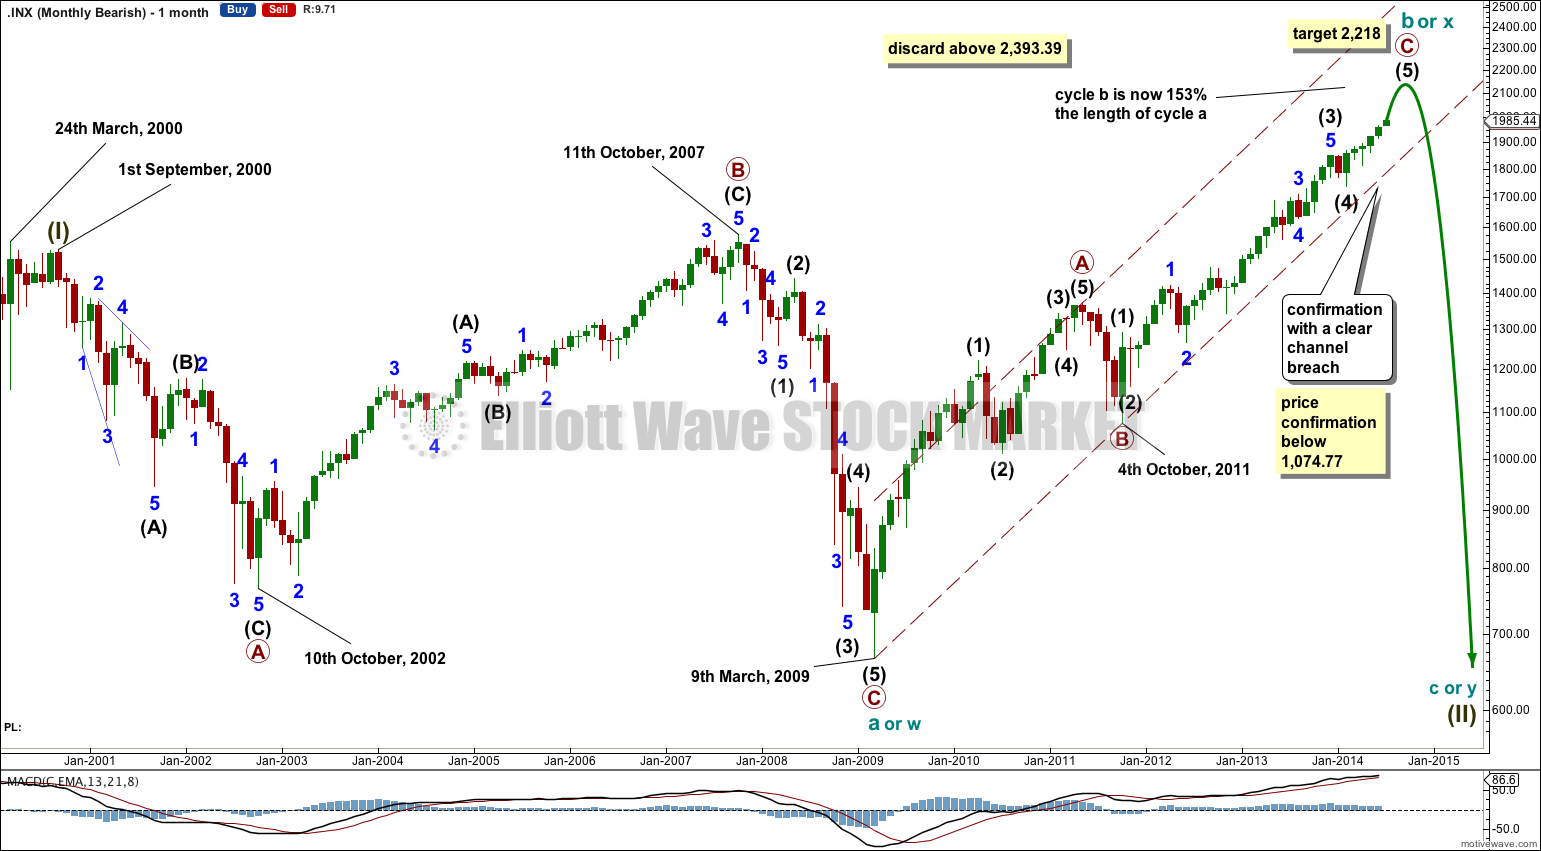
Cycle wave b (or x) is now longer than the maximum common length of 138% the length of cycle wave a. This reduces the probability of this wave count to an alternate. However, that is the only problem I can see at all with this wave count.
Within the zigzag upwards of cycle wave b (or x) primary wave C remains within the corrective channel and sits in the lower half. This fits nicely for this bearish wave count.
If the target at 2,218 is reached then cycle wave b (or x) would be 180% the length of cycle wave a. At 2,393.39 cycle wave b (or x) would be twice the length of cycle wave a (or w) and the probability of this wave count would then be so low it should be discarded.
The maroon channel is here a corrective channel about the upwards zigzag. When this channel is breached by downwards movement that would provide trend channel confirmation that cycle wave b (or x) is over and cycle wave c (or y) has begun.
If RSI begins to show divergence and then makes a failure swing in October this wave count could see a trend change in that month.
This bearish alternate wave count expects that the correction is not over. The flat correction which ended at 666.79 was only cycle wave a (or w) of a larger super cycle second wave correction.
The structure and subdivisions within primary wave C for the bear wave count are the same as for intermediate wave (1) for the bull wave count. Thus the short to mid term outlook is identical.
This analysis is published about 09:06 p.m. EST.