Last analysis of FTSE was invalidated by downwards movement. I had expected to see a long extended fifth wave following a fourth wave barrier triangle, but the fifth wave was very brief and was over already.
Click on charts to enlarge.
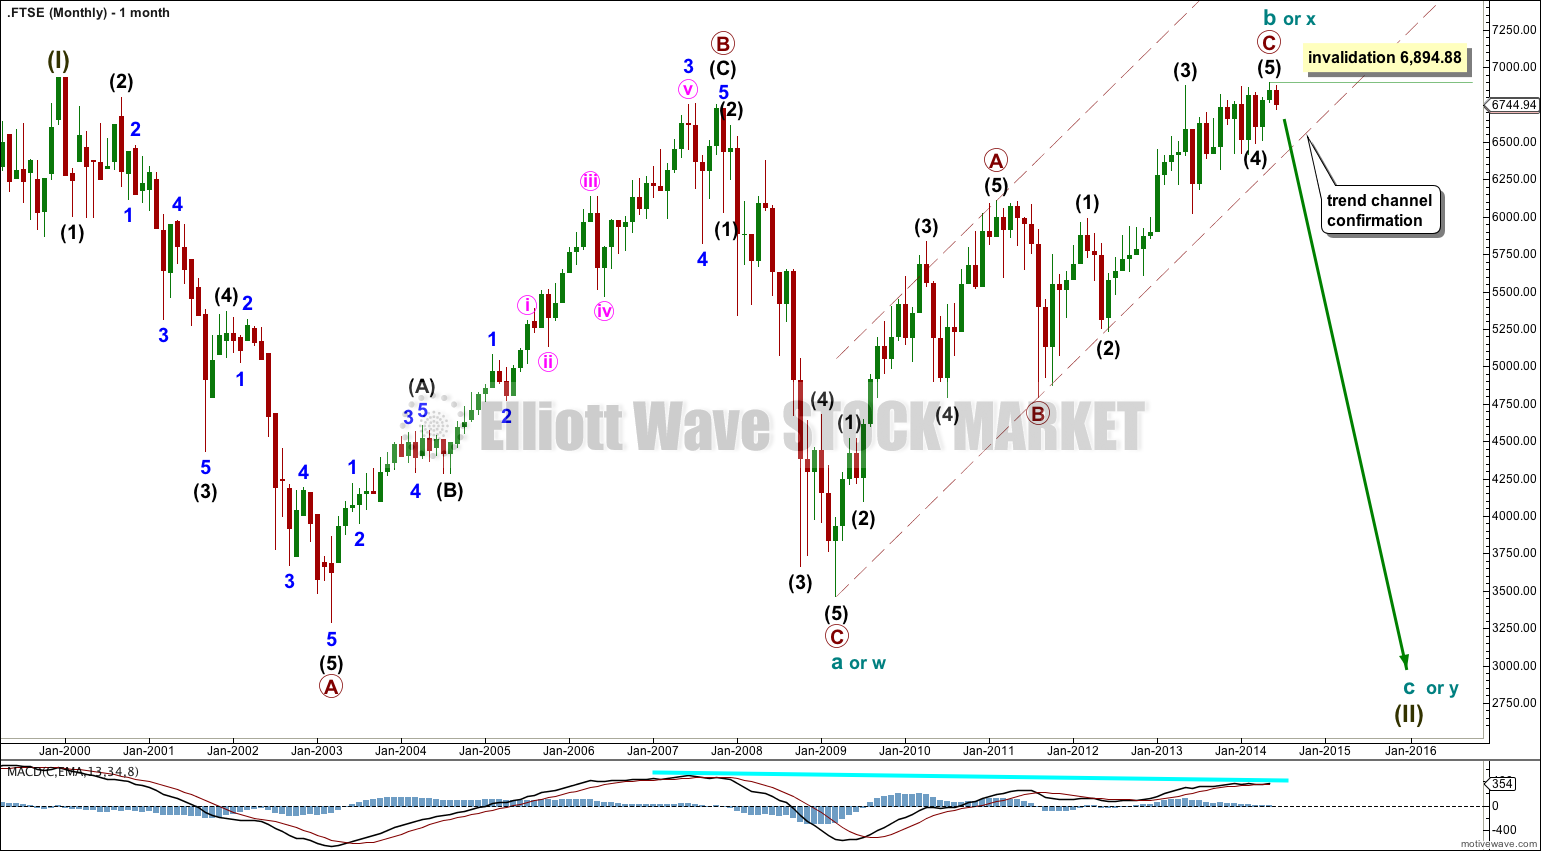
The bigger picture sees FTSE in a huge correction for a super cycle wave (II).
Super cycle wave (II) may be either a regular flat correction (labeled cycle a, b, c) or it may be a double flat or combination (labeled cycle w, x and y).
There is no Fibonacci ratio between primary waves A and C.
A regular flat correction would expect a five wave structure downwards for cycle wave c to move at least a little below the end of cycle wave a at 3,460.71 to avoid a truncation. Cycle wave c would be expected to last from one to several years, with a shorter time frame more likely.
A double flat or combination would expect a three wave structure downwards for cycle wave y to end about the same level as cycle wave a at 3,460.71. Cycle wave y would be expected to last from one to several years, with a longer time frame more likely. It could look like a repeat of cycle wave a.
There is divergence at the monthly chart level with MACD which supports this wave count.
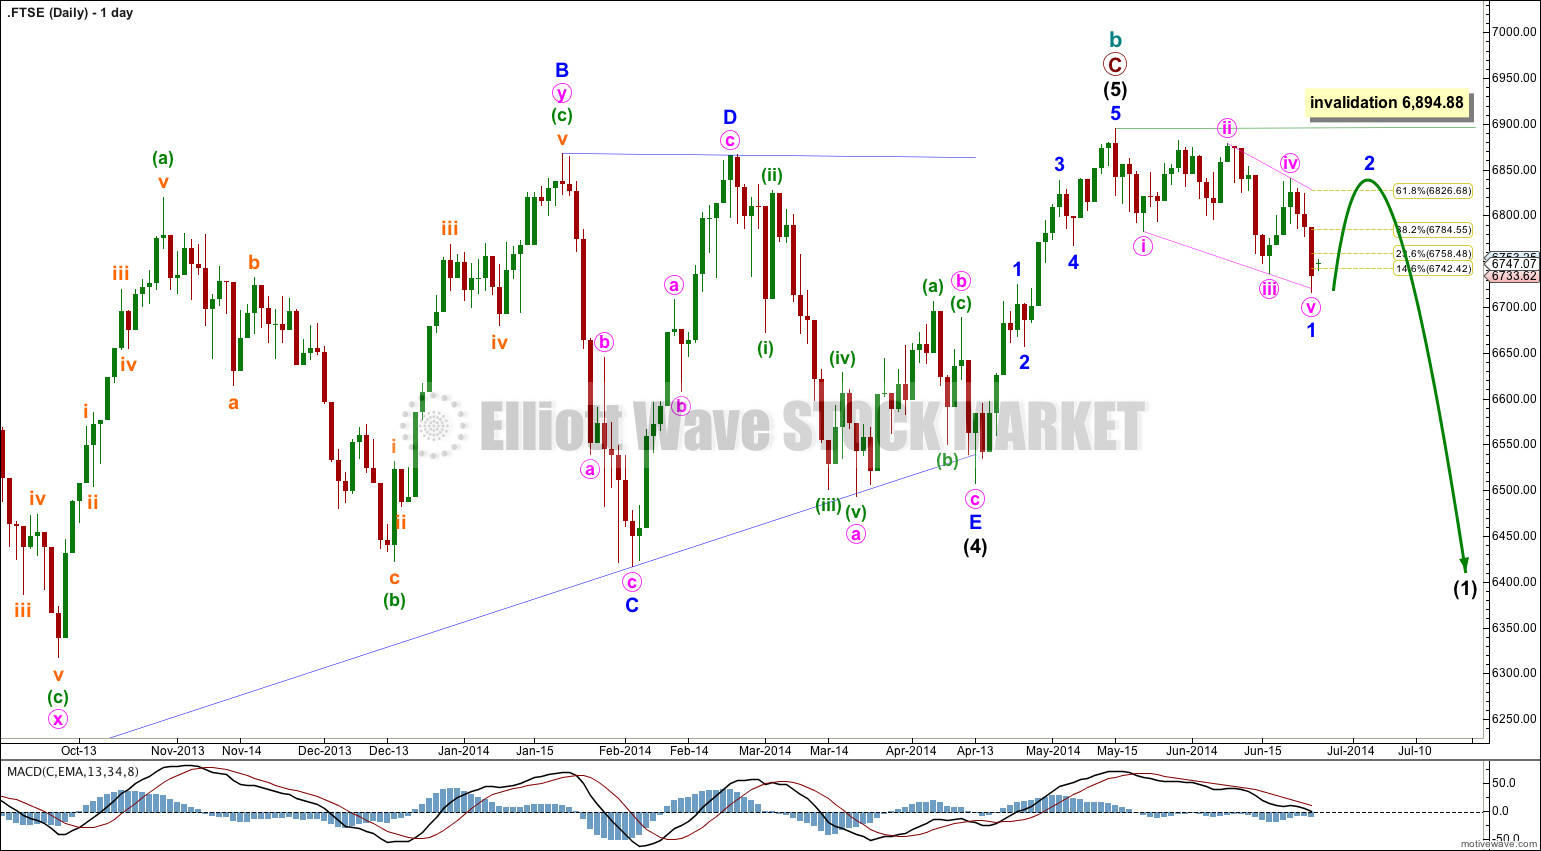
Intermediate wave (5) is most likely to be over as a short sharp wave following the barrier triangle of intermediate wave (4).
Ratios within primary wave C are: there is no Fibonacci ratio between intermediate waves (3) and (1), and intermediate wave (5) is just 0.62 points longer than 0.236 the length of intermediate wave (3).
Downwards movement from the high at 6,894.88 so far looks like it may be a complete leading contracting diagonal. This may be followed by a deep second wave correction to about 6,826.68 or above.
Thereafter, downwards momentum should increase for a third wave.
Movement below 6,507.08 would confirm this wave count.
A clear breach to the downside of the maroon – – – channel on the monthly chart would provide confirmation of this wave count at cycle degree.


