
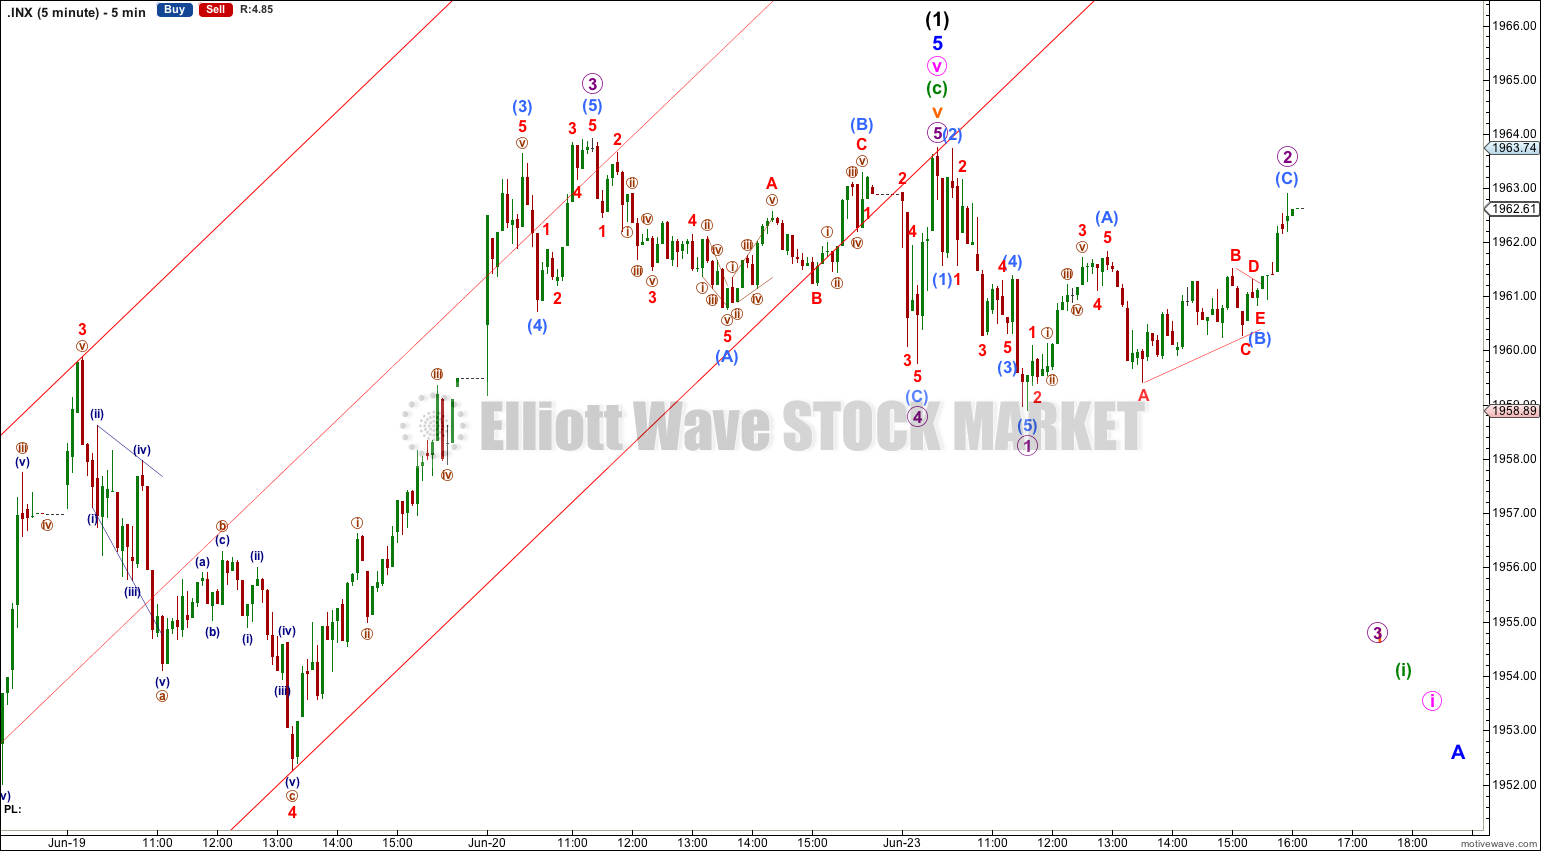
Downwards movement was expected for Monday’s session. Price has moved sideways and slightly lower to complete a very small red doji candlestick. The Elliott wave structures still have a very typical look and the wave count remains the same.
Summary: A new low below 1,925.78 would be first confirmation of a trend change. I am expecting overall downwards movement for about five weeks or a bit longer from this point.
Click on charts to enlarge.
The aqua blue trend lines are critical. Draw the first trend line from the low of 1,158.66 on 25th November, 2011 to the next swing low at 1,266.74 on 4th June, 2012. Create a parallel copy and place it on the low at 1,560.33 on 24th June, 2013. While price remains above the lower of these two aqua blue trend lines we must assume the trend remains upwards. This is the main reason for the bullish wave count being my main wave count.
Bullish Wave Count.
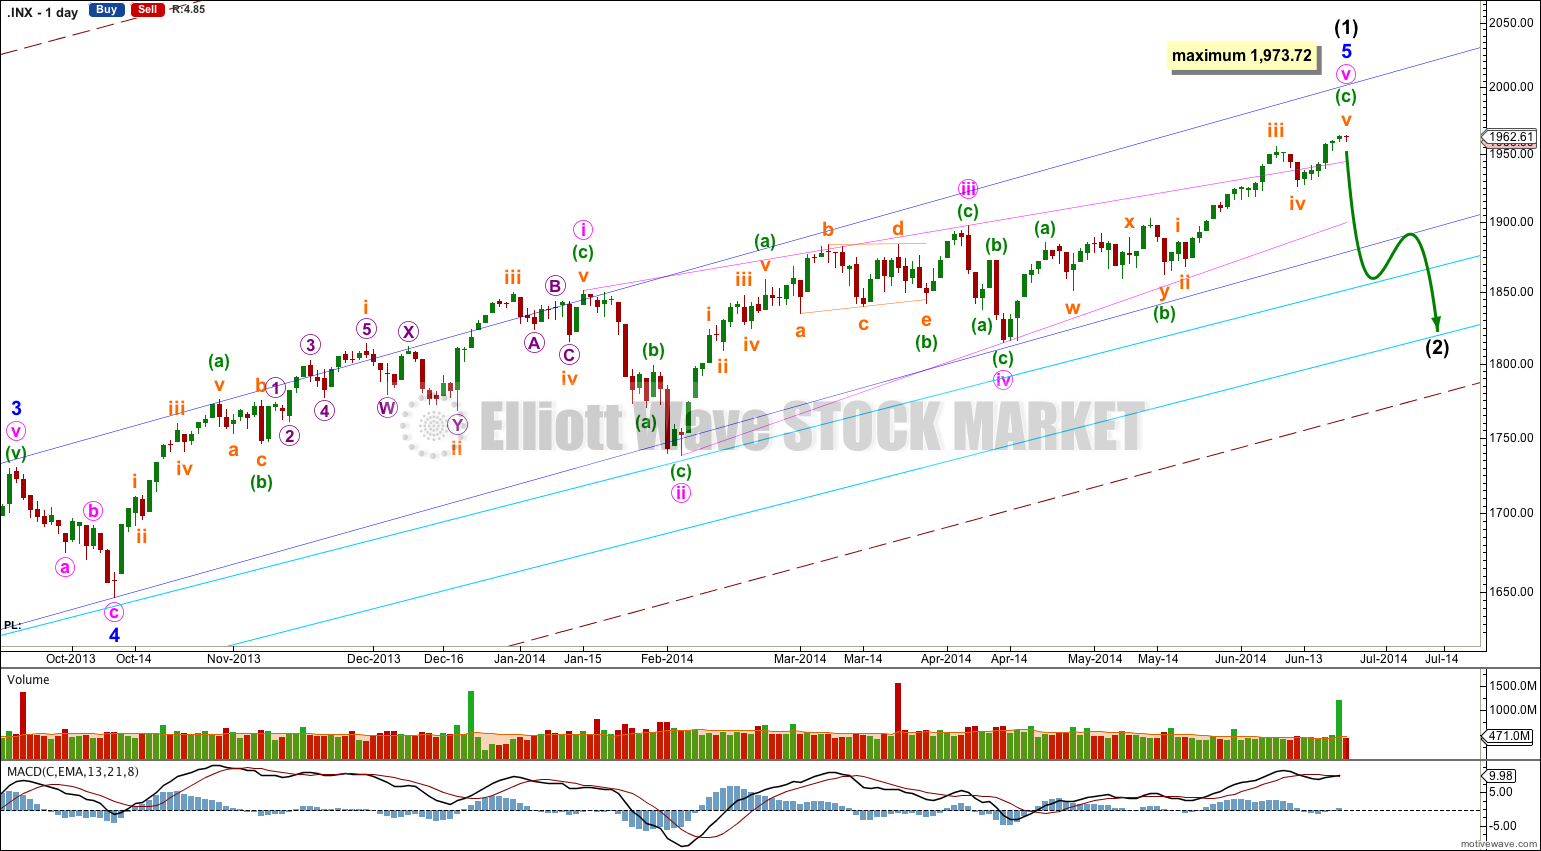
This bullish wave count expects a cycle degree correction was over at 666.79 for a fourth wave, and a new cycle degree bull market began there for a fifth wave. Within cycle wave V primary waves 1 and 2 are complete. Within primary wave 3 intermediate wave (1) may be over here.
Minor wave 5 is a complete ending contracting diagonal. Within an ending diagonal all the subwaves must be single zigzags, and the fourth wave should overlap first wave price territory.
Contracting diagonals commonly end with an overshoot of the 1-3 trend line. Apparently (according to Frost and Prechter, EWP page 38) the overshoot always occurs with a volume spike (I have not noticed this to be so). The S&P 500 reliably has a volume spike on the 20th of each third month, and Friday continued this pattern. Is this the final piece of the puzzle for this structure? It may end here.
But while we have no confirmation of a high in place we must accept the possibility of more upwards movement.
The diagonal is contracting because minute wave iii is shorter than minute wave i. Minute wave v may not be longer than equality with minute wave iii at 1,973.72 because a third wave may never be the shortest wave. So if we see more upwards movement and new highs I do not expect to see movement above 1,973.72 in the mid term.
There is divergence with price trending higher and MACD trending lower on the weekly chart, and now again on the daily chart for most recent movement. This classic technical divergence supports this wave count and indicates that at least a reasonably sized correction should arrive soon. By reasonably sized I mean in fitting with this bullish wave count: Intermediate wave (2) should last at least two weeks, and more likely about five weeks. It should not breach the lower aqua blue trend line nor the lower edge of the maroon – – – channel. The wave count remains bullish at primary degree.
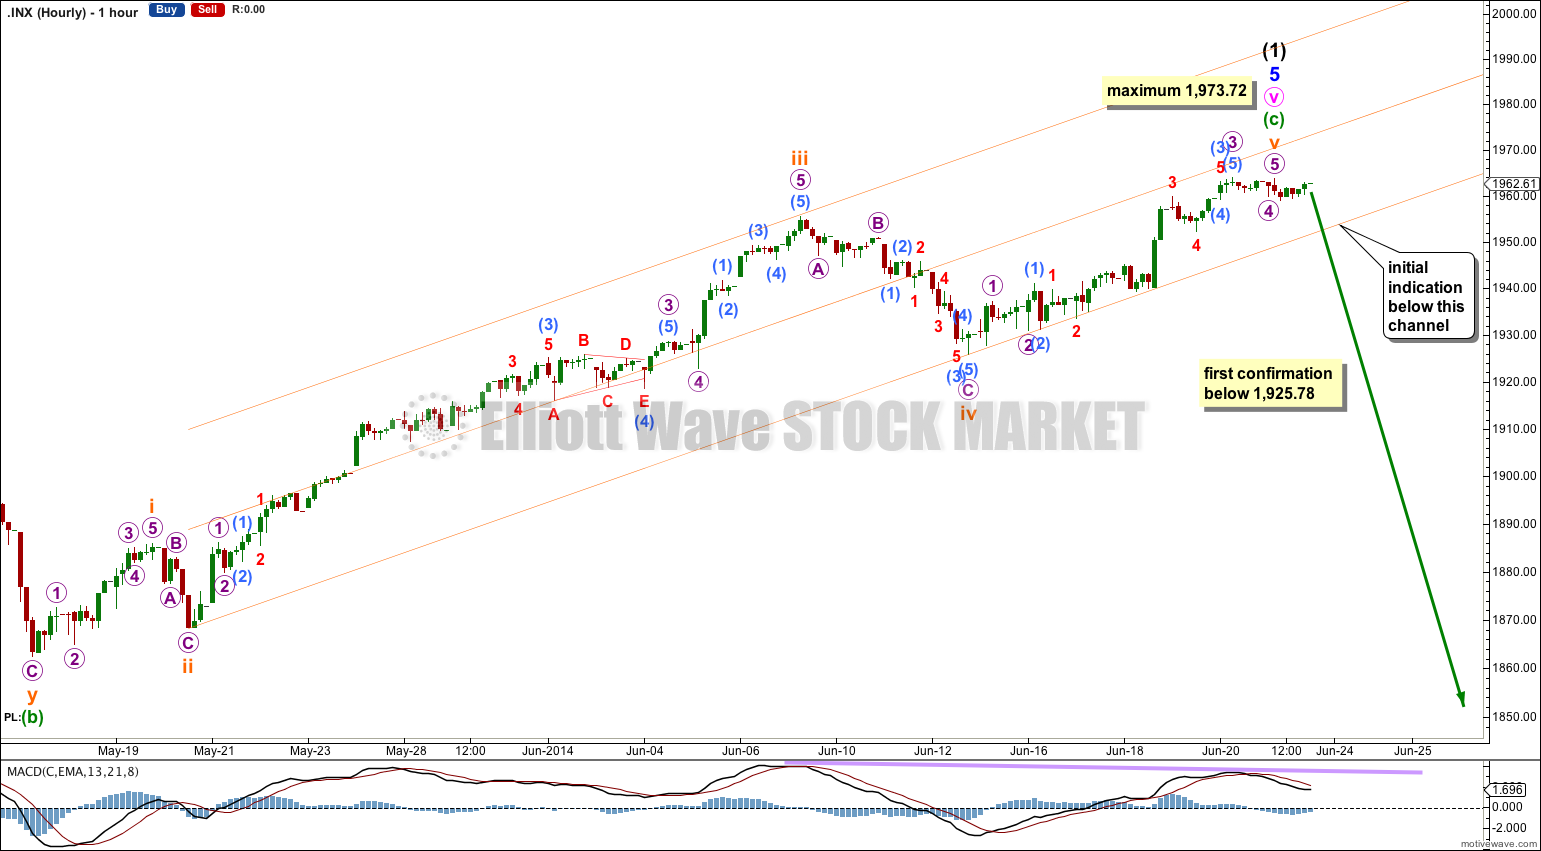
There is no Fibonacci ratio between subminuette waves i and iii. Subminuette wave v is now just 0.29 short of 1.618 the length of subminuette wave i.
I have drawn a channel about minuette wave (c) using Elliott’s second technique: draw the first trend line from the lows of subminuette waves ii to iv, then place a parallel copy upon the high of subminuette wave iii. Subminuette wave v may have ended close to the mid line of this channel. When this channel is clearly breached by at least one full hourly candlestick below it and not touching the lower trend line we shall have first indication of this possible trend change.
Price movement below 1,925.78 will provide me with some confidence in this trend change as at that stage downwards movement cannot be a second wave correction within subminuette wave v, and so subminuette wave v would have to be over.
Finally, a clear five wave structure downwards on the hourly chart would provide further confidence in a trend change.
Intermediate wave (2) should last about five weeks. It may be very choppy and overlapping, or it may be a swift sharp zigzag. It is most likely to end at the lower aqua blue trend line on the daily chart.
If intermediate wave (2) is an expanded flat, or a combination including an expanded flat or running triangle, then it may include a new price extreme beyond its start. At the daily chart level there will be no upper invalidation point for intermediate wave (2) for the bullish wave count.
Bearish Alternate Wave Count.
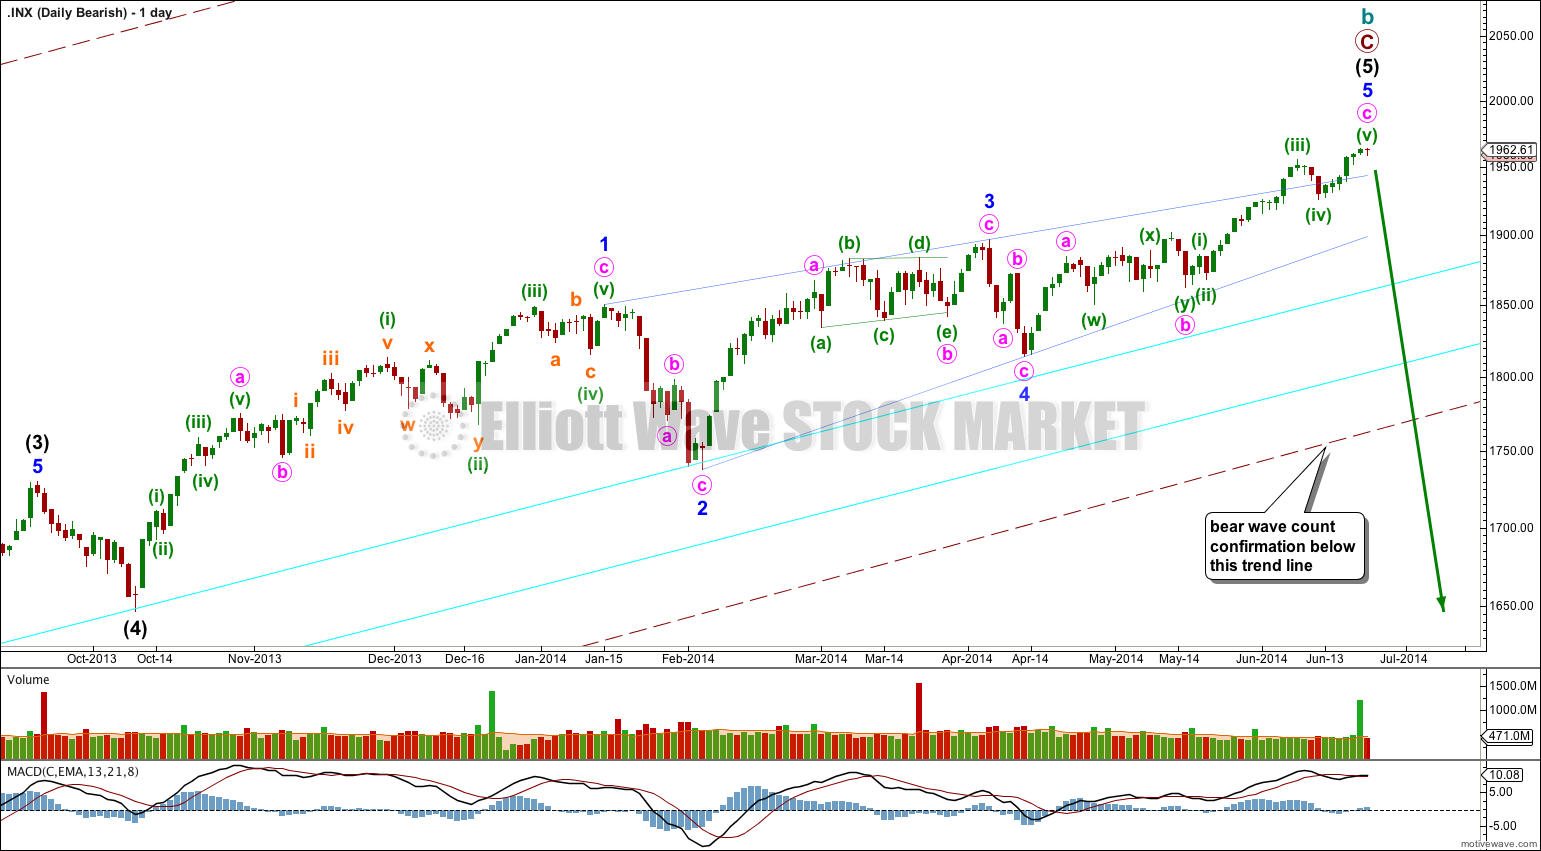
This bearish alternate wave count expects that the correction is not over. The flat correction which ended at 666.79 was only cycle wave a of a larger super cycle second wave correction.
Cycle wave b is now longer than the maximum common length of 138% for a B wave of a flat correction, at 150%.
A clear breach of the large maroon – – – channel on the monthly and weekly charts is required for confirmation of this wave count. If that happens then this would be my main wave count and would be strongly favoured. Only once this wave count is confirmed will I calculate downwards targets for cycle wave c for you; it would be premature to do that prior to confirmation.
Within cycle wave c no second wave correction may move beyond the start of its first wave. Once a trend change is confirmed then this bearish wave count will have an invalidation point at 1,963.91.
This analysis is published about 07:10 p.m. EST.