
This analysis focuses on the daily chart only. To see the last published analysis of a monthly chart click here.
Click on charts to enlarge.
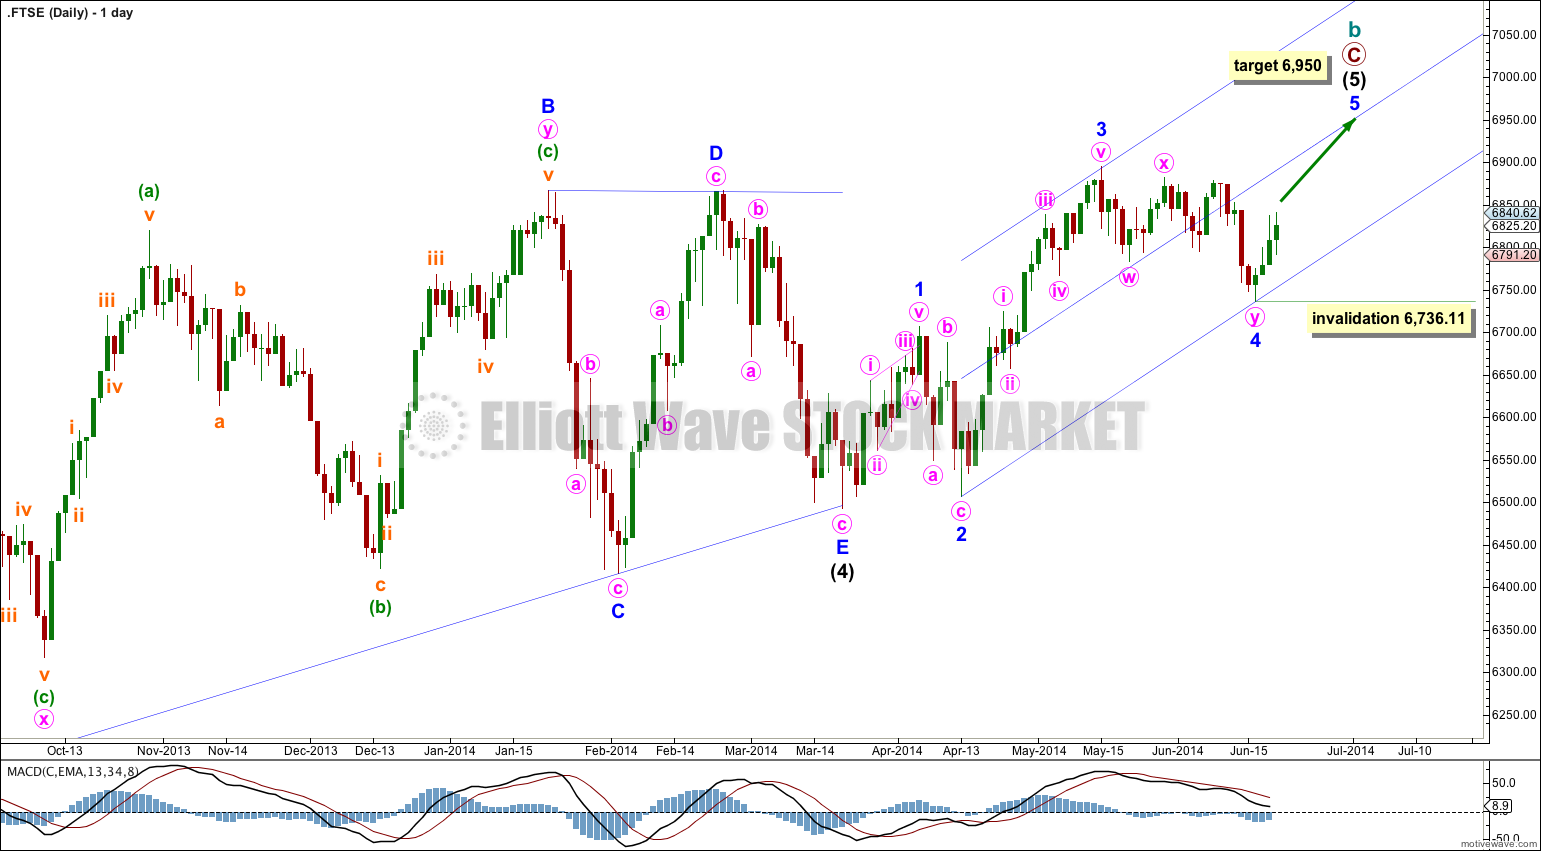
Last analysis expected that minor wave 4 was over at the low labeled here minute wave w within minor wave 4. Clearly with a new low that was not the case. The invalidation point was not breached.
Minor wave 4 continued lower as a double zigzag. It lasted a total of 22 days, compared to minor wave 2 at 8 days. However, although the durations are dissimilar they have an overall look that fits.
There is no Fibonacci ratio between minor waves 3 and 1, so I would expect we may see a Fibonacci ratio for minor wave 5 to either of minor waves 3 or 1. At 6,950 minor wave 5 would reach equality in length with minor wave 1, the most likely ratio for minor wave 5 to exhibit.
I would expect minor wave 5 to most likely reach up to and end about the mid line of the parallel channel.
Draw this channel using Elliott’s second technique: draw the first trend line from the ends of minor waves 2 to 4 then place a parallel copy upon the end of minor wave 3.
Once minor wave 5 can be seen as complete then this channel will provide first indication of an end to upwards movement with a clear breach below it. At that stage subsequent movement below 6,736.11 would provide price confirmation of a trend change.
At this stage within minor wave 5 no second wave correction may move beyond its start below 6,736.11. However, I would expect corrections along the way up to find support at the lower edge of the channel.
Minor wave 1 lasted 11 days so I would expect minor wave 5 to be about the same duration. So far it has lasted only three days.