
Last Elliott wave analysis had expected downwards movement for Monday’s session. This is not what happened and price moved higher. Upwards movement fell short of the invalidation point and so the wave count remains valid.
Summary: In the short term I expect more downwards movement towards a target at 1,912.
Click on charts to enlarge.
The aqua blue trend lines are critical. Draw the first trend line from the low of 1,158.66 on 25th November, 2011 to the next swing low at 1,266.74 on 4th June, 2012. Create a parallel copy and place it on the low at 1,560.33 on 24th June, 2013. While price remains above the lower of these two aqua blue trend lines we must assume the trend remains upwards. This is the main reason for the bullish wave count being my main wave count.
Bullish Wave Count.
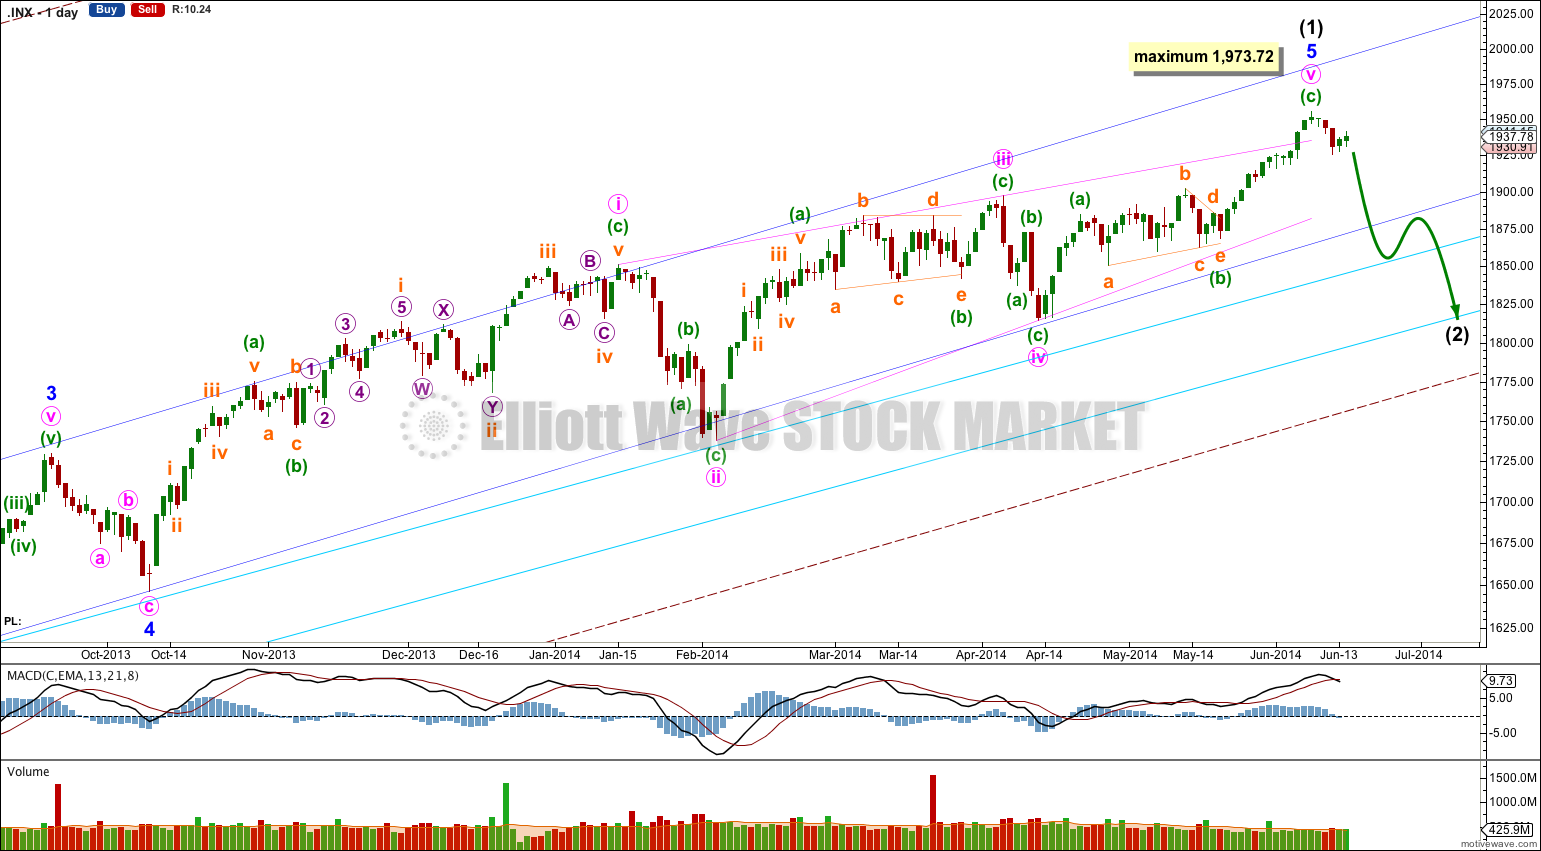
This bullish wave count expects a cycle degree correction was over at 666.79 for a fourth wave, and a new cycle degree bull market began there for a fifth wave. Within cycle wave V primary waves 1 and 2 are complete. Within primary wave 3 intermediate wave (1) may be just now complete.
Minor wave 5 is a complete ending contracting diagonal. Within an ending diagonal all the subwaves must be single zigzags, and the fourth wave should overlap first wave price territory.
The final fifth wave of this diagonal may have ended with an overshoot the upper i-iii trend line of the contracting diagonal. This is the most common place for fifth waves of ending contracting diagonals to end. This gives the wave count a very typical look, if it is over here.
The diagonal is contracting because minute wave iii is shorter than minute wave i. Minute wave v may not be longer than equality with minute wave iii at 1,973.72 because a third wave may never be the shortest wave. At this stage it is not confirmed that the final fifth wave of the diagonal is over.
There is still divergence with price trending higher and MACD trending lower. This classic technical divergence supports this wave count and indicates that at least a reasonably sized correction should arrive soon. By reasonably sized I mean in fitting with this bullish wave count: Intermediate wave (2) should last at least two or four weeks, probably longer, and should not breach the lower aqua blue trend line nor the lower edge of the maroon – – – channel. The wave count remains bullish at primary degree.
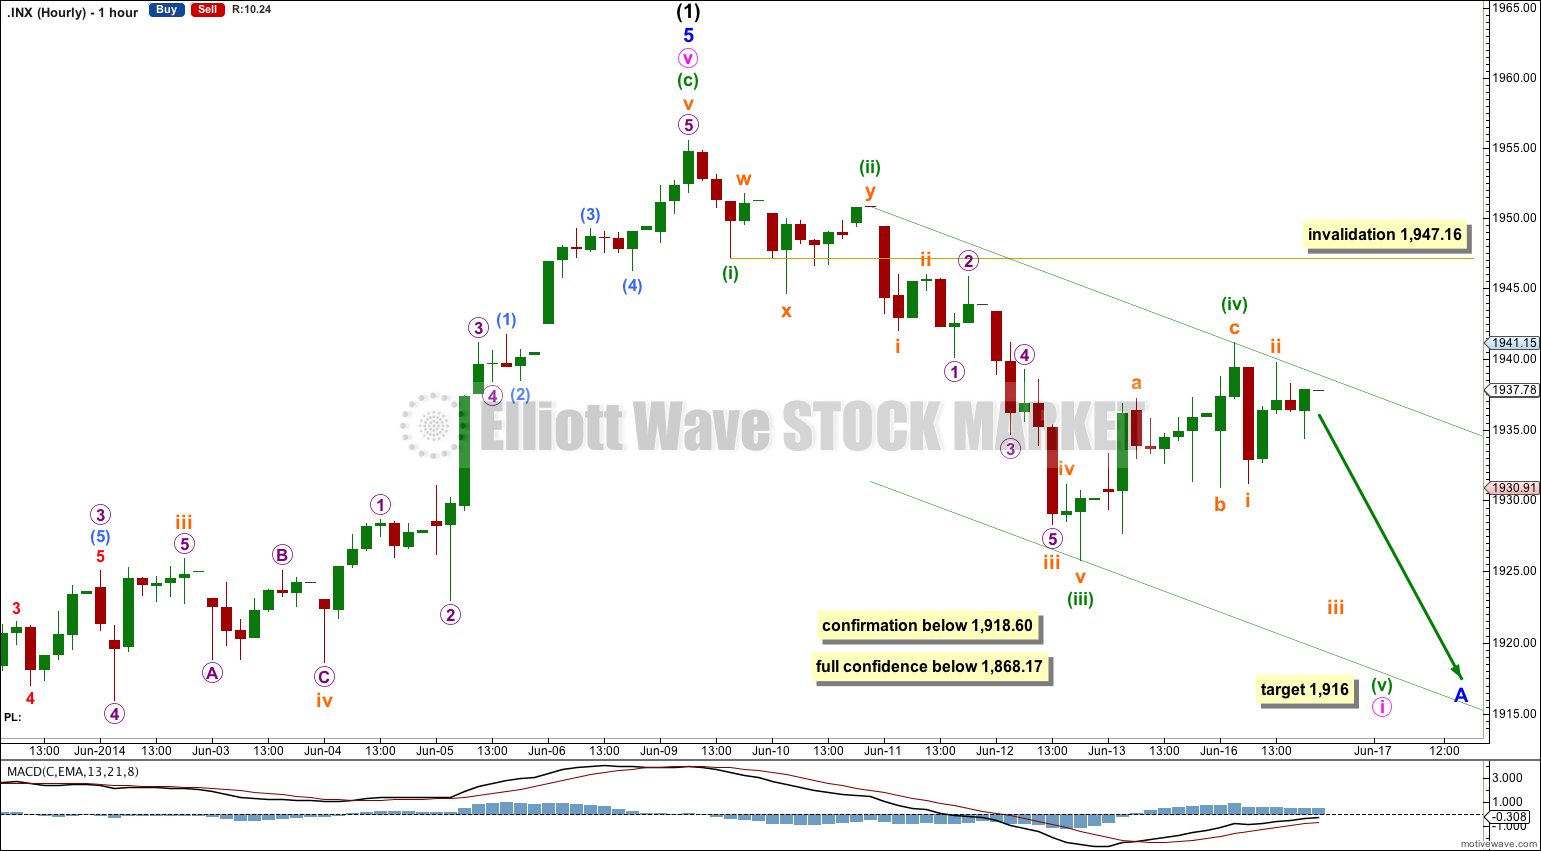
Upwards movement again is still most likely a fourth wave correction, but the degree of labeling was probably wrong. It is probably a higher degree because it shows on the daily chart as two green candlesticks.
Minuette wave (iv) shows alternation with minuette wave (ii): minuette wave (ii) was a shallow multiple while minuette wave (iv) is a deeper zigzag.
Minuette wave (ii) lasted 10 hours and minuette wave (iv) may have lasted 11 hours.
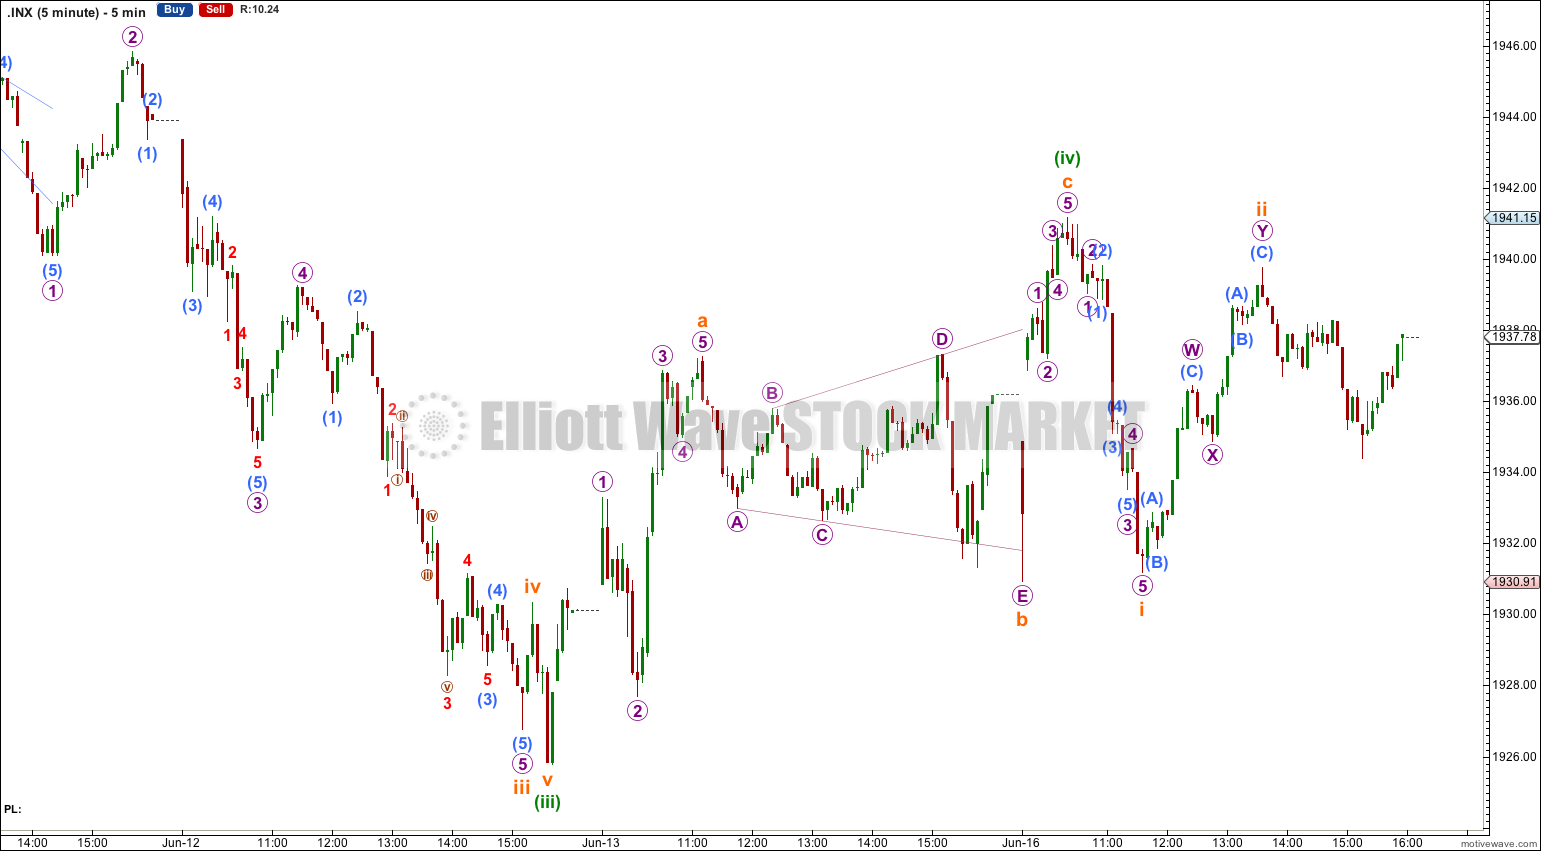
I am seeing minuette wave (ii) here as a double zigzag, but it is a very atypical double zigzag in that the second zigzag does not achieve the purpose of deepening the correction. It may also be a running flat. Either way, this is an atypical correction at the five minute chart level, but at the hourly chart level it has overall the right look because the proportions are good.
There is no Fibonacci ratio between minuette waves (i) and (iii). I would expect to see a Fibonacci ratio between minuette wave (v) and either of (i) or (iii). At 1,916 minuette wave (v) would reach equality in length with minuette wave (iii).
I have drawn a channel about this downwards movement using Elliott’s second technique: draw the first trend line from the ends of minuette waves (ii) to (iv), then place a parallel copy upon the end of minuette wave (iii). I would expect minuette wave (v) to find support at the lower edge of this channel.
If upwards movement continues tomorrow then minuette wave (iv) may not move into minuette wave (i) price territory. This wave count is invalidated with movement above 1,947.16.
Bearish Alternate Wave Count.
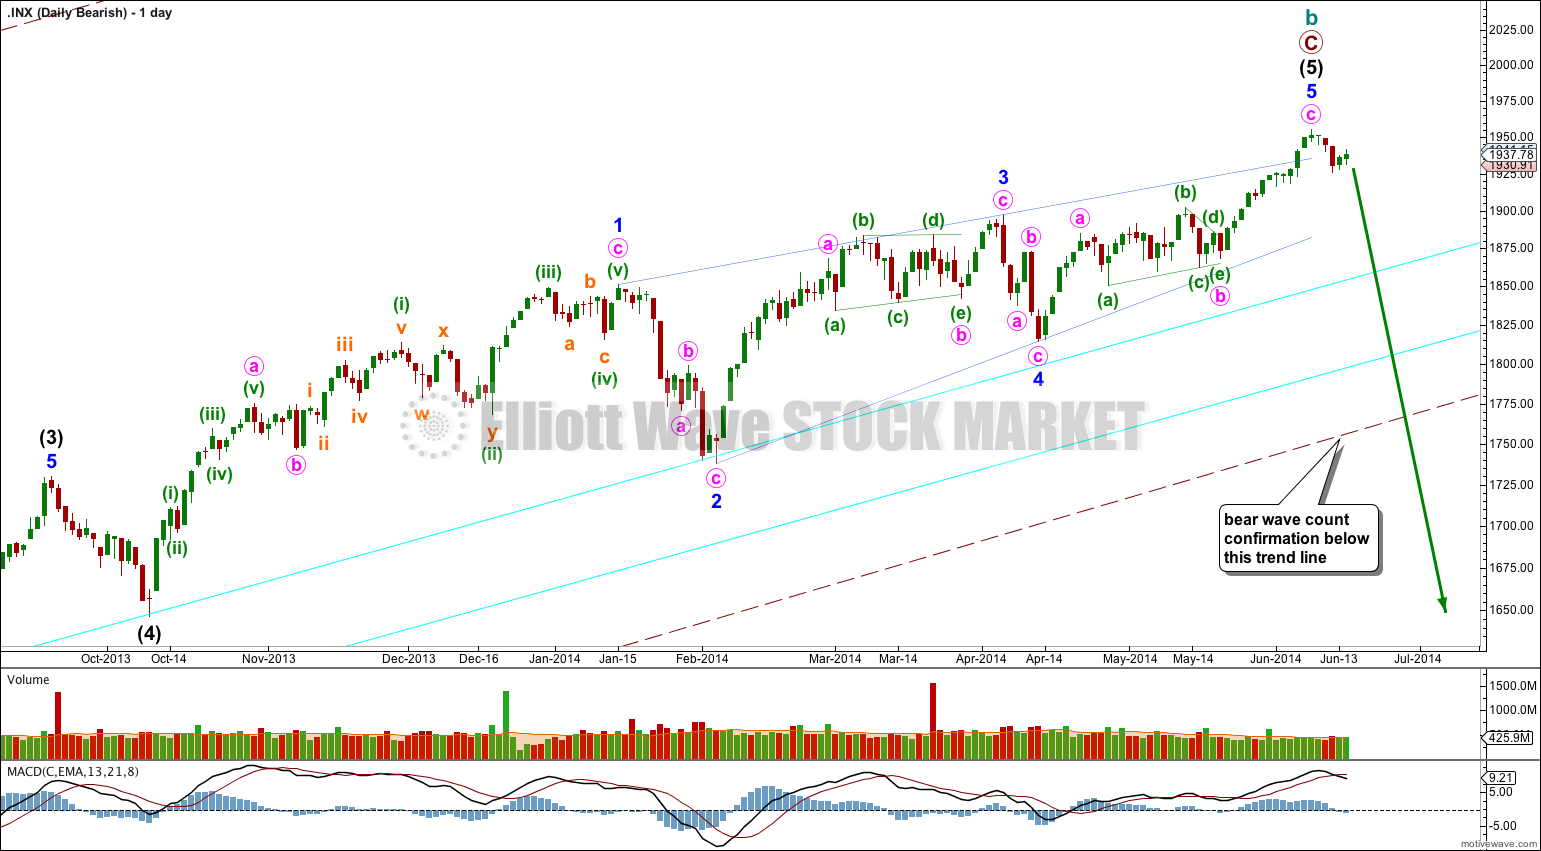
This bearish alternate wave count expects that the correction is not over. The flat correction which ended at 666.79 was only cycle wave a of a larger super cycle second wave correction.
Cycle wave b is now longer than the maximum common length of 138% for a B wave of a flat correction, at 149%.
Cycle wave b may again be a complete zigzag structure.
A clear breach of the large maroon – – – channel on the monthly and weekly charts is required for confirmation of this wave count. If that happens then this would be my main wave count and would be strongly favoured. Only once this wave count is confirmed will I calculate downwards targets for cycle wave c for you; it would be premature to do that prior to confirmation.
This analysis is published about 07:10 p.m. EST.