
Upwards movement from the S&P 500 was expected. The Elliott wave structure may now be complete. The target has been slightly exceeded by 2.74 points.
Summary: The pink trend line of the diagonal is slightly overshot and this has a very typical look. Movement below 1,918.60 would provide initial confirmation of a trend change at intermediate degree. Movement below 1,868.17 would provide full confidence. Once we have confirmation I will be confident in stating that a downwards correction should last several weeks to about two months or so. Prior to confirmation we must accept the possibility of new highs, but not above 1,973.72.
This analysis is published about 06:15 p.m. EST. Click on charts to enlarge.
The aqua blue trend lines are critical. Draw the first trend line from the low of 1,158.66 on 25th November, 2011 to the next swing low at 1,266.74 on 4th June, 2012. Create a parallel copy and place it on the low at 1,560.33 on 24th June, 2013. While price remains above the lower of these two aqua blue trend lines we must assume the trend remains upwards. This is the main reason for the bullish wave count being my main wave count.
Bullish Wave Count.
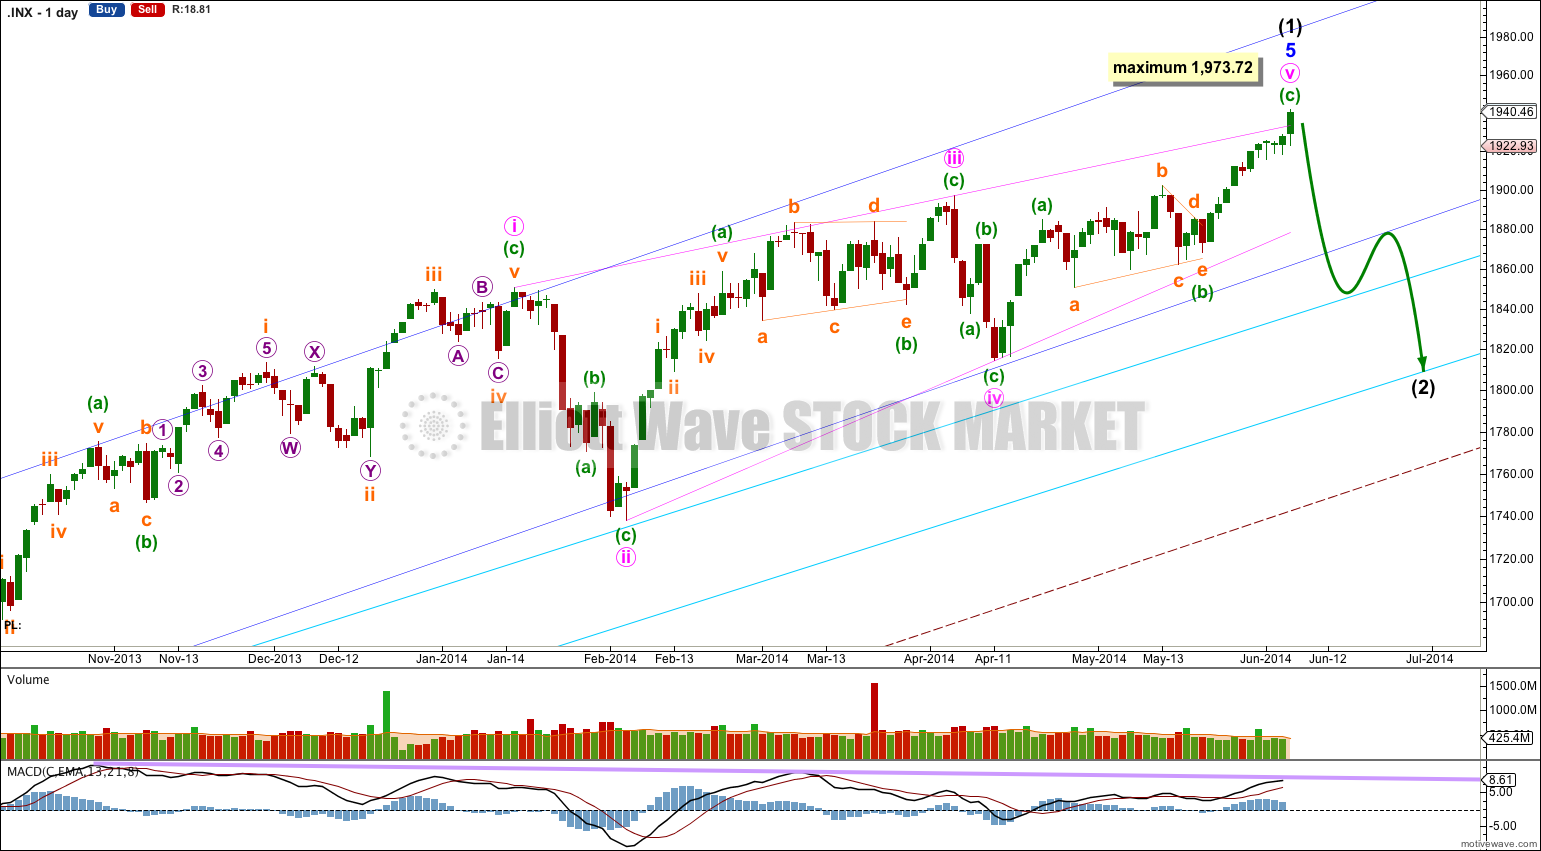
This bullish wave count expects a cycle degree correction was over at 666.79 for a fourth wave, and a new cycle degree bull market began there for a fifth wave. Within cycle wave V primary waves 1 and 2 are complete. Within primary wave 3 intermediate wave (1) may be just now complete.
Minor wave 5 is a complete ending contracting diagonal. Within an ending diagonal all the subwaves must be single zigzags, and the fourth wave should overlap first wave price territory.
The final fifth wave of this diagonal may have just ended with a slight overshoot the upper i-iii trend line of the contracting diagonal. This is the most common place for fifth waves of ending contracting diagonals to end.
The diagonal is contracting because minute wave iii is shorter than minute wave i. Minute wave v may not be longer than equality with minute wave iii at 1,973.72 because a third wave may never be the shortest wave. At this stage it is not confirmed that the final fifth wave of the diagonal is over. Prior to confirmation we must accept the possibility of new highs.
There is still divergence with price trending higher and MACD trending lower. This classic technical divergence supports this wave count and indicates that at least a reasonably sized correction should arrive soon, and may have arrived at the end of Thursday’s session.
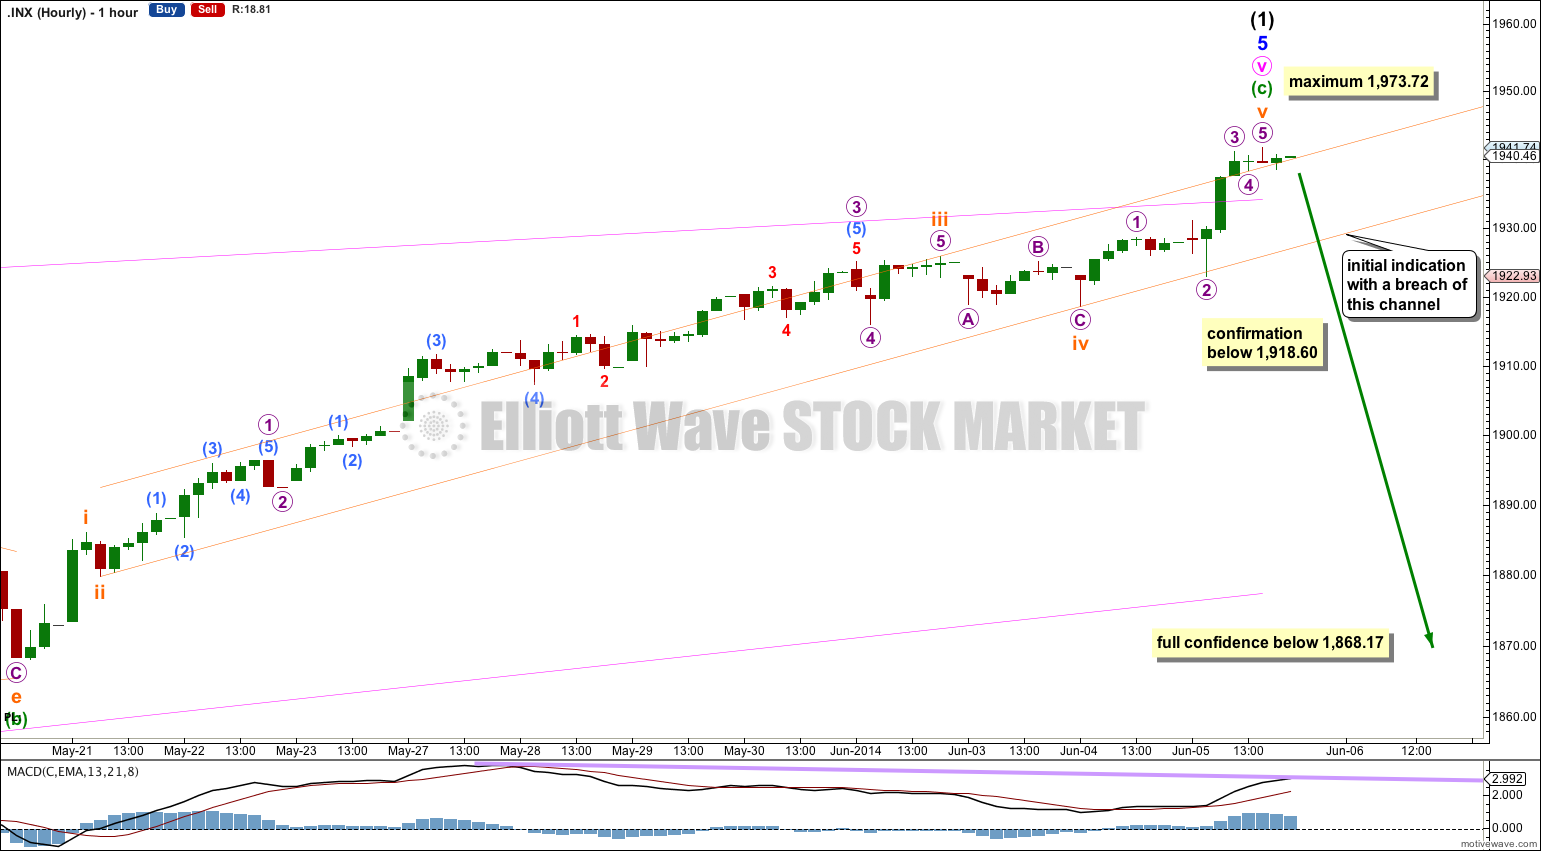
The pink trend line is now slightly overshot and the structure of minuette wave (c) on the hourly and five minute chart is complete.
Minuette wave (c) is 3.07 points longer than equality with minuette wave (a).
Ratios within minuette wave (c) are: subminuette wave iii is just 0.83 short of 2.618 the length of subminuette wave i, and subminuette wave v has no adequate Fibonacci ratio to either of subminuette waves i or iii.
Within subminuette wave v no second wave correction may move beyond the start of its first wave below 1,918.60. Movement below this point could not be a second wave correction within subminuette wave v, and so movement below this point would indicate subminuette wave v is over.
Movement below the parallel channel containing minuette wave (c) would provide trend channel confirmation that this upwards wave is over.
Finally, movement below 1,868.17 at the start of minuette wave (c) may not be a second wave correction within minuette wave (c), and so at that stage minuette wave (c) must be over. At that stage I would have full confidence in stating that a new downwards trend for intermediate wave (2) has begun.
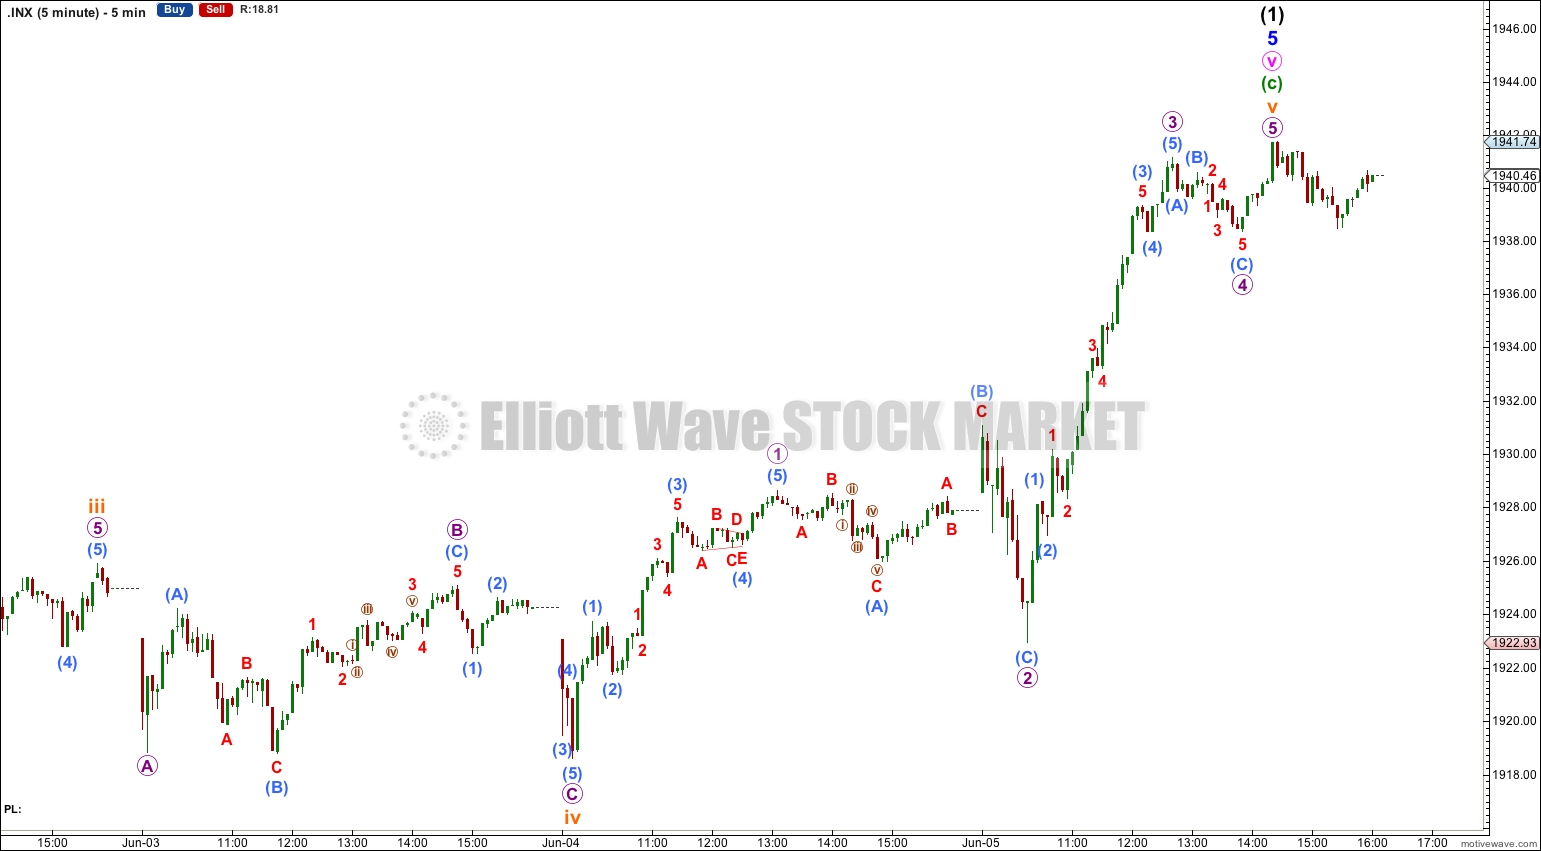
At this stage it is possible that micro wave 5 is incomplete and only submicro wave (1) within it may be complete. Price may move a little higher before it turns.
There is divergence with MACD, which supports a trend change either here or very soon.
Bearish Alternate Wave Count.
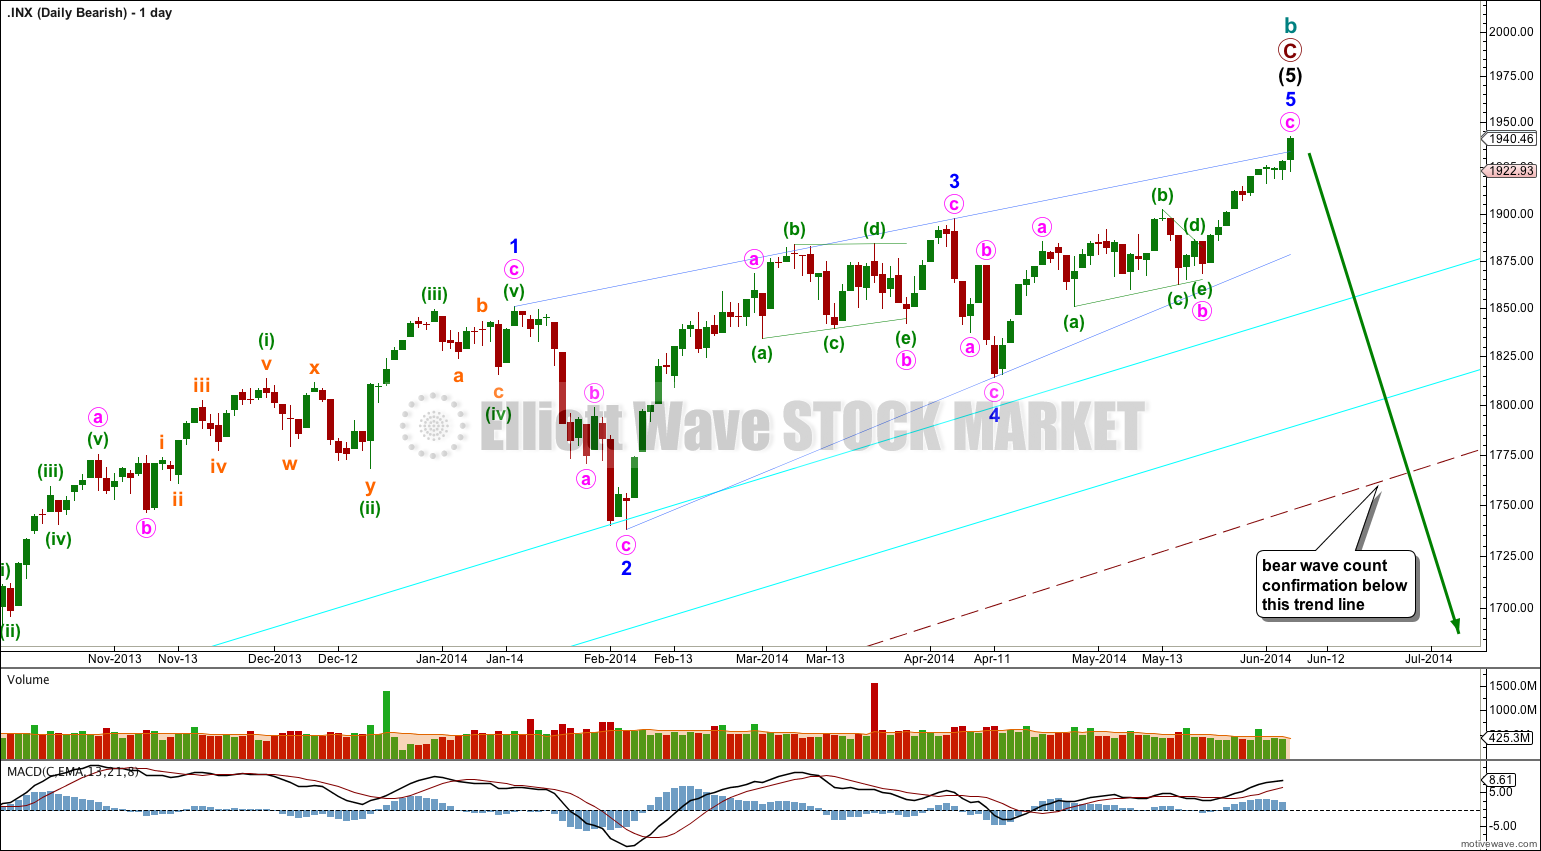
This bearish alternate wave count expects that the correction is not over. The flat correction which ended at 666.79 was only cycle wave a of a larger super cycle second wave correction.
Cycle wave b is now longer than the maximum common length of 138% for a B wave of a flat correction, it is 148%.
Cycle wave b may again be a complete zigzag structure.
A clear breach of the large maroon – – – channel on the monthly and weekly charts is required for confirmation of this wave count. If that happens then this would be my main wave count and would be strongly favoured. Only once this wave count is confirmed will I calculate downwards targets for cycle wave c for you; it would be premature to do that prior to confirmation.