
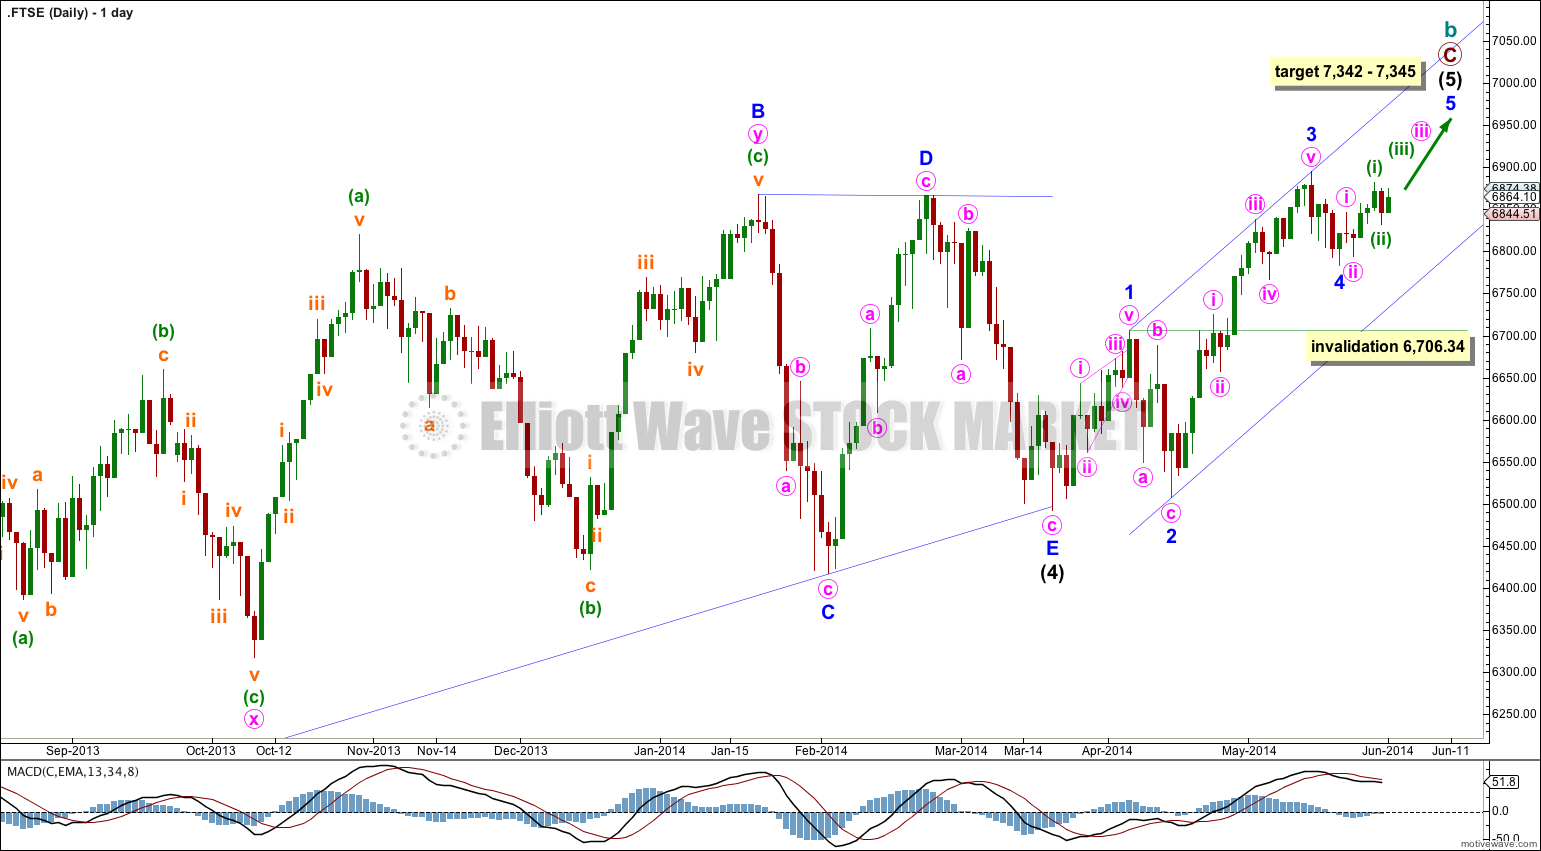
Upwards movement continues as expected. The short term target is 6,853. The target for upwards movement is now calculated at two wave degrees and is slightly widened to a two point zone between 7,342 and 7,345.
Movement above 6,865.86 has provided full and final confidence that the intermediate degree trend is up.
Click on charts to enlarge.
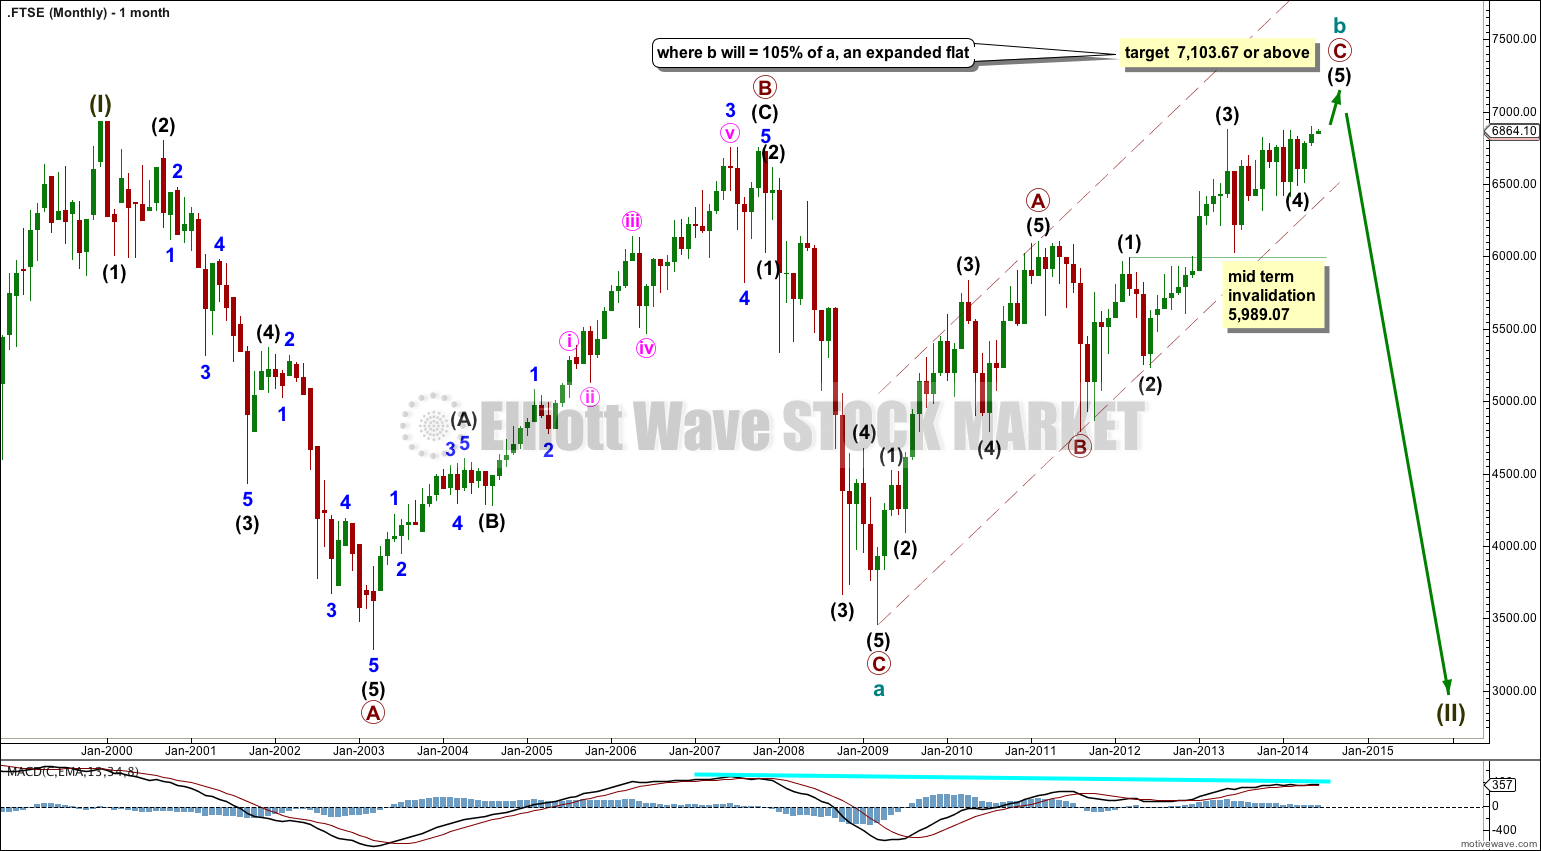
This main wave count expects that FTSE remains within a huge super cycle expanded flat correction. My alternate idea would be more in line with my bullish main wave count for the S&P 500: the FTSE may have ended its correction at 3,460.71 in March 2009 and that may be where a new bull market began.
The subdivisions and expectations for the mid term are the same for both ideas and so I will publish only one at this stage. When the next intermediate degree wave upwards is complete then I would use the lower edge of the maroon channel to differentiate between a long term bullish and bearish outlook. A bull market should breach the upper edge of this maroon channel, and it should not breach the lower edge. A bear market must breach the lower edge of this maroon channel.
If this upwards movement is a zigzag for a cycle degree b wave then it is incomplete. At 7,103.67 or above cycle wave b would reach 105% the length of cycle wave a. This would see the flat an expanded flat which is the most common type, and so movement above this point is reasonably likely.
In the mid term if we see more downwards movement then intermediate wave (4) may not move into intermediate wave (1) price territory. This wave count is invalidated with movement below 5,989.07.
Intermediate wave (4) may have ended as a running barrier triangle with the B-D trend line essentially flat.
Following a barrier triangle in a fourth wave position the fifth wave is often either a short sharp movement, or an exceptionally long extension. A long extended fifth wave would be less likely in this case as that would make cycle wave b longer than the maximum common length of 138% the length of cycle wave a (cycle waves seen on the monthly chart). So a short sharp fifth wave (relative to intermediate waves (1) and (3)) is more likely.
At 7,345 intermediate wave (5) would reach equality with the widest part of the triangle. At 7,342 minor wave 5 would reach 2.618 the length of minor wave 1.
Minor wave 3 is now complete and has no Fibonacci ratio to minor wave 1. I would expect minor wave 5 to exhibit a Fibonacci ratio to either of minor waves 3 or 1.
I have drawn a parallel channel about intermediate wave (5) using Elliott’s first technique: draw the first trend line from the ends of minor waves 1 to 3, then place a parallel copy on the end of minor wave 2. Minor wave 4 remains within the channel. Another parallel trend line on the end of minor wave 4 may also be useful for showing where upwards movement is finding support.
At this stage it looks like minor wave 5 is extending, and has begun with two overlapping first and second waves. This indicates some increase in upwards momentum should occur over the next few days.
If minor wave 4 were to continue further it may not move into minor wave 1 price territory below 6,706.34.