
Upwards movement was again expected. Momentum is slowing which was also expected.
Summary: Upwards movement is incomplete. The target is at 1,939 to 1,940 and this may be met in one or possibly two more days. Upwards movement is most likely to end when the upper i-iii pink trend line is slightly overshot.
This analysis is published about 02:32 a.m. EST. Click on charts to enlarge.
The aqua blue trend lines are critical. Draw the first trend line from the low of 1,158.66 on 25th November, 2011 to the next swing low at 1,266.74 on 4th June, 2012. Create a parallel copy and place it on the low at 1,560.33 on 24th June, 2013. While price remains above the lower of these two aqua blue trend lines we must assume the trend remains upwards. This is the main reason for the bullish wave count being my main wave count.
Bullish Wave Count.
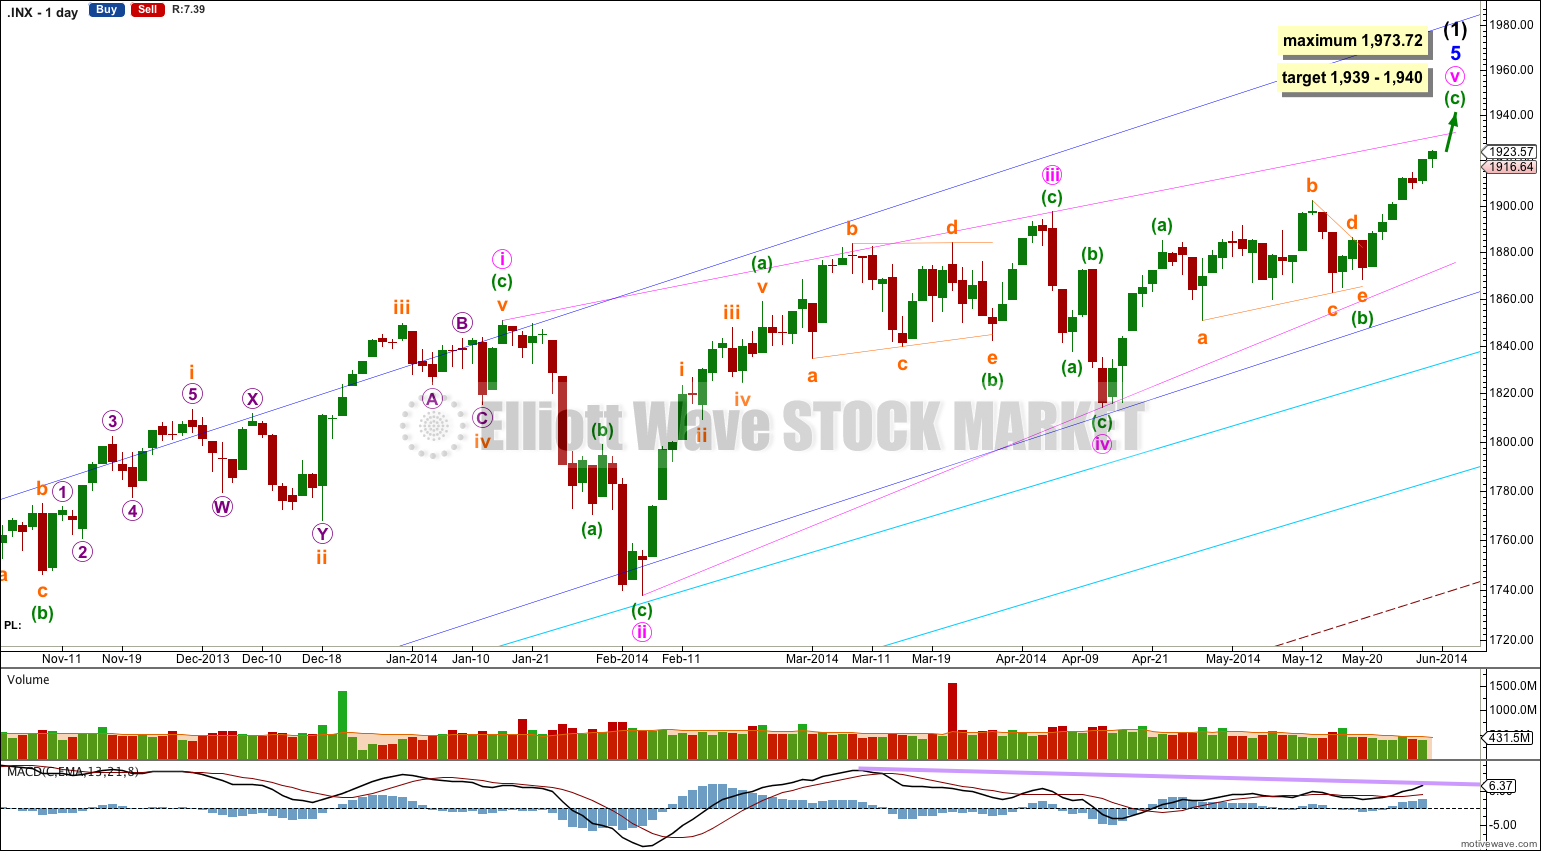
This bullish wave count expects a cycle degree correction was over at 666.79 for a fourth wave, and a new cycle degree bull market began there for a fifth wave. Within cycle wave V primary waves 1 and 2 are complete. Within primary wave 3 intermediate wave (1) is almost complete.
Minor wave 5 is an almost complete ending contracting diagonal. Within an ending diagonal all the subwaves must be single zigzags, and the fourth wave should overlap first wave price territory.
Within the final fifth wave of this diagonal minuette wave (b) is a running contracting triangle. Minuette wave (c) is an incomplete impulse.
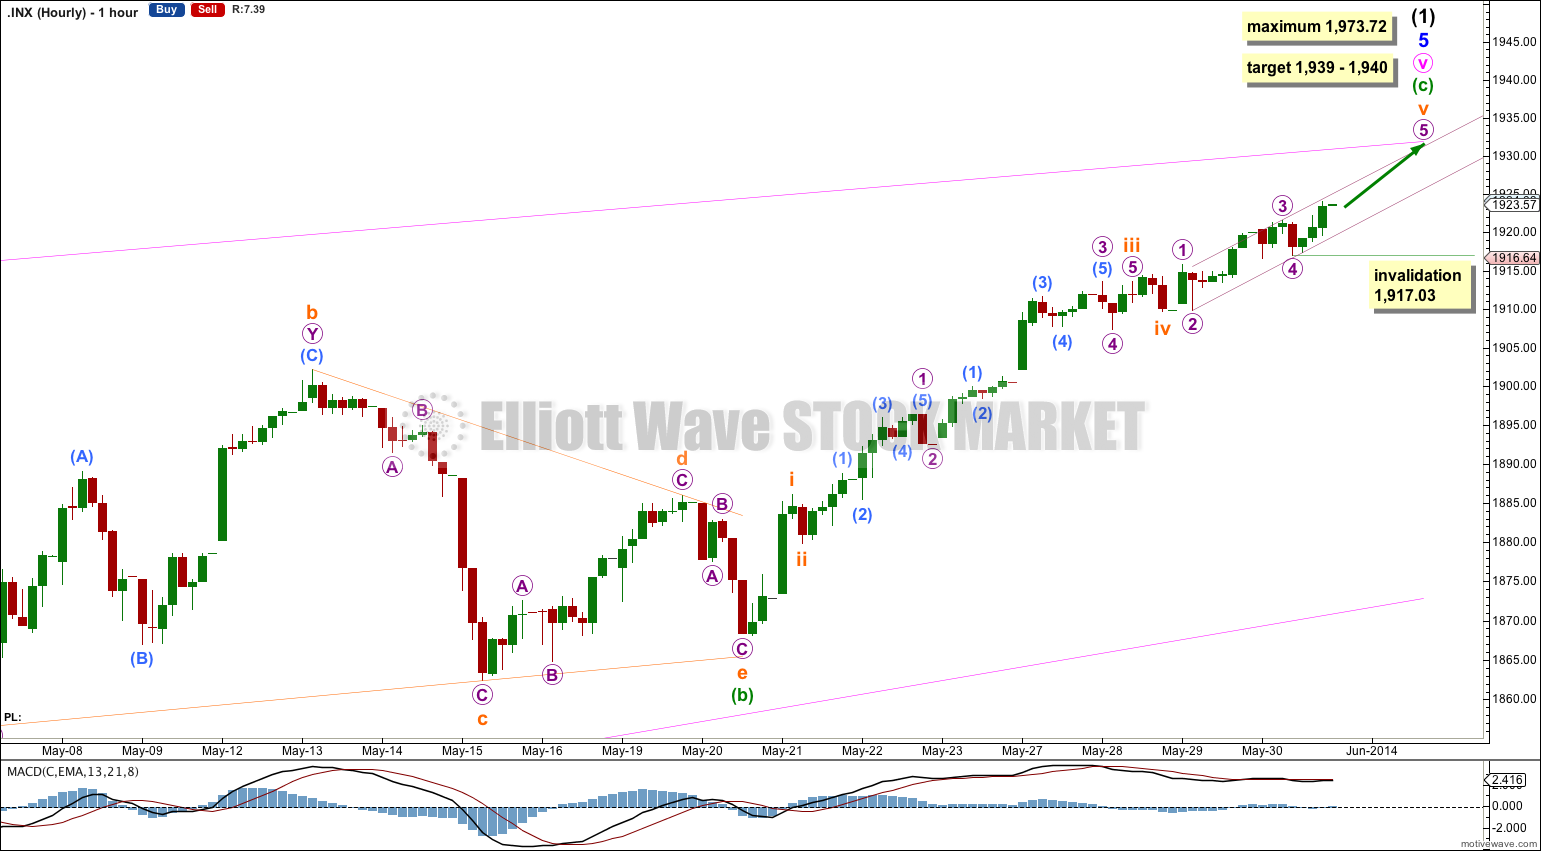
I would expect the final fifth wave of this diagonal to end at the upper i-iii trend line, or maybe to overshoot this trend line.
The diagonal is contracting because minute wave iii is shorter than minute wave i. Minute wave v may not be longer than equality with minute wave iii at 1,973.72 because a third wave may never be the shortest wave.
At 1,939 minuette wave (c) would reach equality with minuette wave (a). If minuette wave (c) lasts a total Fibonacci eight days then it may end in another one day. However, looking at the distance of the pink i-iii trend line from current price upwards movement may take another two days to reach that trend line and the target.
There is persistent divergence with price trending higher and MACD trending lower. This classic technical divergence supports this wave count, it indicates that at least a reasonably sized correction should arrive soon.
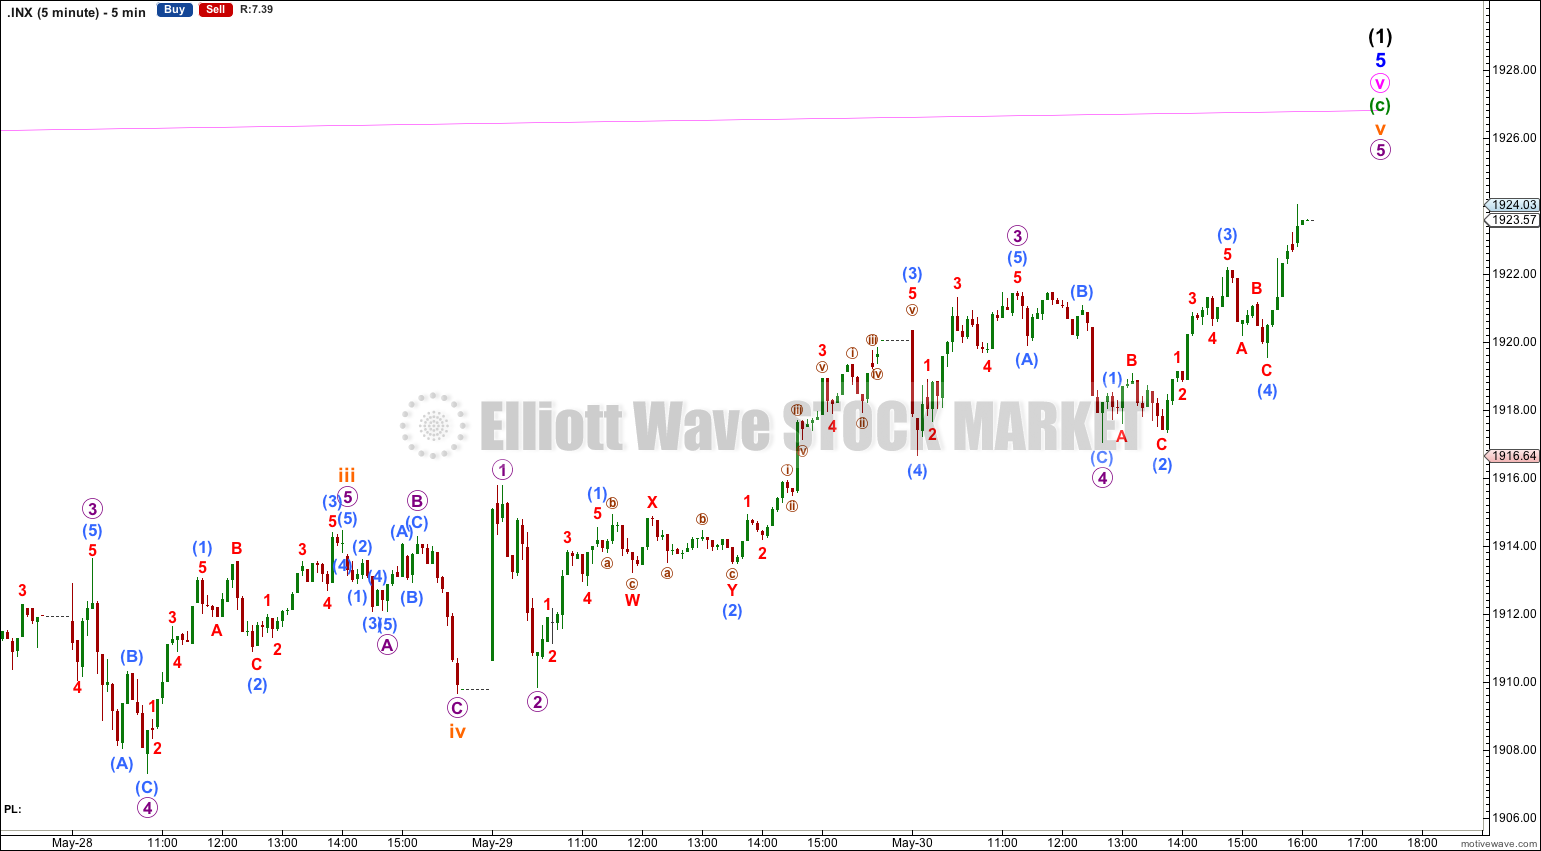
At this stage this upwards movement is subdividing as a very typical looking impulse. Subminuette wave iii shows the strongest upwards momentum so far. Subminuette wave v should continue to show a slowing of momentum so that we can see clear divergence on the hourly chart as well as on the daily chart.
At 1,939 minuette wave (c) would reach equality in length with minuette wave (a).
I have redrawn the channel about this upwards movement as subminuette wave v was not well contained within the last channel. Draw a channel about subminuette wave v only using Elliott’s second technique: draw the first trend line from the lows of micro waves 2 to 4, then place a parallel copy upon the high of micro wave 3. I will expect micro wave 5 is likely to be contained within this small channel.
I will expect upwards movement for Monday is likely to at least touch the pink i-iii trend line of the diagonal, and it may overshoot this line slightly if the target is met. I will expect that upwards movement is incomplete until this trend line is at least met.
Within micro wave 5 no second wave correction may move beyond the start of its first wave below 1,917.03.
If the small channel drawn here about subminuette wave v is breached by downwards movement, and if price moves below 1,917.03 BEFORE the pink i-iii trend line is at least touched, then I would move the labelling within minuette wave (c) all down one degree and expect that downwards movement is a second wave correction within minuette wave (c). In short, I will not again expect that the final high has been met until that trend line is at least touched.
Bearish Alternate Wave Count.
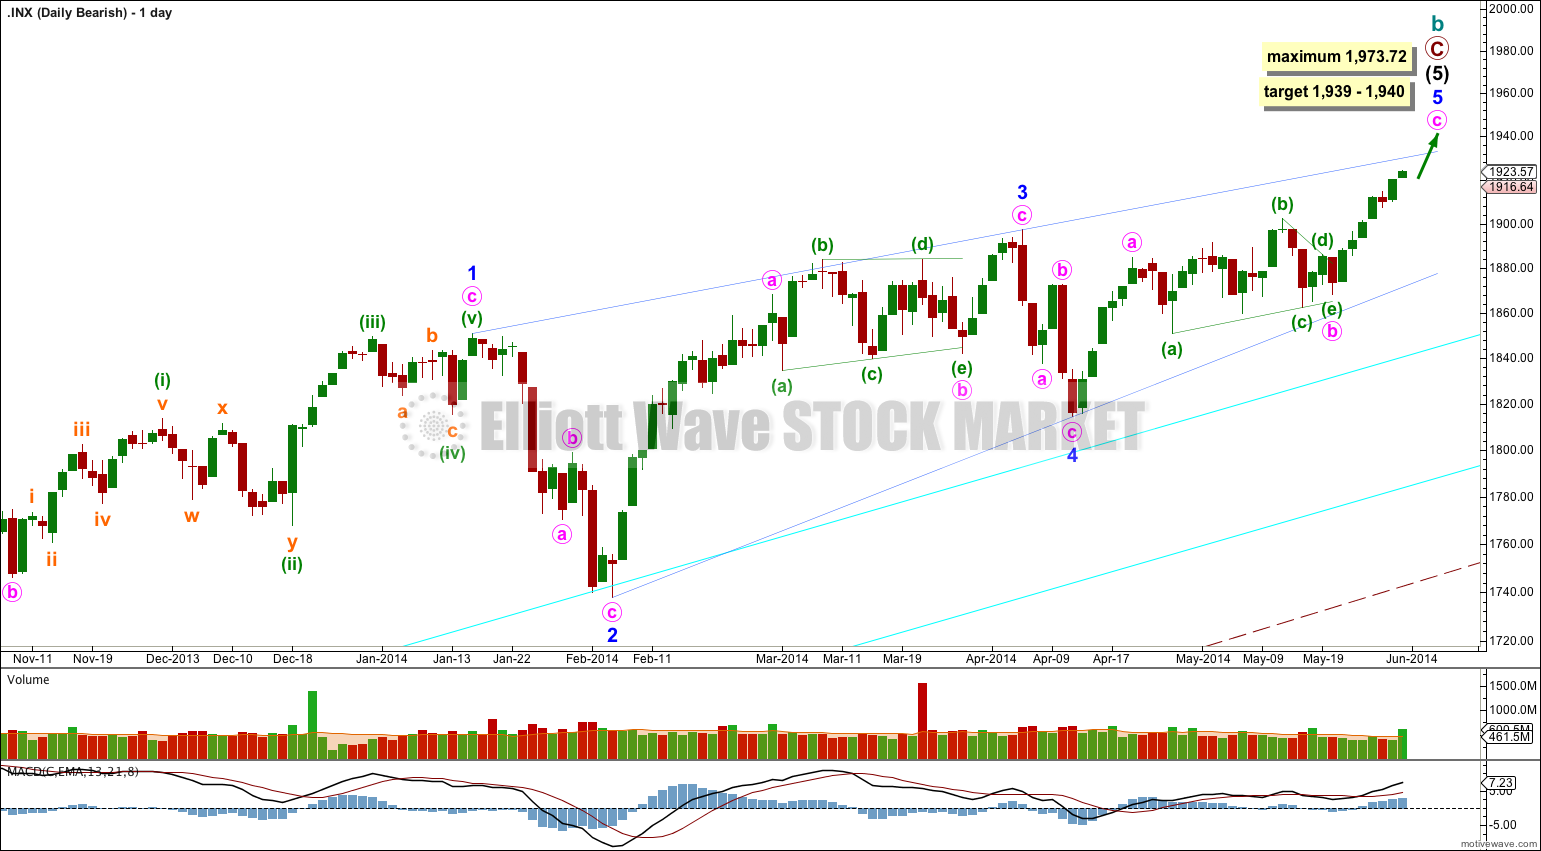
This bearish alternate wave count expects that the correction is not over. The flat correction which ended at 666.79 was only cycle wave a of a larger super cycle second wave correction.
Cycle wave b is now longer than the maximum common length of 138% for a B wave of a flat correction.
Cycle wave b is an almost complete zigzag structure.
A clear breach of the large maroon – – – channel on the monthly and weekly charts is required for confirmation of this wave count. If that happens then this would be my main wave count and would be strongly favoured. Only once this wave count is confirmed will I calculate downwards targets for cycle wave c for you; it would be premature to do that prior to confirmation.