
Upwards movement for Friday was not expected. I had expected Friday to see more downwards movement. A second wave correction had already arrived.
Summary: In the short term a second wave correction may be over. When the small channel on the hourly chart containing it is breached then expect downwards movement towards 1,814 with an increase in momentum. This target may be met in three or five days.
This analysis is published about 09:07 p.m. EST. Click on charts to enlarge.
The aqua blue trend lines are critical. Draw the first trend line from the low of 1,158.66 on 25th November, 2011 to the next swing low at 1,266.74 on 4th June, 2012. Create a parallel copy and place it on the low at 1,560.33 on 24th June, 2013. While price remains above the lower of these two aqua blue trend lines we must assume the trend remains upwards. This is the main reason for the bullish wave count being my main wave count.
Bullish Wave Count.
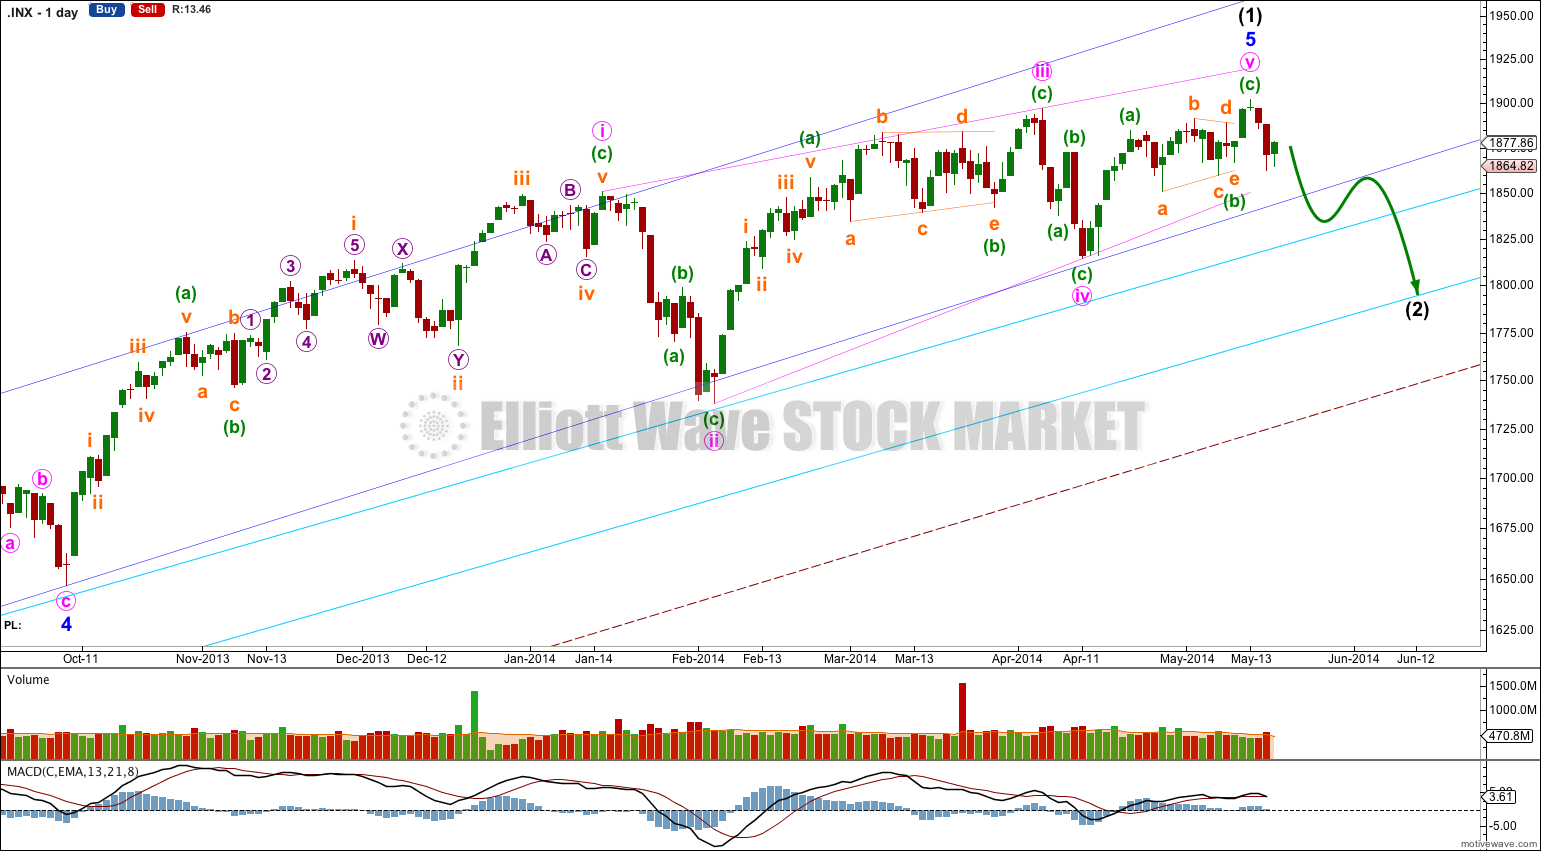
This bullish wave count expects a cycle degree correction was over at 666.79 for a fourth wave, and a new cycle degree bull market began there for a fifth wave. Within cycle wave V primary waves 1 and 2 are complete. Within primary wave 3 intermediate wave (1) complete.
There are several possible structures that intermediate wave (2) can take. It is most likely to be a zigzag, but it may also be a flat, combination, double zigzag or double flat. It could also possibly be a triple, but that has an extremely low probability. It may not be a triangle.
If intermediate wave (2) is a flat correction or a combination then within it we may see a new high above 1,902.17. For this reason there is no upper invalidation point for this bullish wave count. A new high above 1,902.17 would eliminate the bearish scenario as described in this analysis below.
Intermediate wave (2) should last several weeks and may last about two or three months. It should be choppy and overlapping and it should find support at the lower aqua blue trend line. A breach of this trend line by more than 3% of market value would see this bullish wave count discarded in favour of the bearish wave count below.
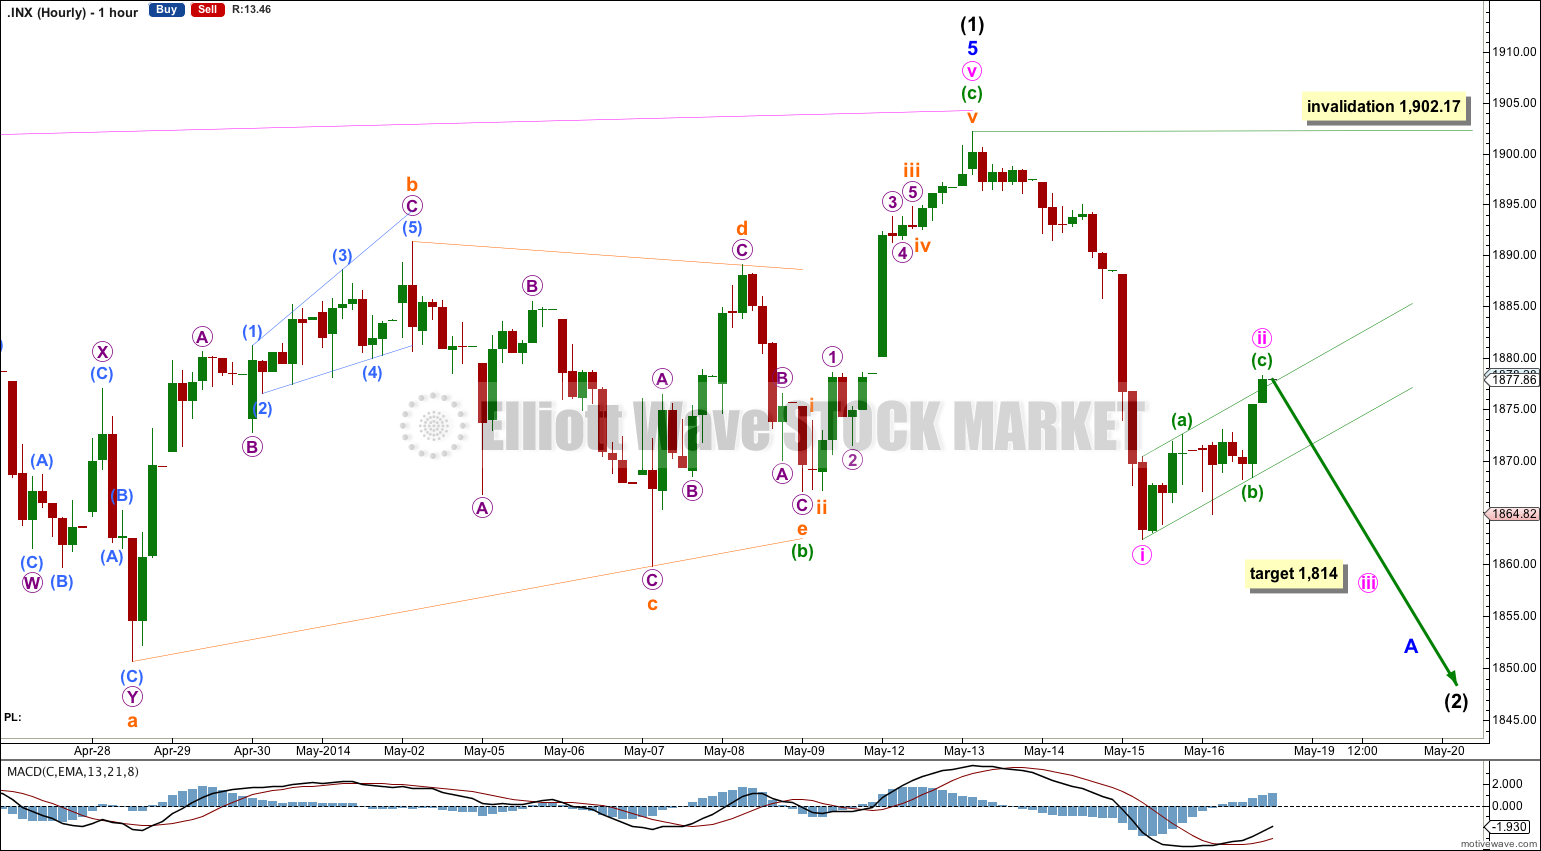
Minute wave i was already over, upwards movement continued and the proportion of it indicates it is minute wave ii.
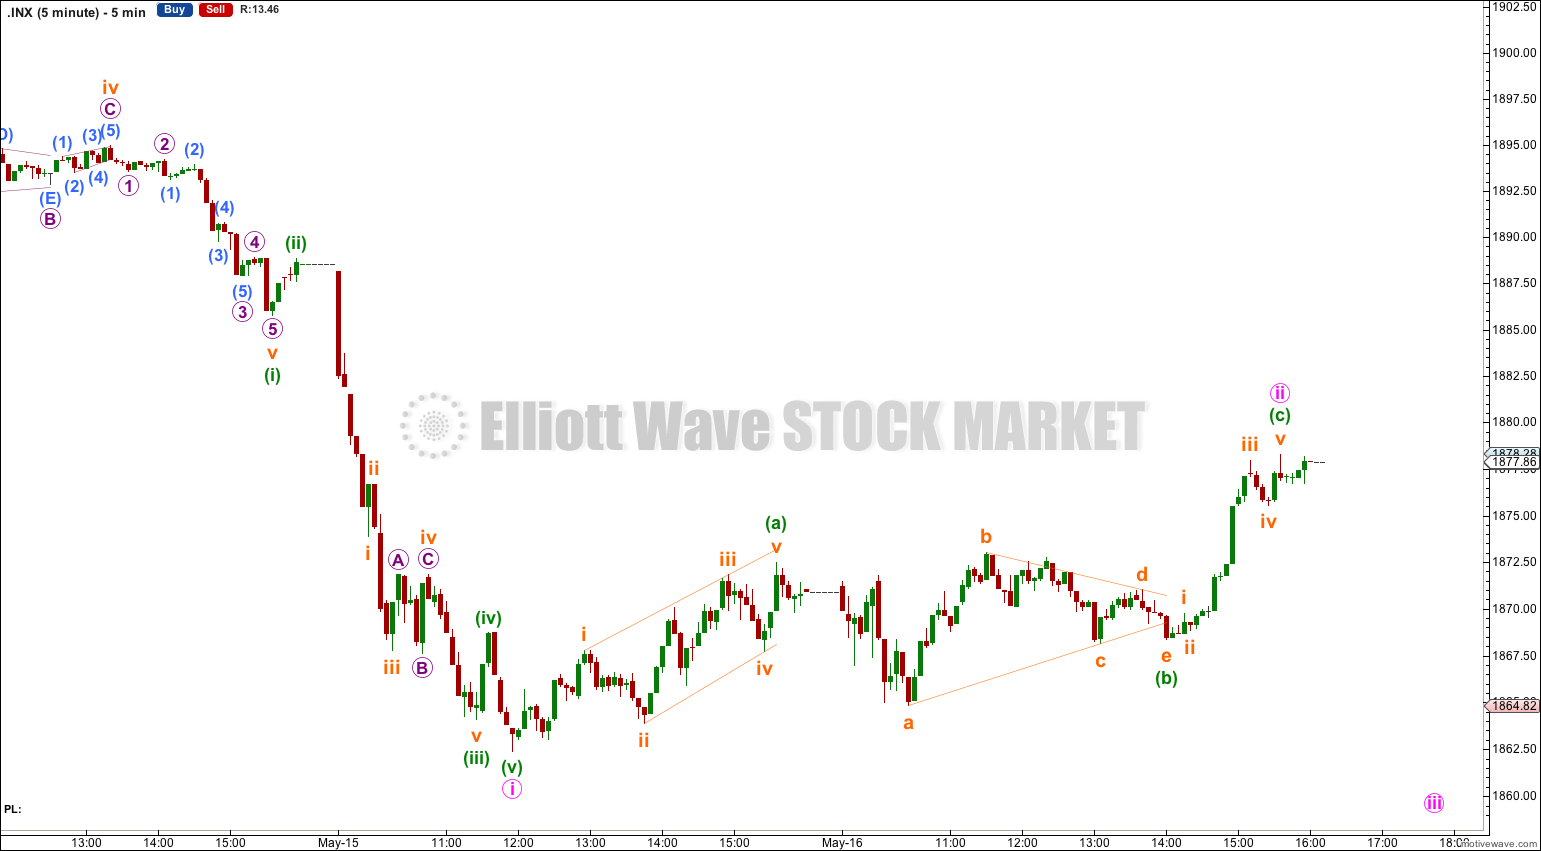
Within minute wave ii minuette waves (a) and (c) are close to equality, and minuette wave (c) has slightly overshot the upper edge of the channel. This indicates that minute wave ii is most likely to be over here. It could continue further as a flat correction, combination or double zigzag. When the small channel about this upwards correction is clearly breached by some downwards movement, and if that downwards movement looks like a five wave structure (not a three) then I would have some confidence in the target.
At 1,814 minute wave iii would reach 1.618 the length of minute wave i.
If minute wave ii does move higher it may not move beyond the start of minute wave i above 1,902.17.
Bearish Alternate Wave Count.
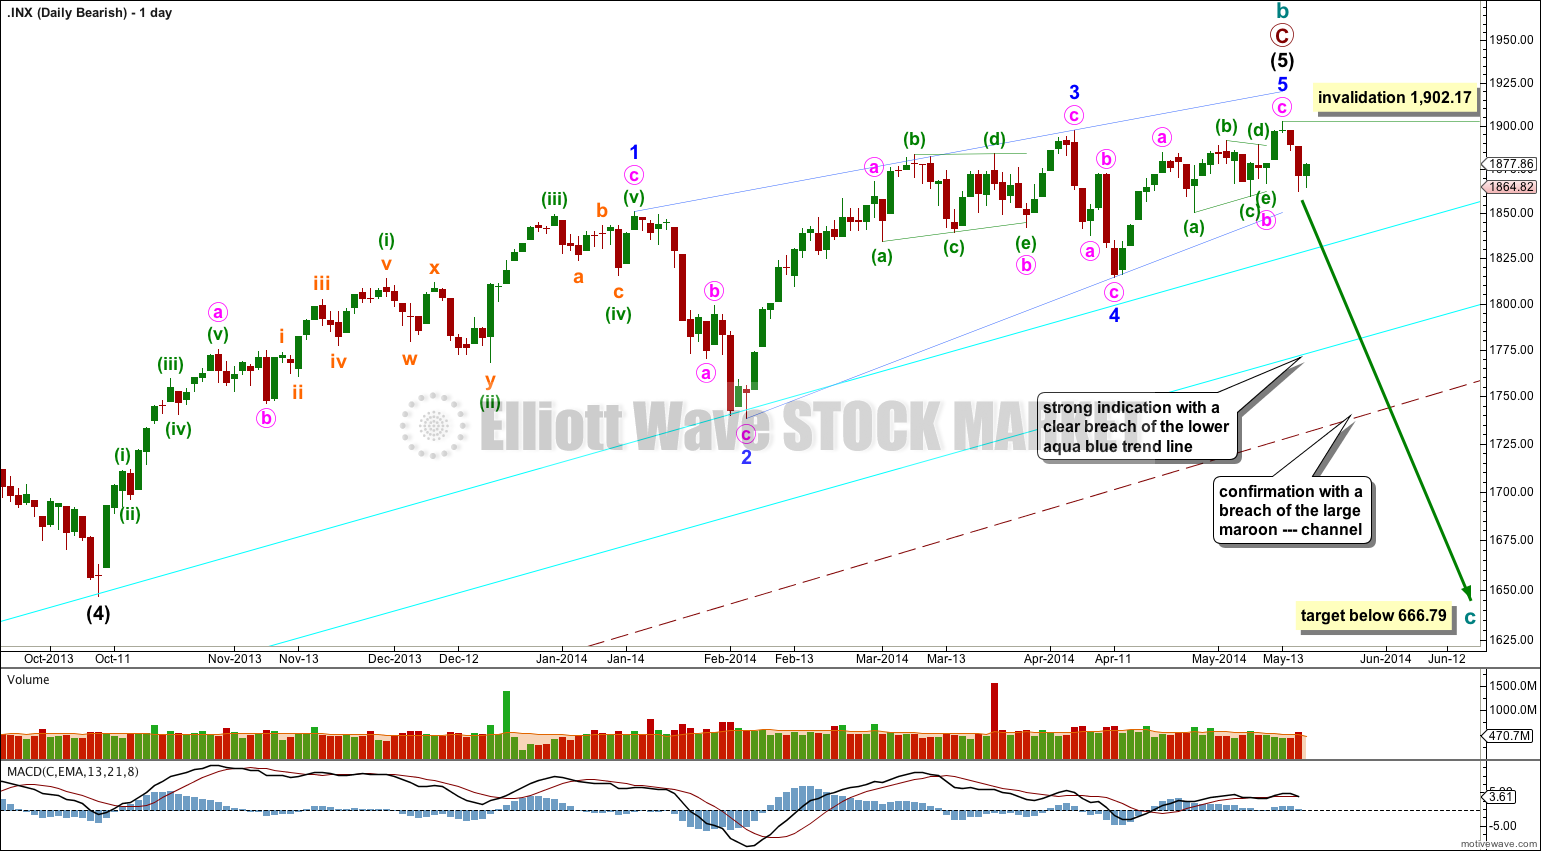
This bearish alternate wave count expects that the correction is not over. The flat correction which ended at 666.79 was only cycle wave a of a larger super cycle second wave correction.
Cycle wave b is now a 143% correction of cycle wave a, just a little longer than the maximum common length of 138% for a B wave of a flat correction.
Cycle wave b is now a complete zigzag structure.
A clear breach of the large maroon – – – channel on the monthly and weekly charts is required for confirmation of this wave count. If that happens then this would be my main wave count and would be strongly favoured. Only once this wave count is confirmed will I calculate downwards targets for cycle wave c for you; it would be premature to do that prior to confirmation.
Within cycle wave c no second wave correction may move beyond the start of its first wave above 1,902.17.
Cycle wave c should move substantially below the end of cycle wave a below 666.79.