
I had expected downwards movement for the short term, for Thursday’s session, but not below 1,867.02. The hourly wave count was invalidated. This makes a big difference to the wave count so I will look at the bigger picture again.
Summary: The S&P has either begun an intermediate degree second wave correction, or a new cycle degree downwards trend. In the mid term I will expect choppy overlapping and downwards movement to end when price finds support at the lower aqua blue trend line. If this trend line is clearly breached the market may be crashing.
This analysis is published about 08:15 p.m. EST. Click on charts to enlarge.
Bullish Wave Count.
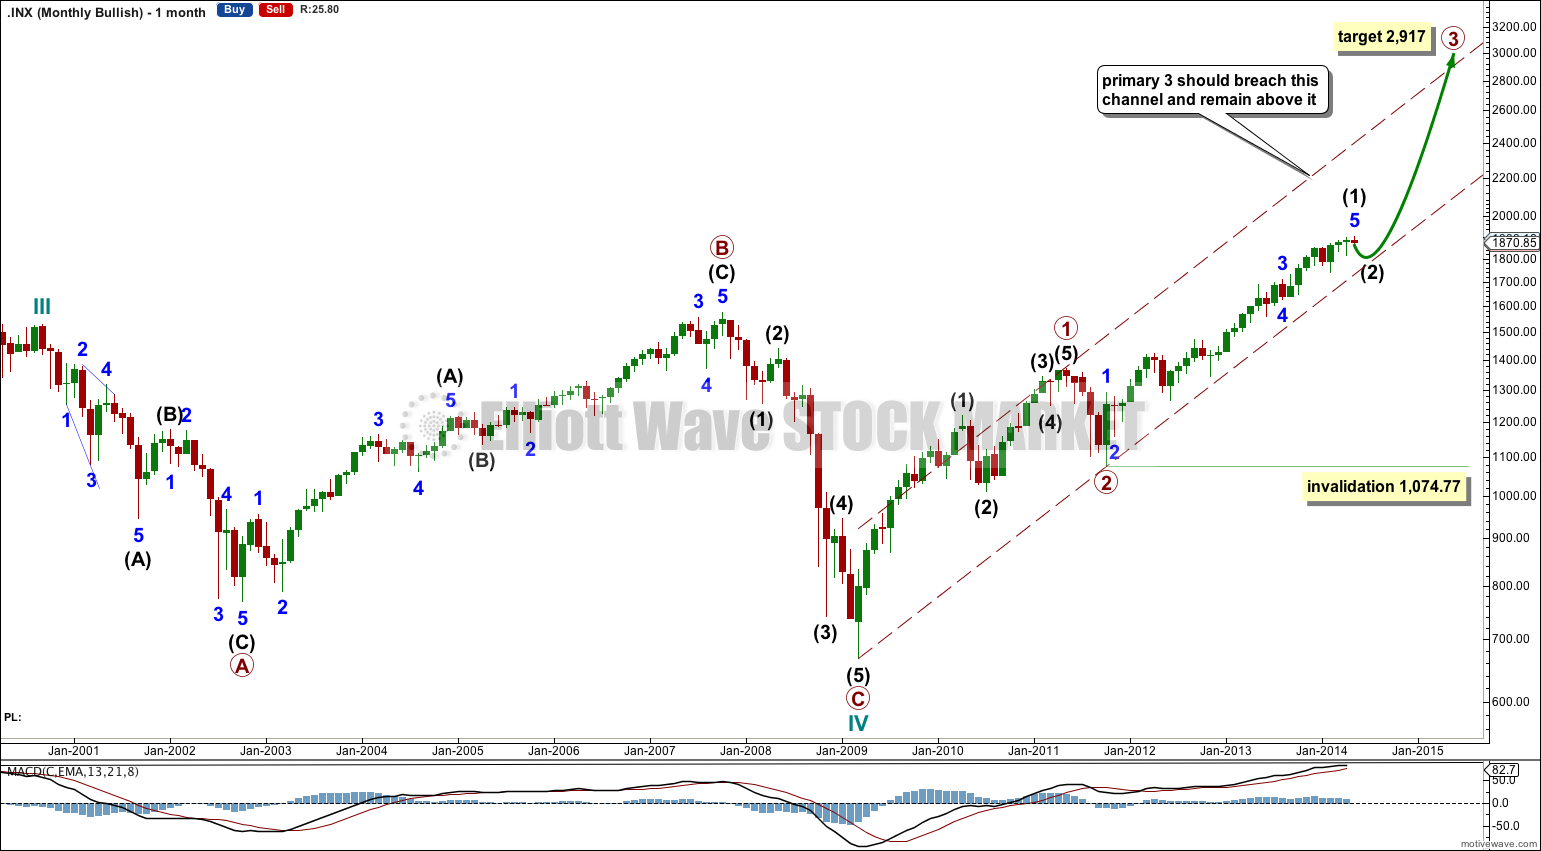
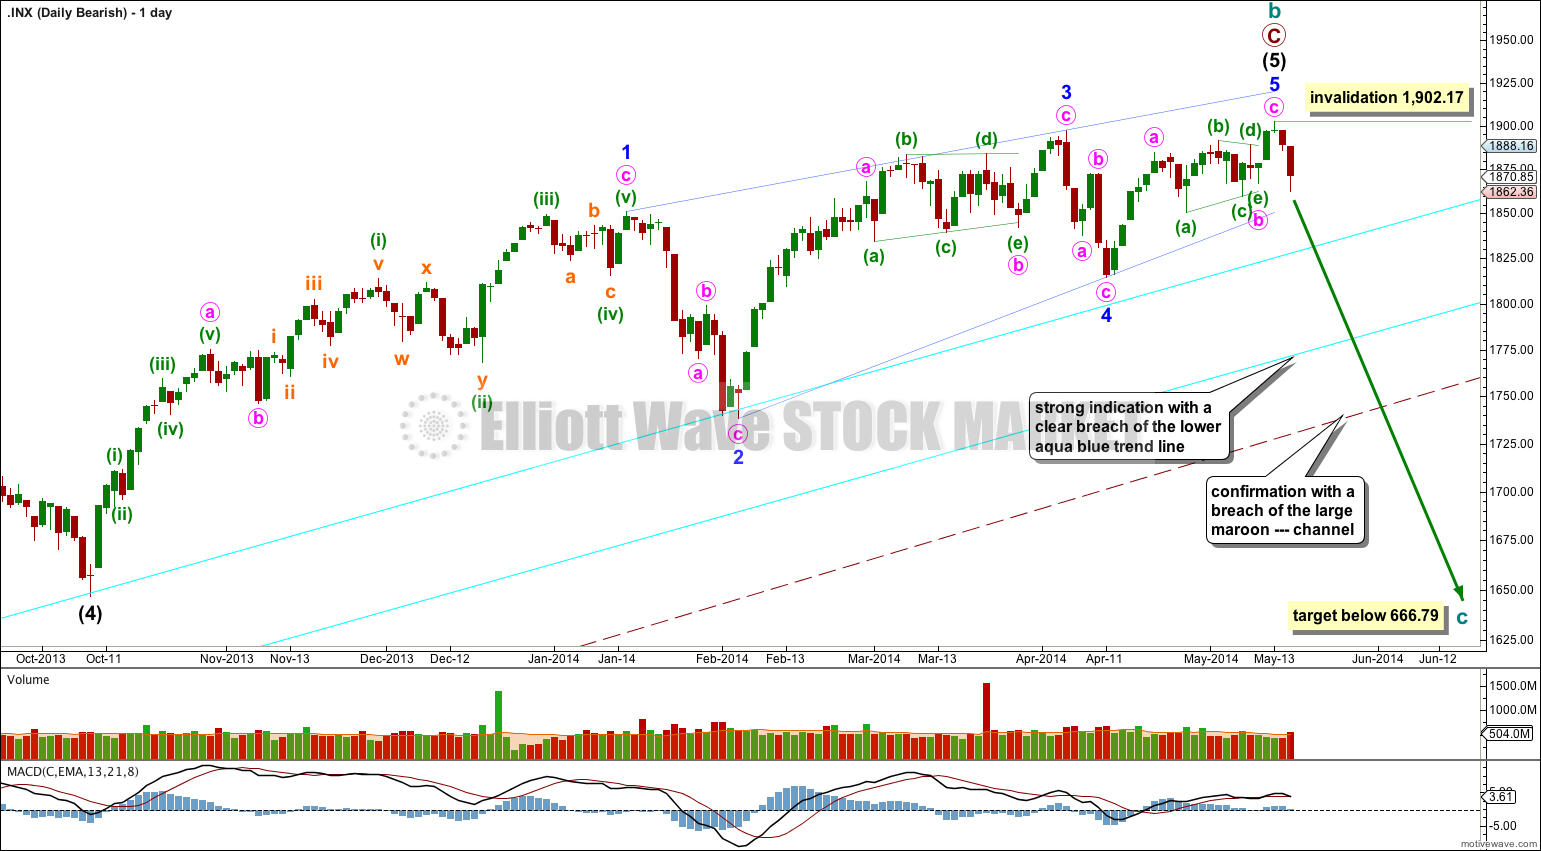
This bullish wave count expects a cycle degree correction was over at 666.79 for a fourth wave, and a new cycle degree bull market began there for a fifth wave. Within cycle wave V primary waves 1 and 2 are complete. Within primary wave 3 intermediate wave (1) is now just complete.
The large maroon – – – channel is here a base channel drawn about primary waves 1 and 2.
Primary wave 3 would reach 2.618 the length of primary wave 1 at 2,917. Primary wave 3 should break above the base channel containing primary waves 1 and 2, and then should remain above that channel. Primary wave 3 should not breach the lower edge of this channel.
Intermediate wave (2) may not move beyond the start of intermediate wave (1) below 1,074.77. However, if price breaks below the large maroon channel this wave count should be discarded.
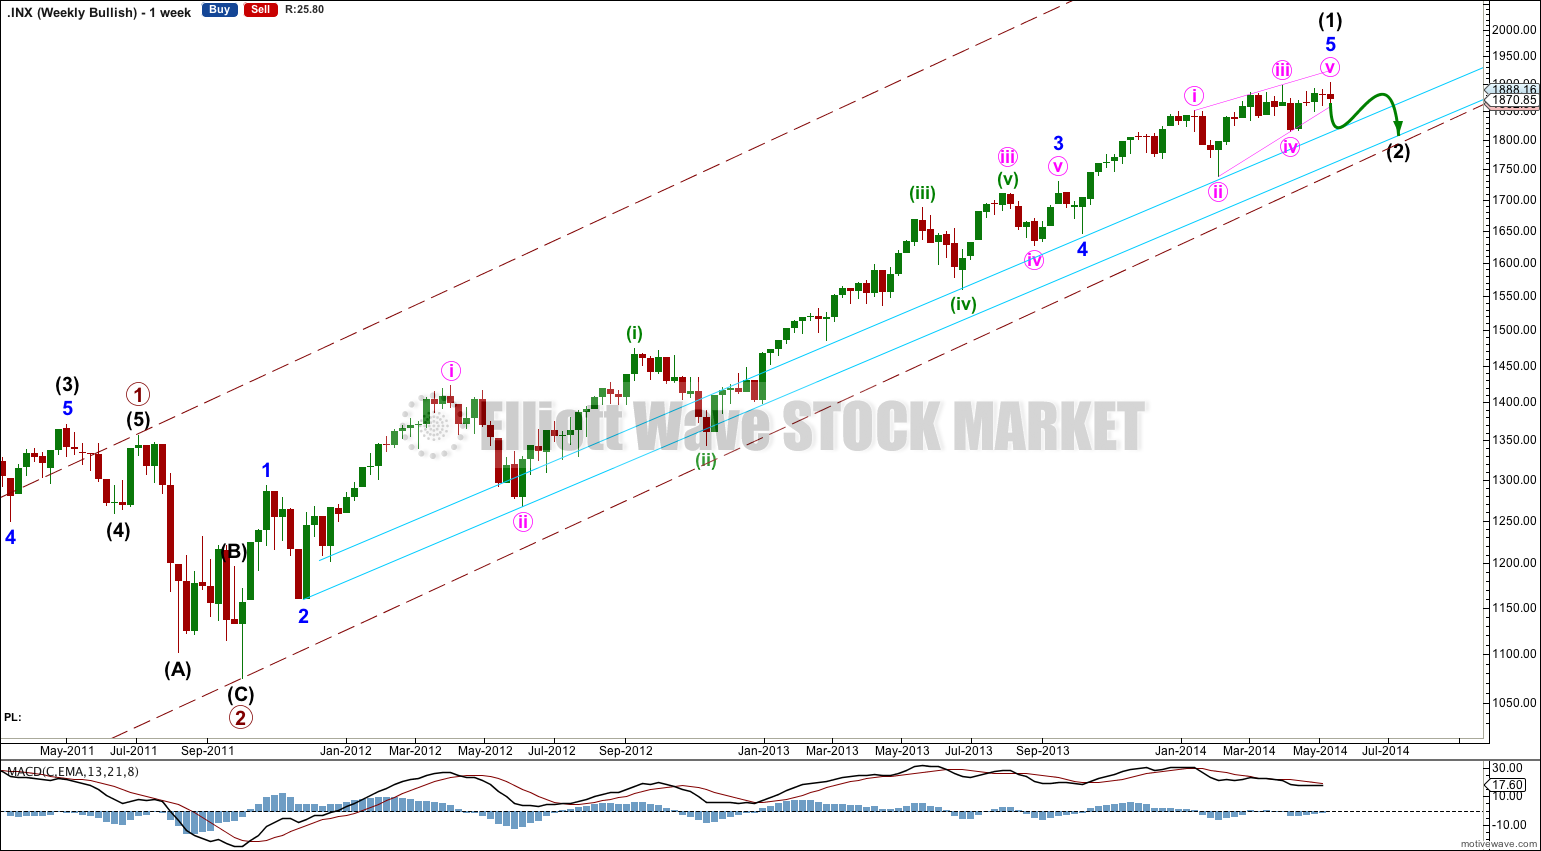
The aqua blue trend lines are critical. Draw the first trend line from the low of 1,158.66 on 25th November, 2011 to the next swing low at 1,266.74 on 4th June, 2012. Create a parallel copy and place it on the low at 1,560.33 on 24th June, 2013. While price remains above the lower of these two aqua blue trend lines we must assume the trend remains upwards. This is the main reason for the bullish wave count being my main wave count.
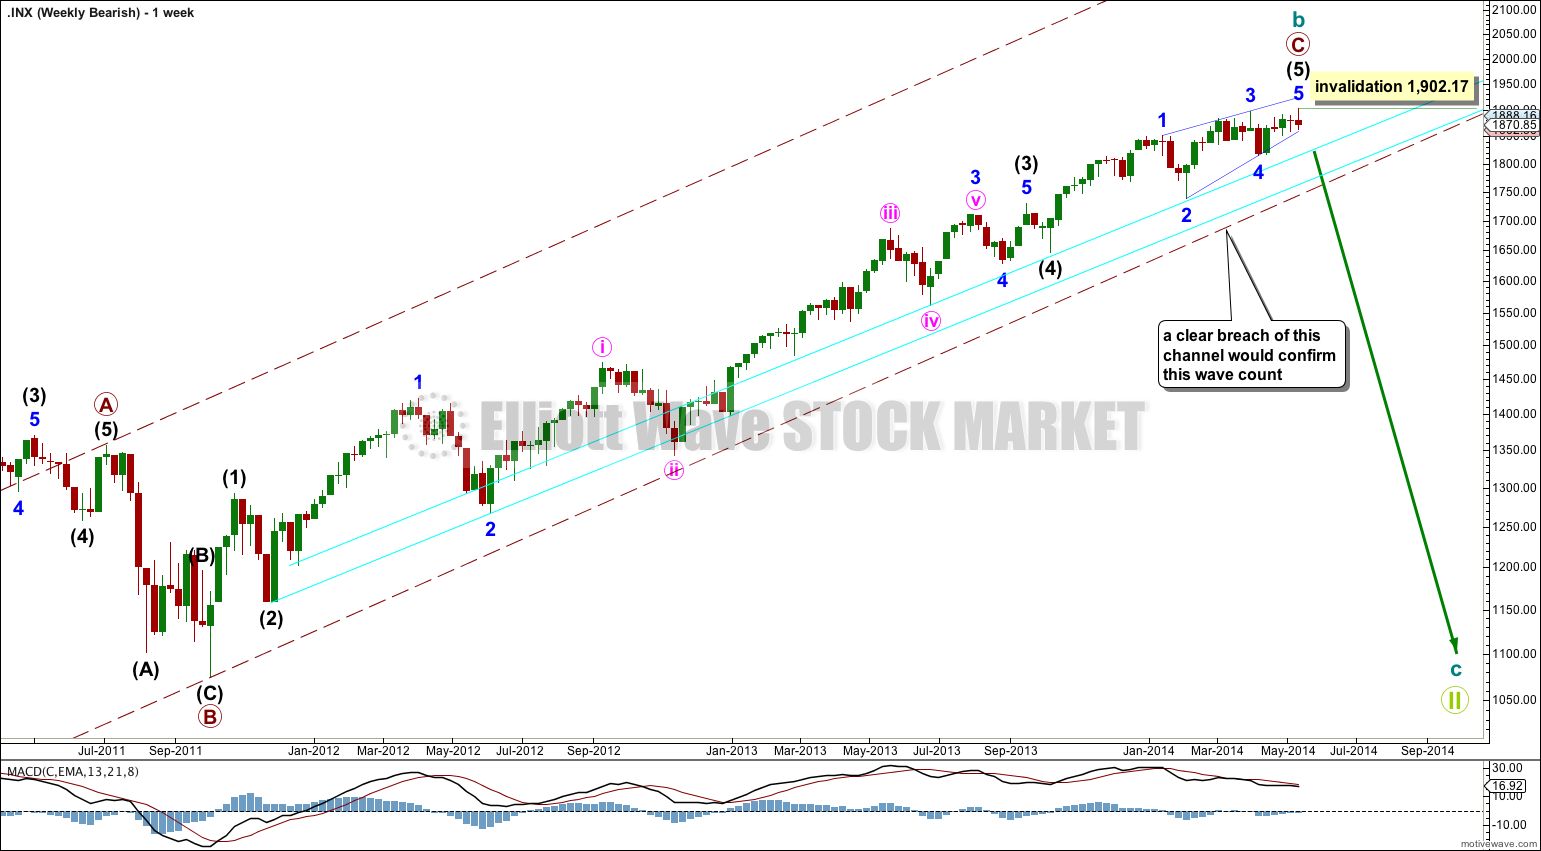
This weekly chart shows all of primary wave 3 so far.
Ratios within intermediate wave (1) are: minor wave 3 is just 0.76 longer than 2.618 the length of minor wave 1. This is a remarkably close Fibonacci ratio, and so I am confident that this first and third wave is labeled correctly. There is no Fibonacci ratio between minor wave 5 and either of 3 or 1.
Ratios within minor wave 3 are: minute wave iii is 16.23 longer than 1.618 the length of minute wave i, and minute wave v is just 1.6 longer than 0.382 the length of minute wave i.
Ratios within minute wave iii are: minuette wave (iii) is 7.66 longer than 1.618 the length of minuette wave (i), and minuette wave (v) has no Fibonacci ratio to either of minuette waves (i) or (iii).
Minor wave 5 is an ending contracting diagonal. The final fifth wave of the diagonal fell short of the 1-3 trend line, which is unusual (and so was unexpected) but is possible. The structure is now complete.
The lower aqua blue trend line has been held since November 2011. I would expect intermediate wave (2) to find strong support at this trend line. A breach of this trend line would be hugely significant and would see me swap over my bull and bear wave counts.
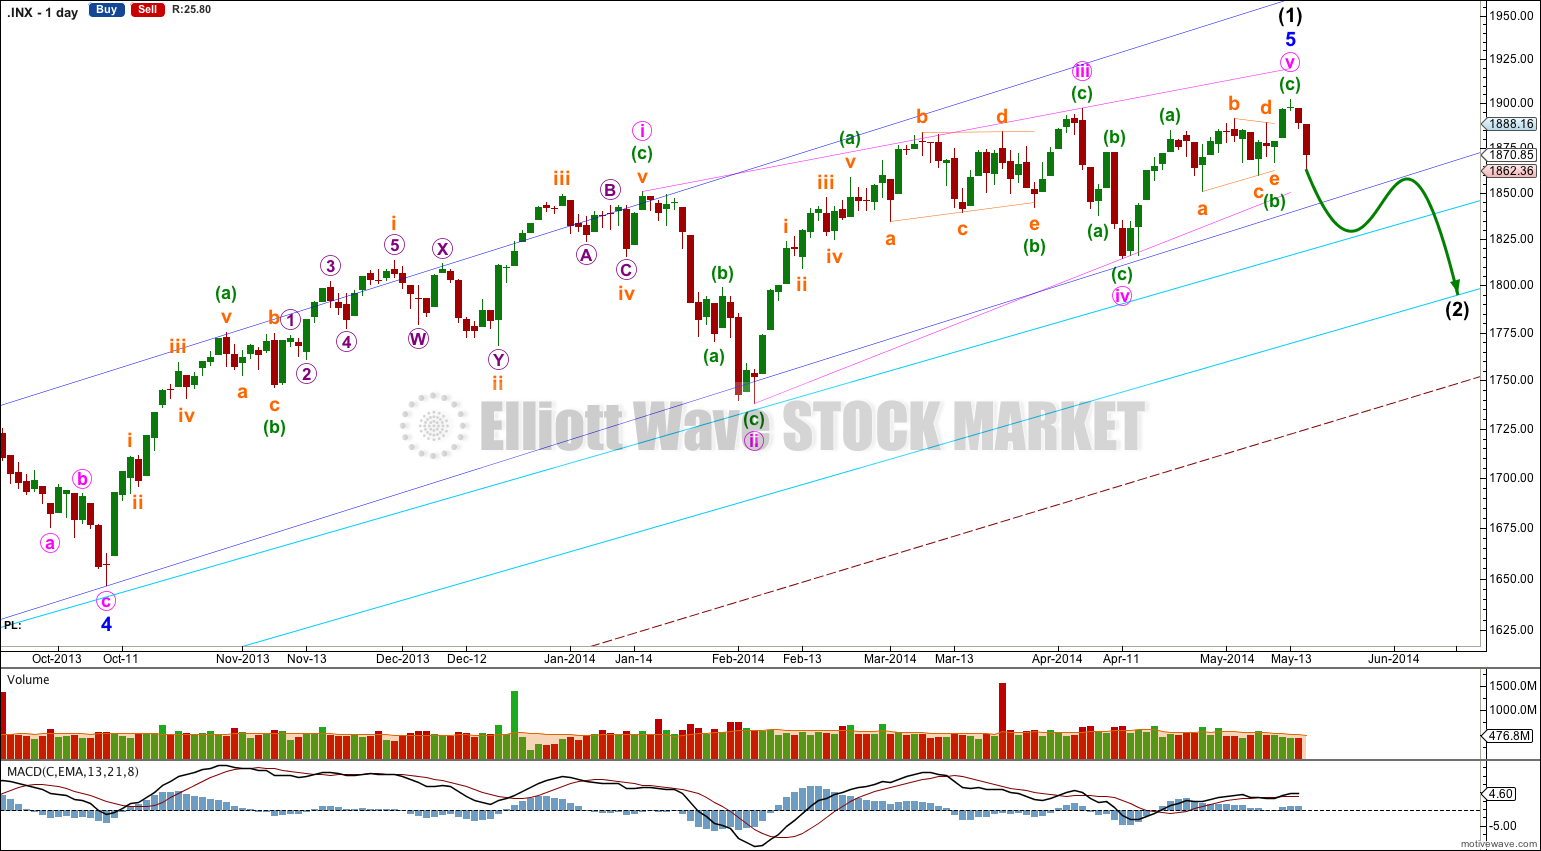
Although upwards movement did not reach the pink 1-3 trend line of the diagonal, the structure is now complete. A new low below the start of minuette wave (c) confirms that minuette wave (c) must be over.
There are several possible structures that intermediate wave (2) can take. It is most likely to be a zigzag, but it may also be a flat, combination, double zigzag or double flat. It could also possibly be a triple, but that has an extremely low probability. It may not be a triangle.
If intermediate wave (2) is a flat correction or a combination then within it we may see a new high above 1,902.17. For this reason there is no upper invalidation point for this bullish wave count. A new high above 1,902.17 would eliminate the bearish scenario as described in this analysis below.
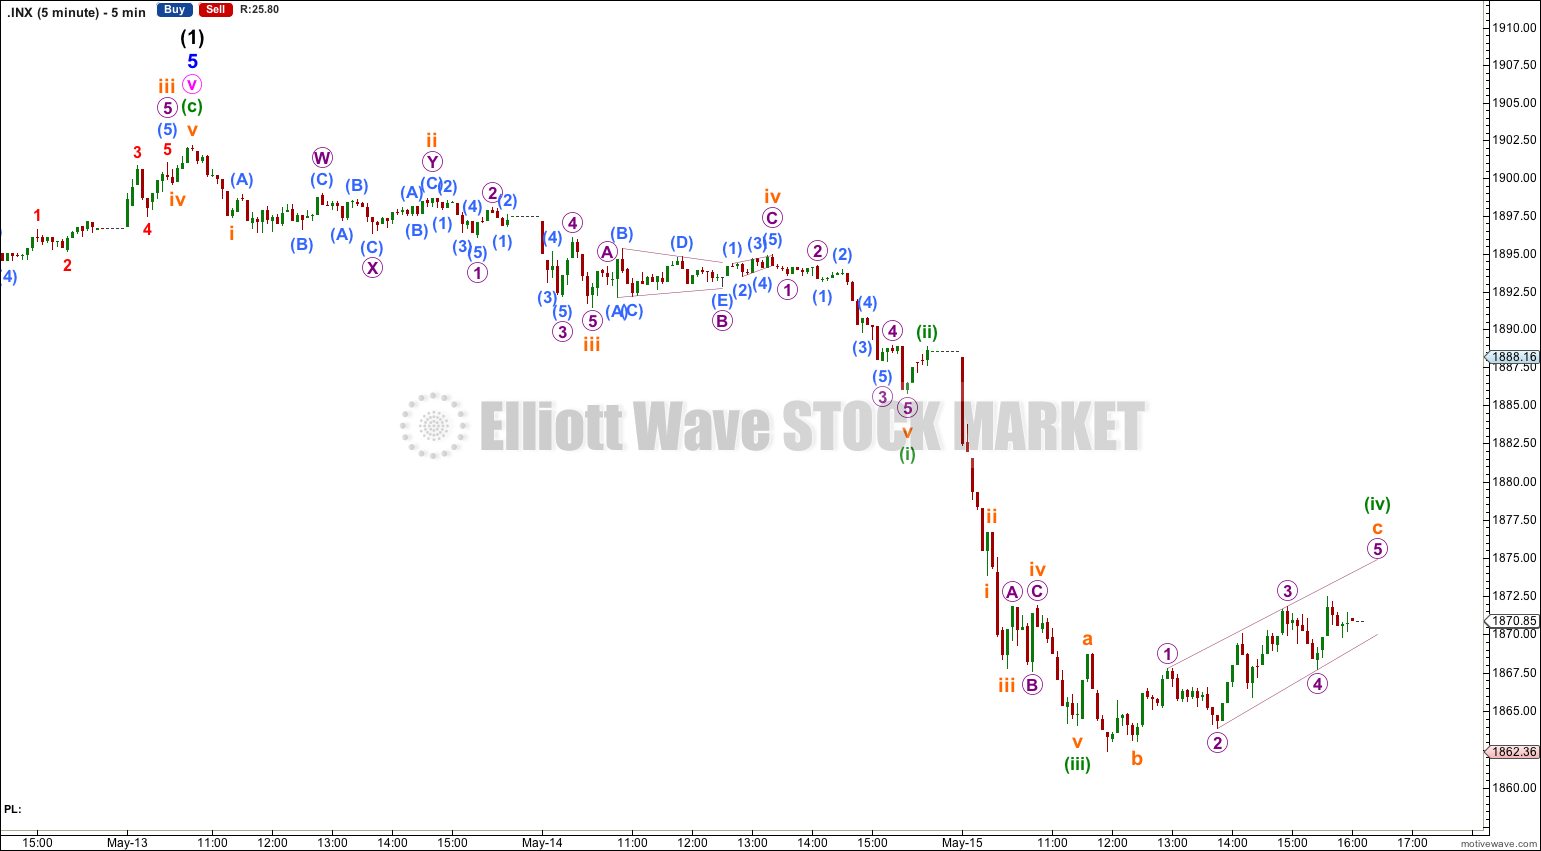
Downwards movement below 1,867.02 invalidated yesterday’s hourly wave count. This cannot be a second wave correction within minuette wave (c) and so minuette wave (c) must be over, even though price did not reach the upper pink channel.
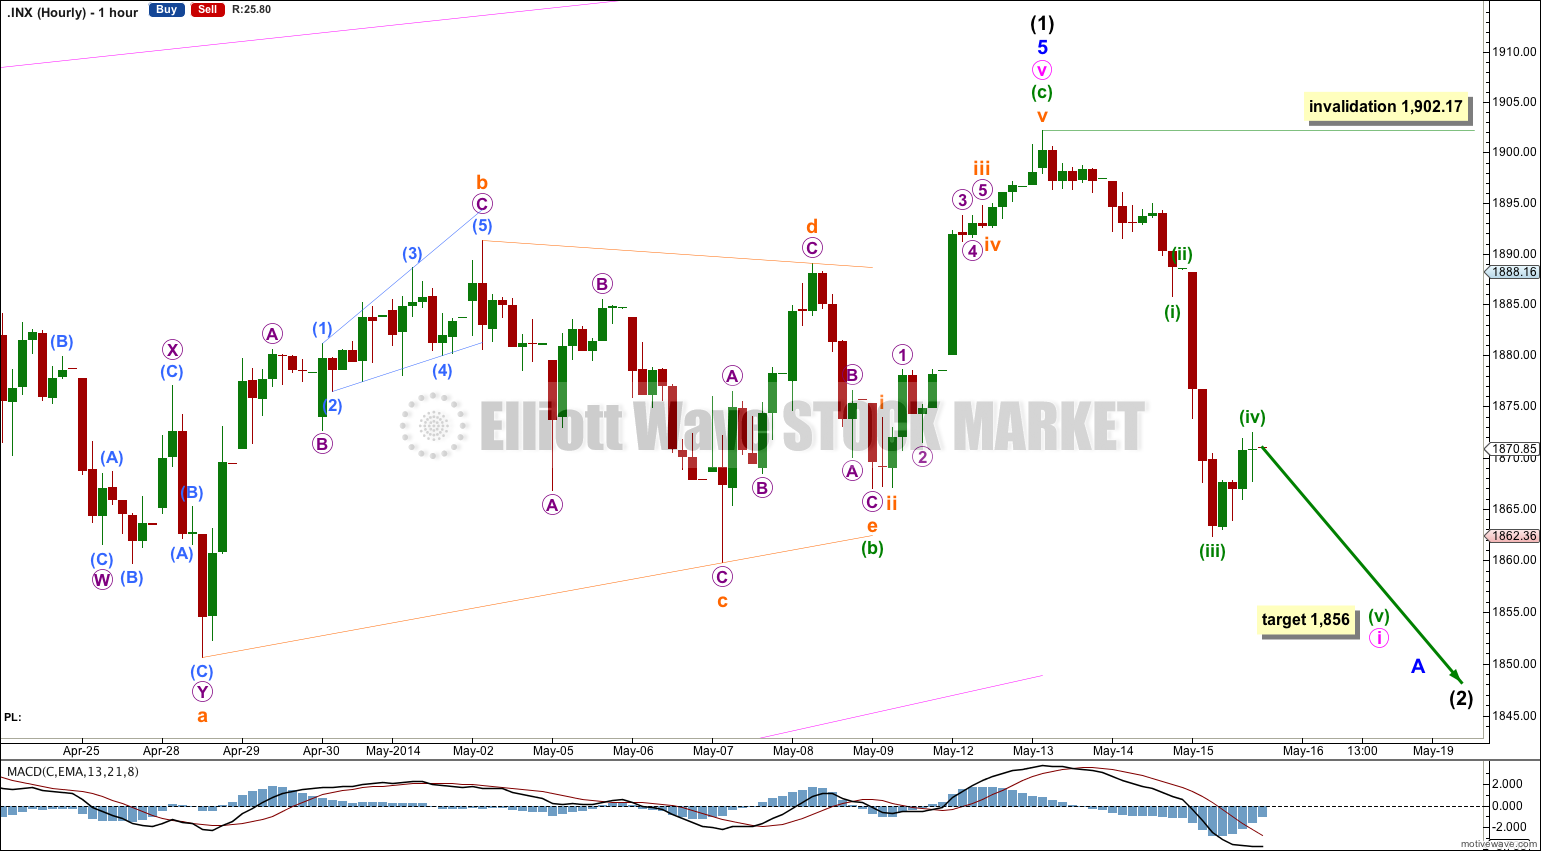
Downwards movement for Thursday’s session is a very clear third wave down. The upwards movement at the end of the session is most likely a fourth wave, which may be complete or may move a little higher. If the fifth wave begins here then at 1,856 it would reach equality in length with the first wave.
Minuette wave (iii) is just 0.37 short of 1.618 the length of minuette wave (i).
The following second wave correction for minute wave ii may not move beyond the start of minute wave i above 1,902.17.
In the short term I expect to see more downwards movement.
Bearish Alternate Wave Count.
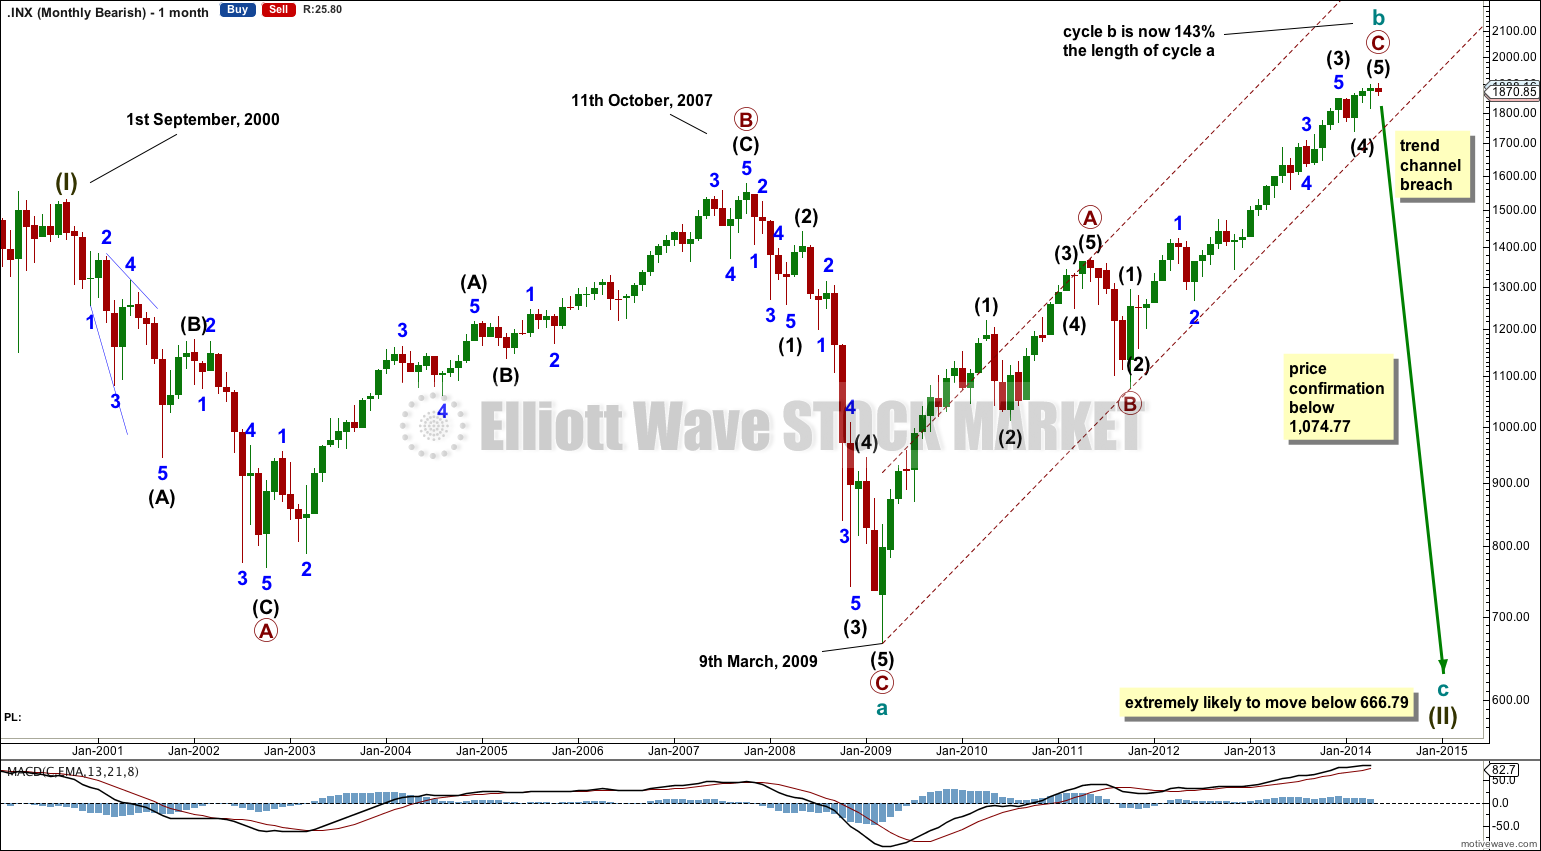
This bearish alternate wave count expects that the correction is not over. The flat correction which ended at 666.79 was only cycle wave a of a larger super cycle second wave correction.
Cycle wave b is now a 143% correction of cycle wave a, just a little longer than the maximum common length of 138% for a B wave of a flat correction.
Cycle wave b is now a complete zigzag structure.
A clear breach of the large maroon – – – channel on the monthly and weekly charts is required for confirmation of this wave count. If that happens then this would be my main wave count and would be strongly favoured. Only once this wave count is confirmed will I calculate downwards targets for cycle wave c for you; it would be premature to do that prior to confirmation.
We would have full and final price confirmation with movement below 1,074.77. But well before that point this would be my only wave count.
The subdivisions within primary wave C are seen as an impulse in the same way as the bullish wave count, so all the Fibonacci ratios are the same. The structure is now a complete five wave impulse with an ending contracting diagonal for the final fifth wave.
A-B-C and 1-2-3 subdivide in exactly the same way. The only way to decide which labeling is correct at this stage is to look at momentum and channels.
Momentum has increased for primary wave C beyond that seen for primary wave A. This fits both wave counts; a third wave should always show stronger momentum than a first wave, and C waves often show stronger momentum. Unfortunately, momentum cannot eliminate either wave count at this stage.
The maroon channel indicates that this bearish wave count may actually be more correct. For the bullish wave count upwards movement should have breached the upper edge of this channel by now. The fact that it has not places some doubt on the larger bullish picture and that is why I continue to consider this bearish alternate.
Only if this maroon channel is breached to the downside would this bearish wave count be confirmed.
Within cycle wave c no second wave correction may move beyond the start of its first wave above 1,902.17.
A clear breach of the lower aqua blue trend line would provide a strong indication that this bearish wave count may be correct.
A clear breach of the lower edge of the maroon – – – channel would confirm it.
Cycle wave c should move substantially below the end of cycle wave a below 666.79.