
Price began Wednesday’s session with a little lower movement, then turned higher, exactly as expected. Both the main and alternate hourly wave counts remain valid.
Summary: If price remains below 1,891.33 then we may expect the S&P 500 remains range bound. Once price clearly breaks above this level the target is 1,921.
This analysis is published about 08:20 p.m. EST. Click on charts to enlarge.
Bullish Wave Count.
The aqua blue trend lines are critical. Draw the first trend line from the low of 1,158.66 on 25th November, 2011 to the next swing low at 1,266.74 on 4th June, 2012. Create a parallel copy and place it on the low at 1,560.33 on 24th June, 2013. While price remains above the lower of these two aqua blue trend lines we must assume the trend remains upwards. This is the main reason for the bullish wave count being my main wave count.
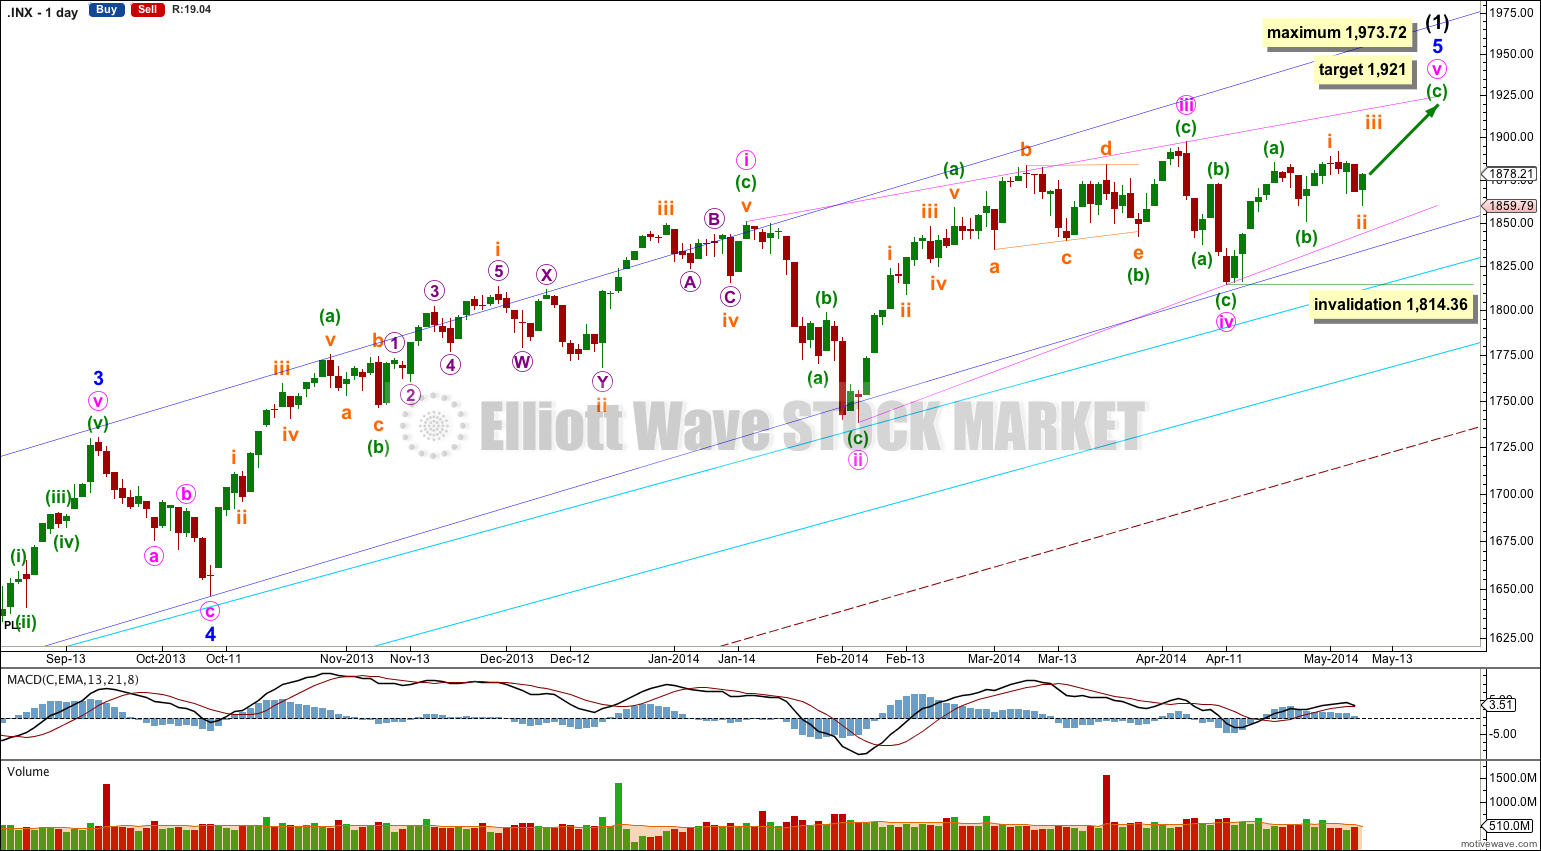
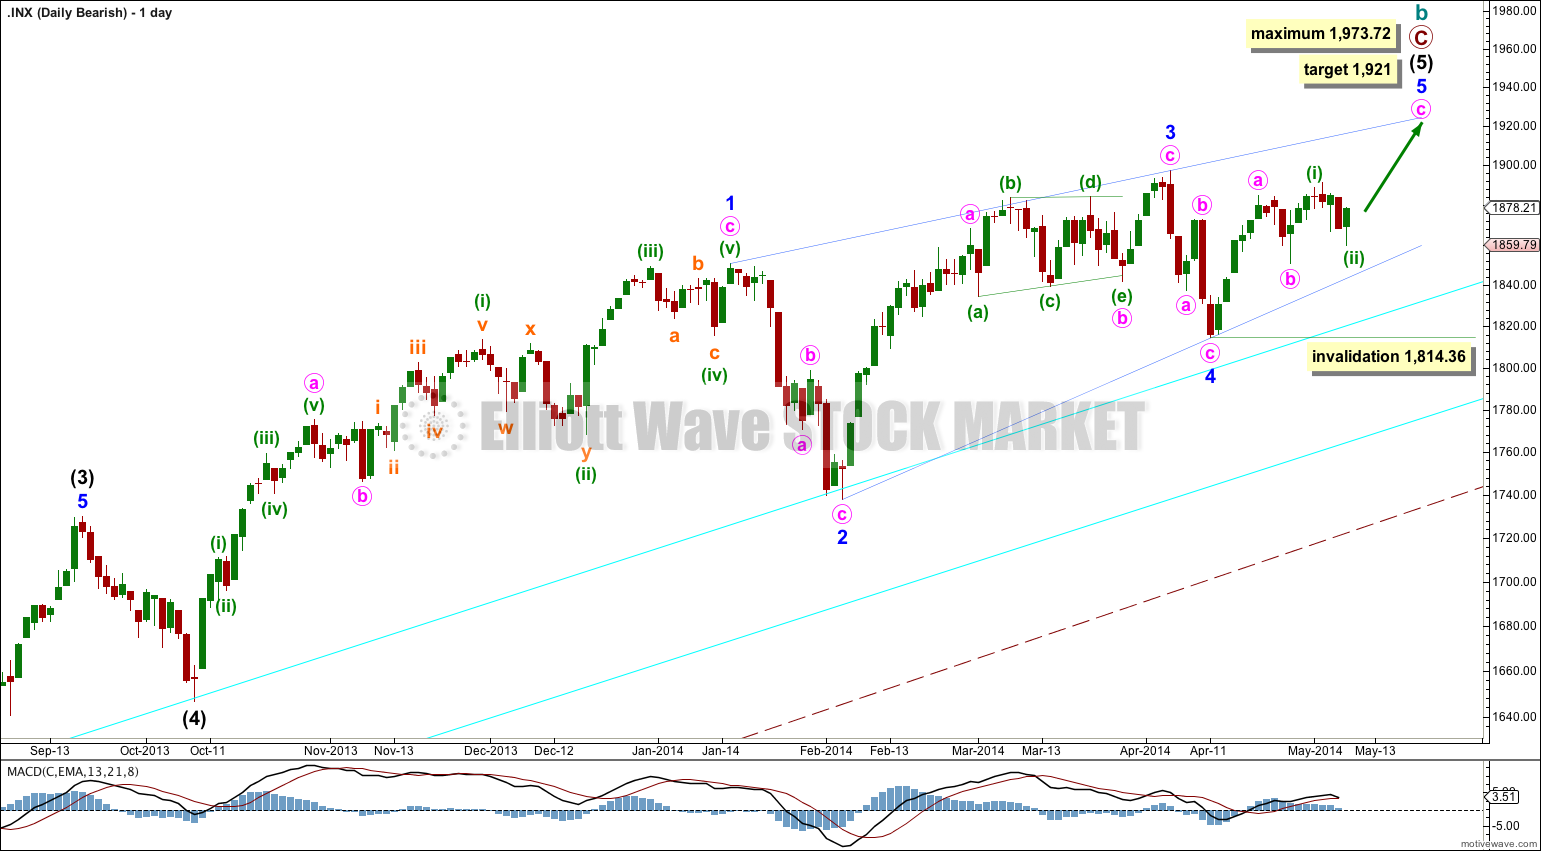
This bullish wave count expects a new bull market began at 666.79 for a cycle wave V. Within cycle wave V primary waves 1 and 2 are complete. Within primary wave 3 intermediate wave (1) is incomplete.
Within intermediate wave (1) the final fifth wave of minor wave 5 is an almost complete ending contracting diagonal. Although minute waves ii and iv within the diagonal are shallower than normal, all the subdivisions fit perfectly. The diagonal is contracting and the final fifth wave may not be longer than equality with the third at 1,973.72.
Within an ending diagonal all the subwaves may only subdivide as single zigzags. The fourth wave should overlap back into first wave price territory. Within the zigzag of minute wave v minuette wave (c) would reach equality in length with minuette wave (a) at 1,921. Minute wave v should end when price comes to touch the upper 1-3 trend line of the diagonal.
Within the zigzag of minute wave v minuette wave (b) may not move beyond the start of minuette wave (a) at 1,814.36.
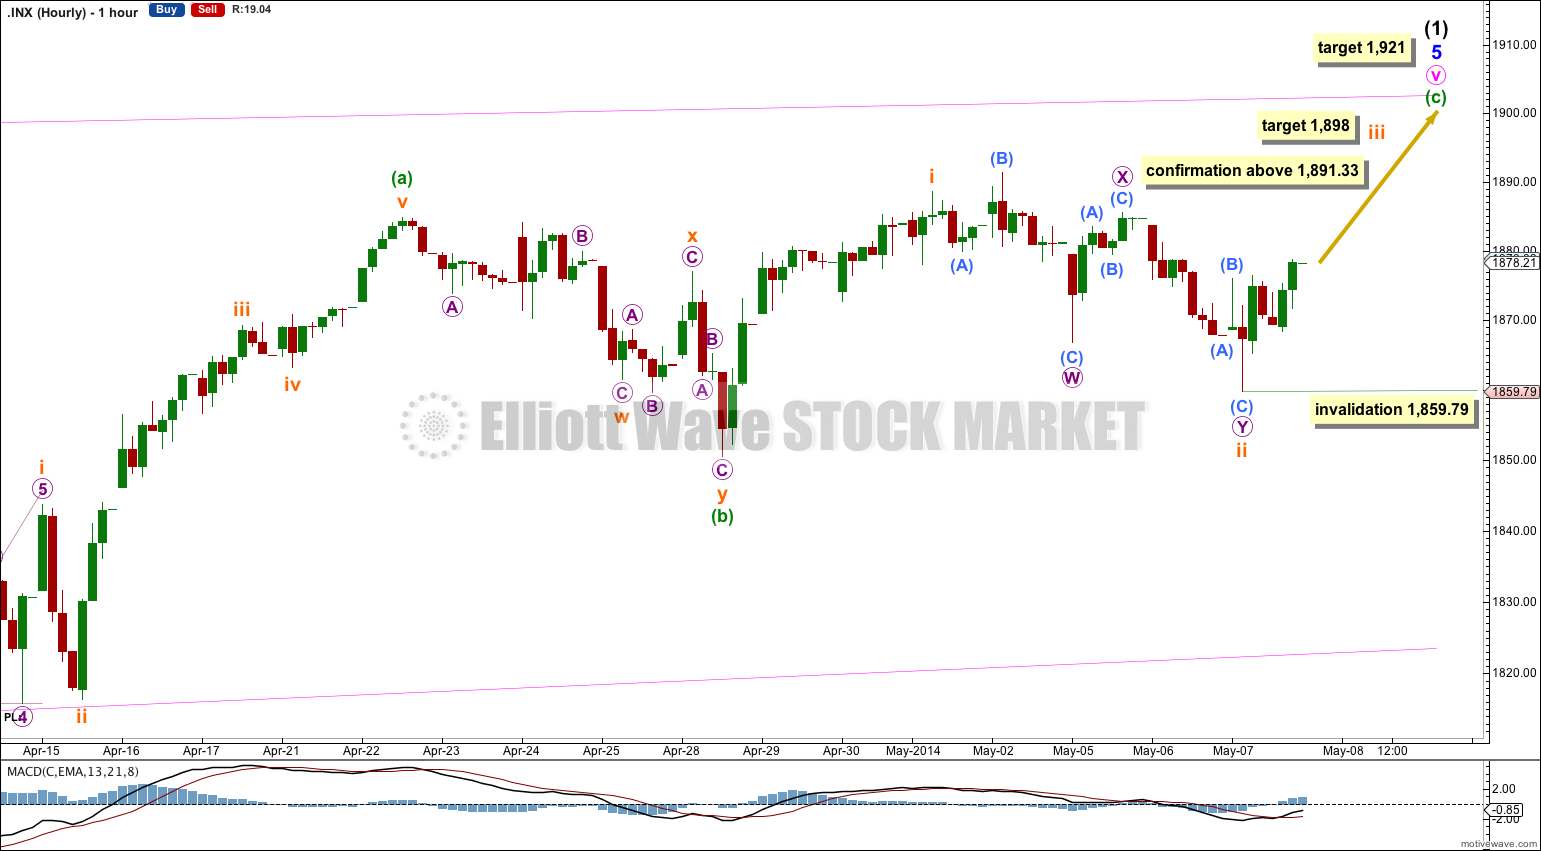
The small second wave correction of subminuette wave ii is now complete. It subdivides as a double combination: flat – X – zigzag.
This main wave count expects that a third wave has begun. If this is correct then tomorrow price should move comfortably above 1,891.33 and show an increase in upwards momentum. If this does not happen tomorrow then I would swap this main hourly wave count over with the alternate below.
At 1,898 subminuette wave iii would reach equality in length with subminuette wave i.
Within subminuette wave iii no second wave correction may move beyond its start below 1,859.79.
Alternate Hourly Wave Count.
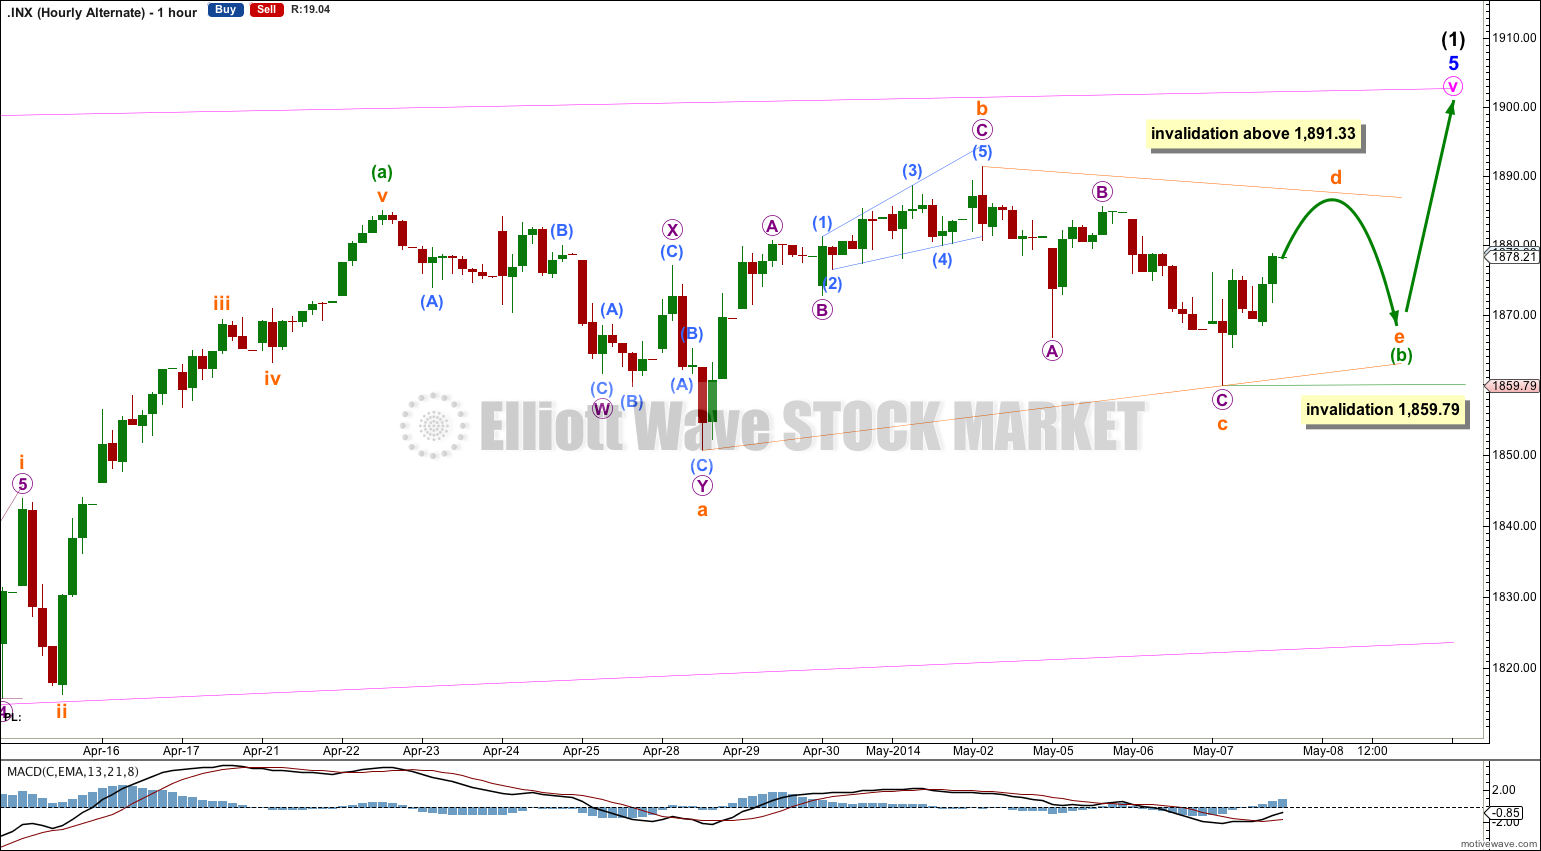
It is still possible that minuette wave (b) is an incomplete running contracting or running barrier triangle. This alternate wave count expects more sideways movement, in an ever decreasing range, for another two or three days.
Within a contracting triangle subminuette wave d may not move beyond the end of subminuette wave b at 1,891.33.
Within a barrier triangle subminuette wave d should end about the same level as subminuette wave b at 1,891.33, as long as the B-D trend line is essentially flat. In practice what this means is subminuette wave d can move very slightly above 1,891.33 and the wave count would remain valid. Unfortunately, this invalidation point is not black and white (his is the only Elliott wave rule with any grey area).
Within both a contracting and barrier triangle subminuette wave e may not move beyond the end of subminuette wave c below 1,859.79. Subminuette wave e is most likely to end short of the A-C trend line. If it does not fall short of this line then it may (less likely) overshoot it.
Bearish Alternate Wave Count.
This bearish wave count expects that the correction was not over at 666.79, and that may have been just cycle wave a of a huge expanded flat for a super cycle wave II. Cycle wave b upwards is a close to complete zigzag.
Within flat corrections the maximum common length of B waves in relation to A waves is 138%. So far cycle wave b is a 141% correction of cycle wave a. For this reason also this wave count is an alternate.
Within primary wave C the subdivisions are seen here in exactly the same way as the main wave count, both are seen as incomplete five wave impulses with the final fifth wave an almost complete ending contracting diagonal. This bearish wave count would expect a cycle degree trend change to come in about three days.
Alternatively, it is possible that primary wave C is not close to completion. There are several ways to see the many subdivisions within this long movement. The depth of the next downwards correction will tell us what degree the trend change may be: if downwards movement breaches the lower of the two aqua blue trend lines by more than 3% of market value then I would consider a trend change at cycle degree, and if downwards movement breaches the lower edge of the wider maroon – – – channel on the monthly chart then a cycle degree trend change would be confirmed.