
Upwards movement continues as expected. The short term target is 6,853. The target for upwards movement to end remains at 7,345.
Movement above 6,865.86 would provide full and final confidence that the intermediate degree trend is up.
Click on charts to enlarge.
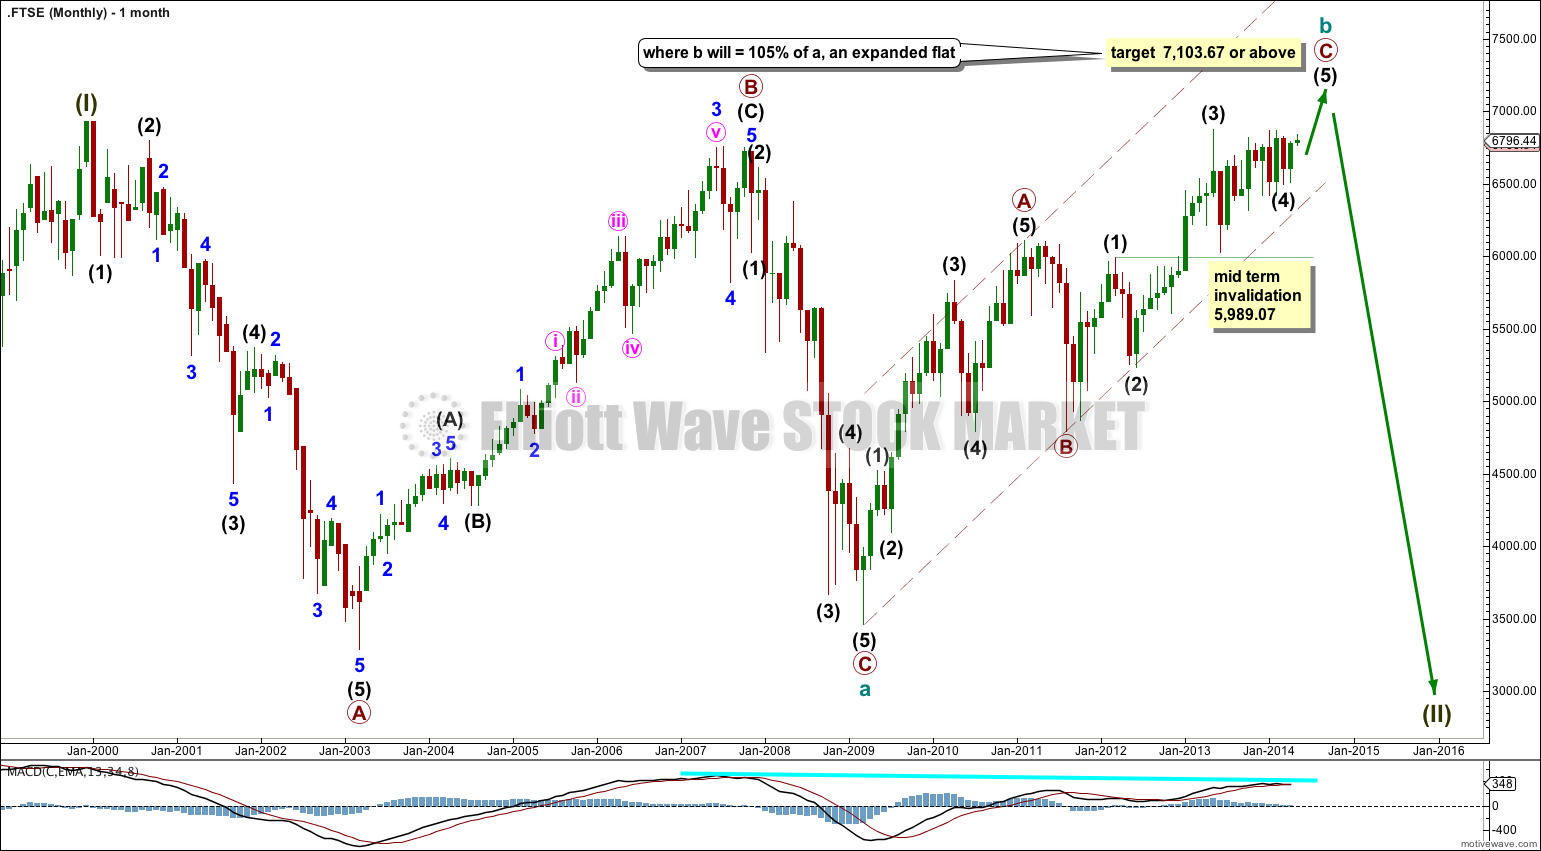
This main wave count expects that FTSE remains within a huge super cycle expanded flat correction. My alternate idea would be more in line with my bullish main wave count for the S&P 500: the FTSE may have ended its correction at 3,460.71 in March 2009 and that may be where a new bull market began.
The subdivisions and expectations for the mid term are the same for both ideas and so I will publish only one at this stage. When the next intermediate degree wave upwards is complete then I would use the lower edge of the maroon channel to differentiate between a long term bullish and bearish outlook. A bull market should breach the upper edge of this maroon channel, and it may not breach the lower edge. A bear market should breach the lower edge of this maroon channel.
If this upwards movement is a zigzag for a cycle degree b wave then it is incomplete. At 7,103.67 or above cycle wave b would reach 105% the length of cycle wave a. This would see the flat an expanded flat which is the most common type, and so movement above this point is reasonably likely.
In the mid term if we see more downwards movement then intermediate wave (4) may not move into intermediate wave (1) price territory. This wave count is invalidated with movement below 5,989.07.
Intermediate wave (4) may have ended as a running barrier triangle with the B-D trend line essentially flat.
Following a barrier triangle in a fourth wave position the fifth wave is often either a short sharp movement, or an exceptionally long extension. A long extended fifth wave would be less likely in this case as that would make cycle wave b longer than the maximum common length of 138% the length of cycle wave a (cycle waves seen on the monthly chart). So a short sharp fifth wave (relative to intermediate waves (1) and (3)) is more likely.
At 7,345 intermediate wave (5) would reach equality with the widest part of the triangle.
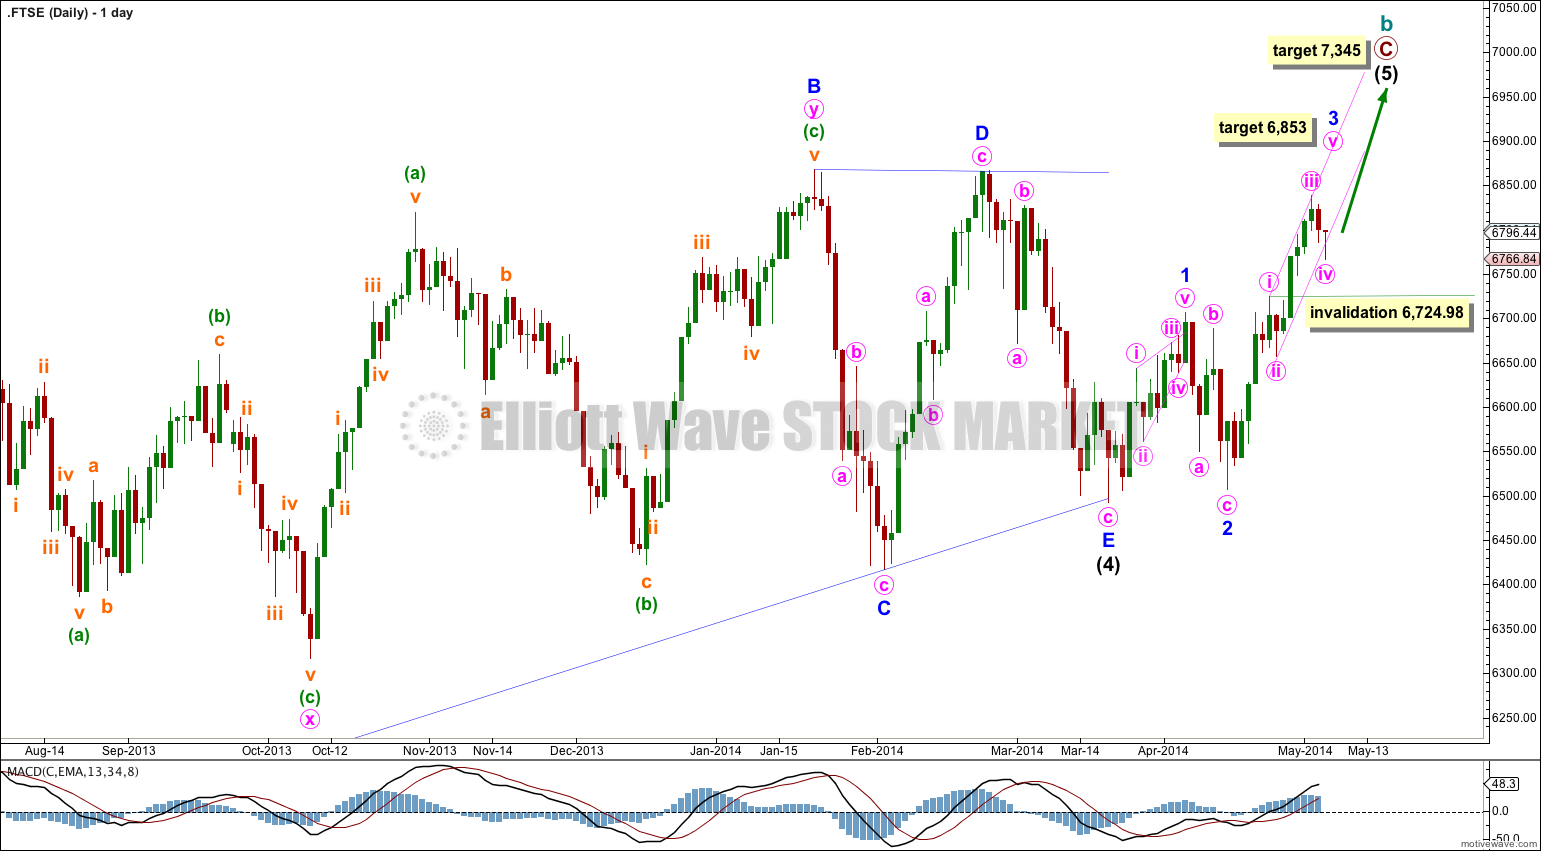
A new high above the end of minor wave D of the triangle at 6,865.86 would confirm that the triangle is over and intermediate wave (5) is underway.
So far within intermediate wave (5) minor wave 1 subdivides as a leading contracting diagonal, and minor wave 2 as a deep zigzag. Following leading diagonals in first wave positions second waves are normally very deep, so this wave count has a typical look.
At 6,853 minor wave 3 would reach 1.618 the length of minor wave 1.
Within minor wave 3 minute wave iv may not move into minute wave i price territory. When minor wave 3 is completed (as soon as a new high above 6,838.17 is seen then minor wave 3 could be complete) then the invalidation point must move to the high of minor wave 1 at 6,706.34. Minor wave 4 may not move into minor wave 1 price territory.
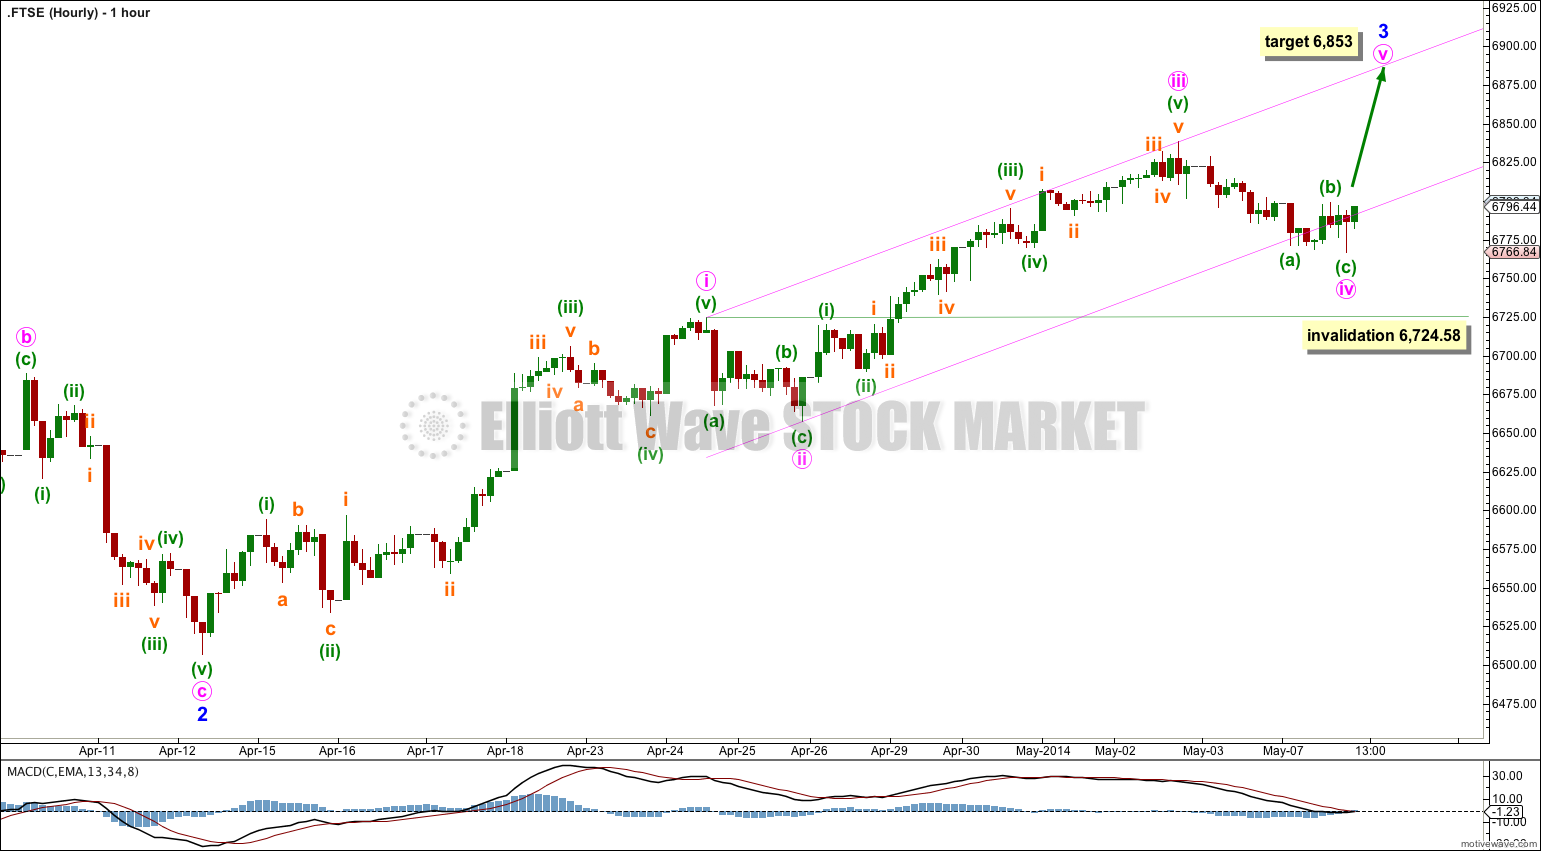
Minor wave 3 is unfolding as a typical looking impulse, so far.
It may be as labeled here, or minute wave iii may be incomplete and may extend higher. That would fit better with momentum.
Minute wave iv may not move into minute wave i price territory below 6,724.58.