
Downwards movement was expected. The wave count looks correct. At this stage I cannot calculate a target for this movement to end. I will use the lower of the double aqua blue trend lines on the daily chart as a guideline.
Summary: Movement below 1,842.11 has provided confidence that the trend is down at minor degree. Downwards movement should continue overall for about three or four weeks in total, with corrections along the way.
This analysis is published about 09:35 p.m. EST. Click on charts to enlarge.
Bullish Wave Count.
The aqua blue trend lines are critical for all wave counts. Draw the first trend line from the low of 1,158.66 on 25th November, 2011 to the next swing low at 1,266.74 on 4th June, 2012. Create a parallel copy and place it on the low at 1,560.33 on 24th June, 2013. While price remains above the lower of these two aqua blue trend lines we must assume the trend remains upwards. This is the main reason for the bullish wave count being my main wave count.
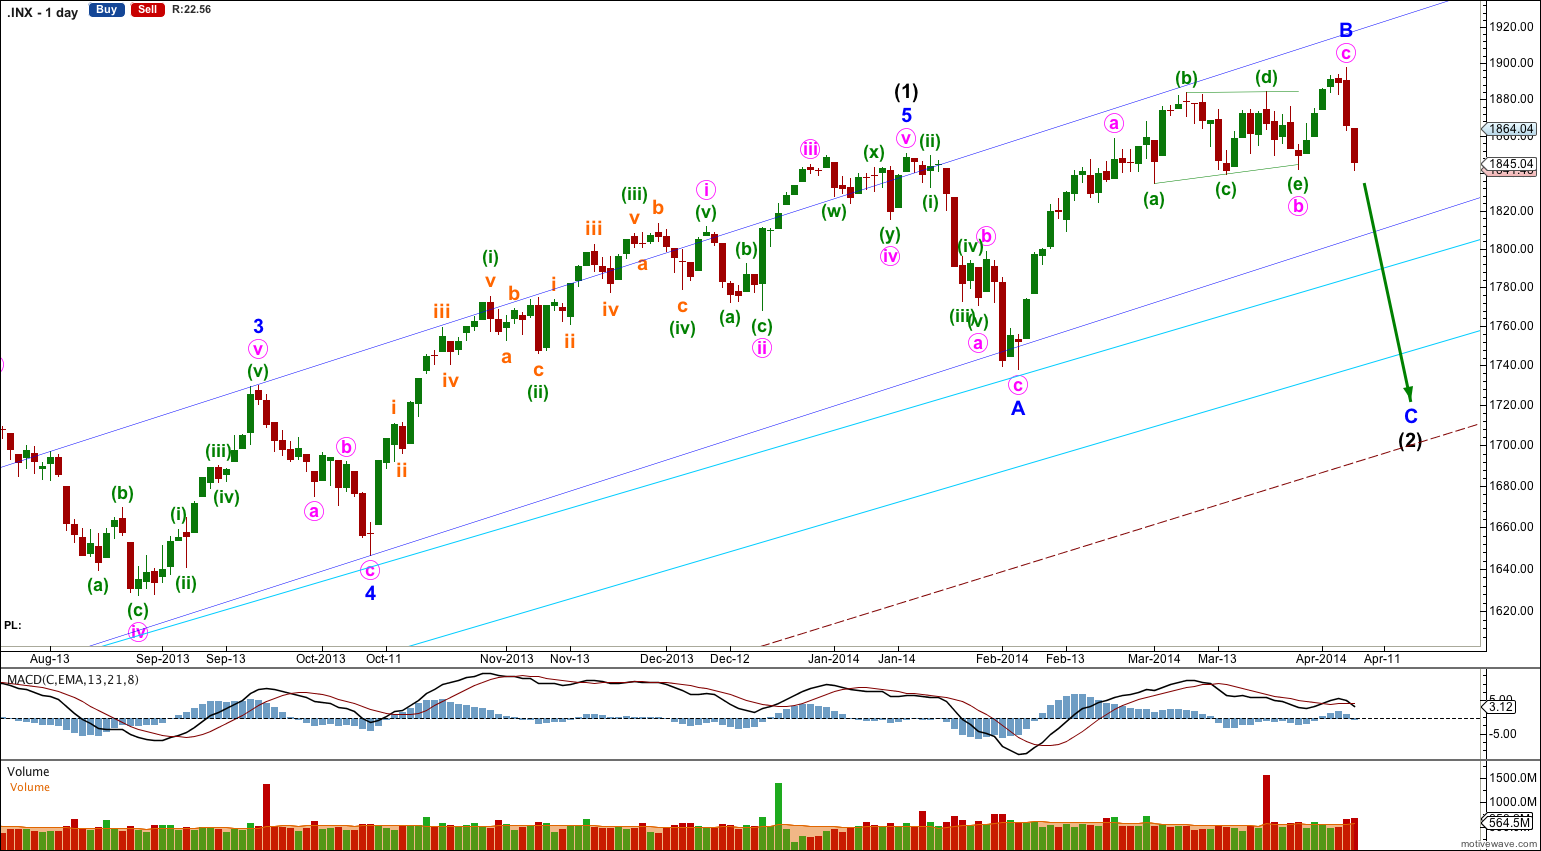
This bullish wave count expects a new bull market began at 666.79 for a cycle wave V. Within cycle wave V primary waves 1 and 2 are complete. Within primary wave 3 intermediate wave (1) is complete at 1,850.84.
Intermediate wave (2) is unlikely to be over at the low of minor wave A for three main reasons:
1. It would be a remarkably brief correction for intermediate degree, lasting only 14 days.
2. Intermediate wave (2) would have not breached the channel containing intermediate wave (1) (dark blue trend channel) which would be very unusual.
3. If the new upwards movement is the start of a third wave it would have to be labeled as a series of overlapping first and second waves where I have a triangle labeled (a triangle cannot be in the position of a second wave). This requires two successive second waves which would have breached the base channels of the first and second waves one degree higher. This would be extremely unusual and such a wave count should be discarded, which I have.
Intermediate wave (2) is continuing as an expanded flat correction.
There is divergence at the daily chart level with price trending higher to complete minor wave B while MACD trends lower. This divergence supports the wave count.
Intermediate wave (2) should find support about the lower of the two aqua blue trend lines.
Intermediate wave (2) is most likely an expanded flat. Downwards movement for minor wave C is highly likely to make a new low below the end of minor wave A at 1,737.92 to avoid a truncation and a rare running flat. This would see the lower of the double aqua blue trend lines breached by an overshoot. In this instance I will apply the classic technical analysis guideline of allowing for a breach of up to 3% of market value. If downwards movement continues beyond this point the wave count would be in doubt and a huge trend change would be indicated.
There is some precedent for a small breach of the lower aqua blue trend line: in November 2012 it was breached by 1.5% of market value. Small overshoots like this can happen.
For this bullish wave count when intermediate wave (2) is complete then very strong sustained upwards movement would be expected as an intermediate degree third wave within a primary degree third wave upwards unfolds.
I do not have a target for minor wave C downwards for you. If it were to reach 1.618 the length of minor wave A then downwards movement would breach the lower aqua blue trend line by more than 3%. If this wave count is correct then that should not happen. We may not see a ratio between minor waves A and C, which is not unusual for the S&P.
When I know where minute waves iii and iv within minor wave C have ended then I will use the ratios within minor wave C between minute waves i, iii and v to calculate a target for it to end. I will only be able to do this for you towards the end of the movement.
I would expect minor wave C downwards to last for about three to four weeks.
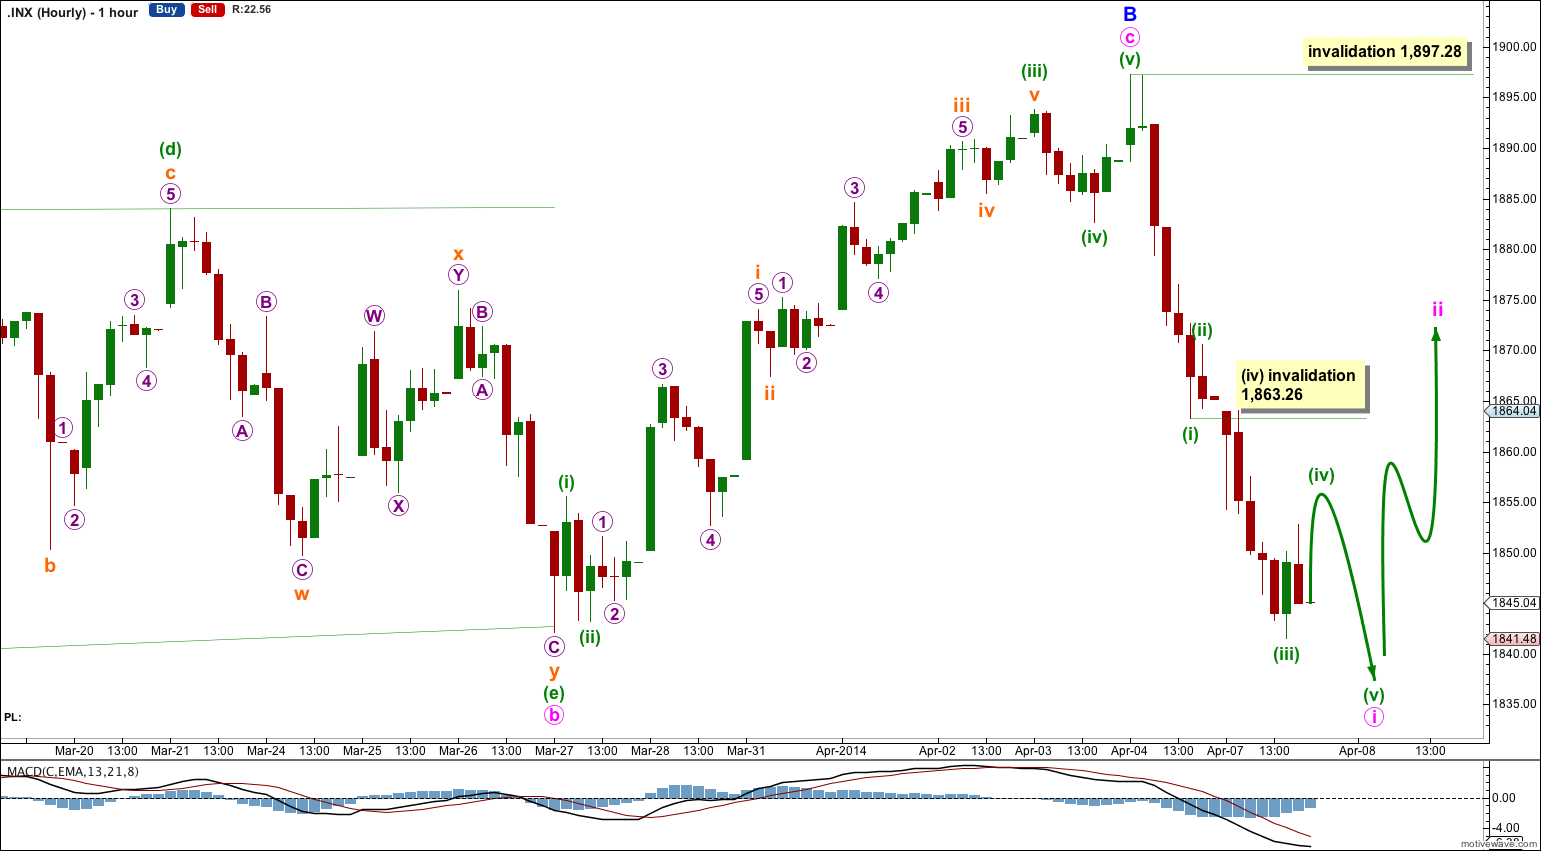
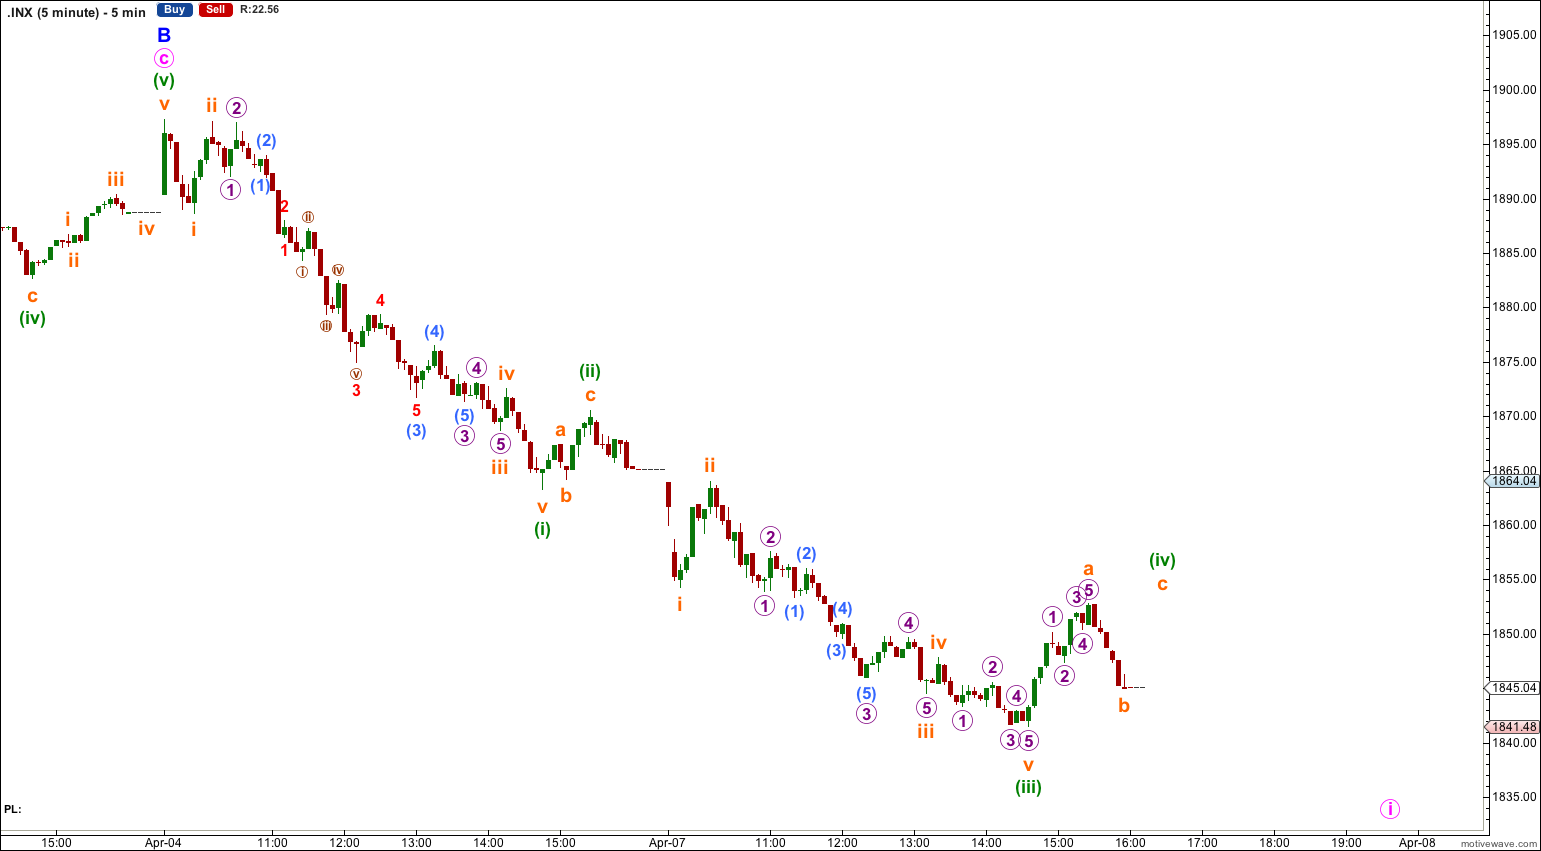
On the five minute chart it looks like minute wave i may be nearing completion, and within it minuette wave (iv) may be incomplete. We may see a little upwards movement at the beginning of tomorrow’s session to end minuette wave (iv). It may not move into minuette wave (i) price territory above 1,863.26.
Minuette wave (v) downwards may be a maximum length of 29.09 points, and is likely to be above 18 points to be 0.618 the length of minuette wave (iii).
When minuette wave (v) downwards is complete then minute wave i will be a complete impulse. I would expect a little upwards movement for minute wave ii to follow this and it should show up on the daily chart as at least one green candlestick.
Minute wave ii may not move beyond the start of minute wave i. This wave count is invalidated with movement above 1,897.28.
Bearish Alternate Wave Count.
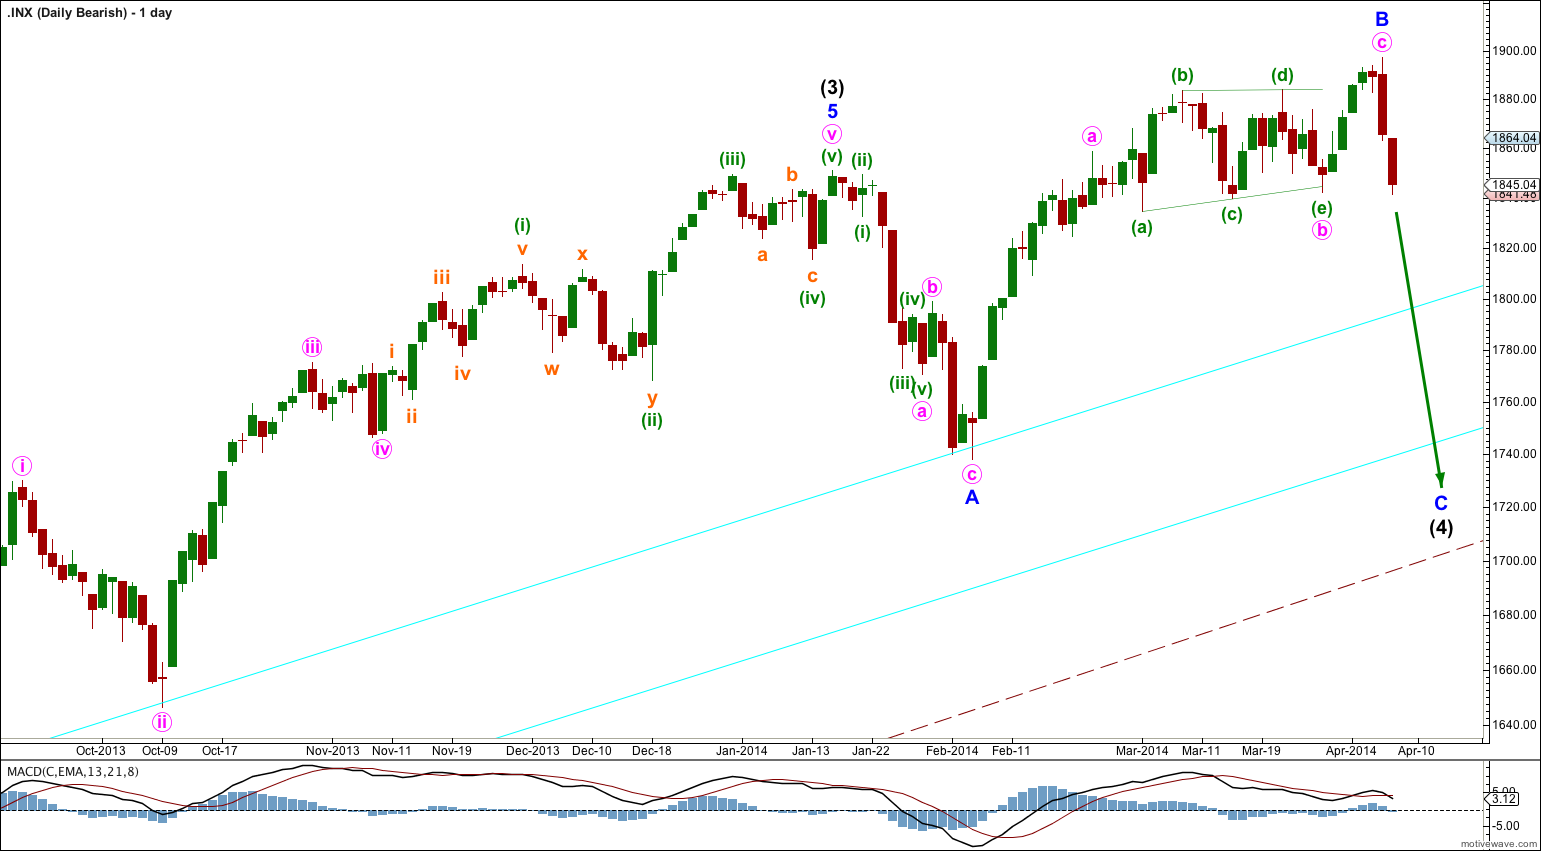
This bearish wave count expects that the correction was not over at 666.79, and that may have been just cycle wave a of a huge expanded flat for a super cycle wave II. Cycle wave b upwards is a close to complete zigzag.
Within flat corrections the maximum common length of B waves in relation to A waves is 138%. So far cycle wave b is a 141% correction of cycle wave a. For this reason only this wave count is an alternate.
Within primary wave C of the zigzag intermediate wave (4) would be incomplete.
The subdivisions for intermediate wave (4) would be the same as the main wave count for intermediate wave (2). I would expect it to end at the lower aqua blue trend line.
At 2,190 primary wave C would reach 1.618 the length of primary wave A. When intermediate wave (4) is complete I would recalculate this target at intermediate degree. I have found Fibonacci ratios between actionary waves (1, 3 and 5) of impulses are more reliable than between A and C waves within zigzags for the S&P500.
If intermediate wave (5) lasts about five to six months it may end about October this year.