
The short term target at 1,839 was almost met as price reached down to 1,841.86. Downwards momentum has increased nicely as expected.
The wave count remains the same.
Summary: The trend remains down at minor degree. We may see a further increase in momentum tomorrow. The short term target is at 1,829.
This analysis is published about 6:50 p.m. EST. Click on charts to enlarge.
Bullish Wave Count.
The aqua blue trend lines are critical for all wave counts. Draw the first trend line from the low of 1,158.66 on 25th November, 2011 to the next swing low at 1,266.74 on 4th June, 2012. Create a parallel copy and place it on the low at 1,560.33 on 24th June, 2013. While price remains above the lower of these two aqua blue trend lines we must assume the trend remains upwards. This is the main reason for the bullish wave count being my main wave count.
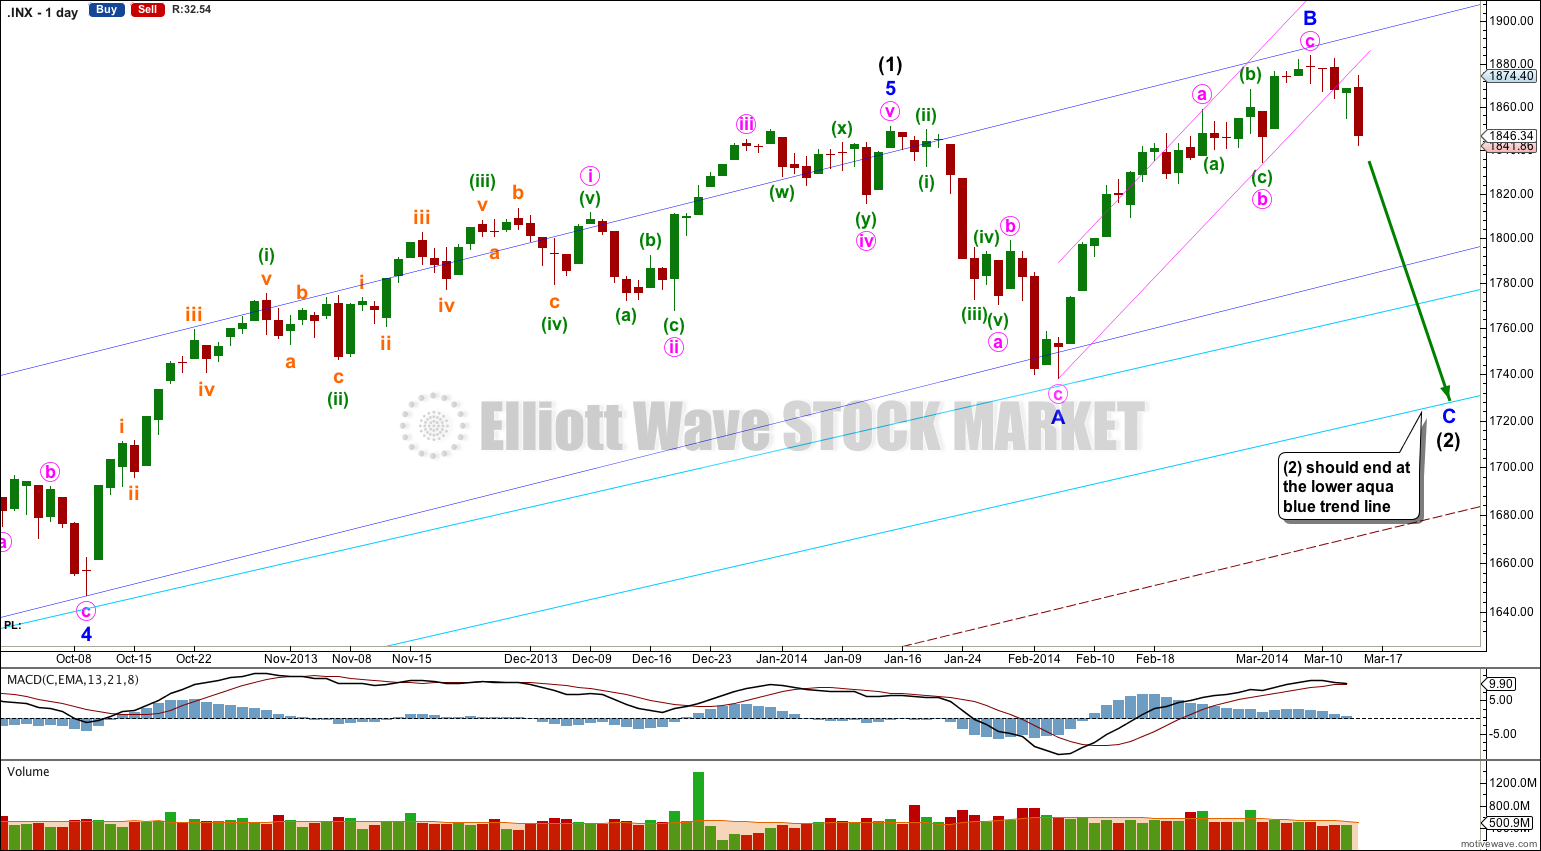
This bullish wave count expects a new bull market began at 666.79 for a cycle wave V. Within cycle wave V primary waves 1 and 2 are complete. Within primary wave 3 intermediate wave (1) is complete at 1,850.84. Intermediate wave (2) is continuing as an expanded flat correction.
Intermediate wave (2) should find strong support at the lower of the two aqua blue trend lines. Minor wave A lasted 14 days and minor wave B lasted a Fibonacci 21 days. I would expect minor wave C to be of a similar duration and to last about three to four weeks in total.
For this bullish wave count when intermediate wave (2) is complete then very strong sustained upwards movement would be expected as an intermediate degree third wave within a primary degree third wave upwards unfolds.
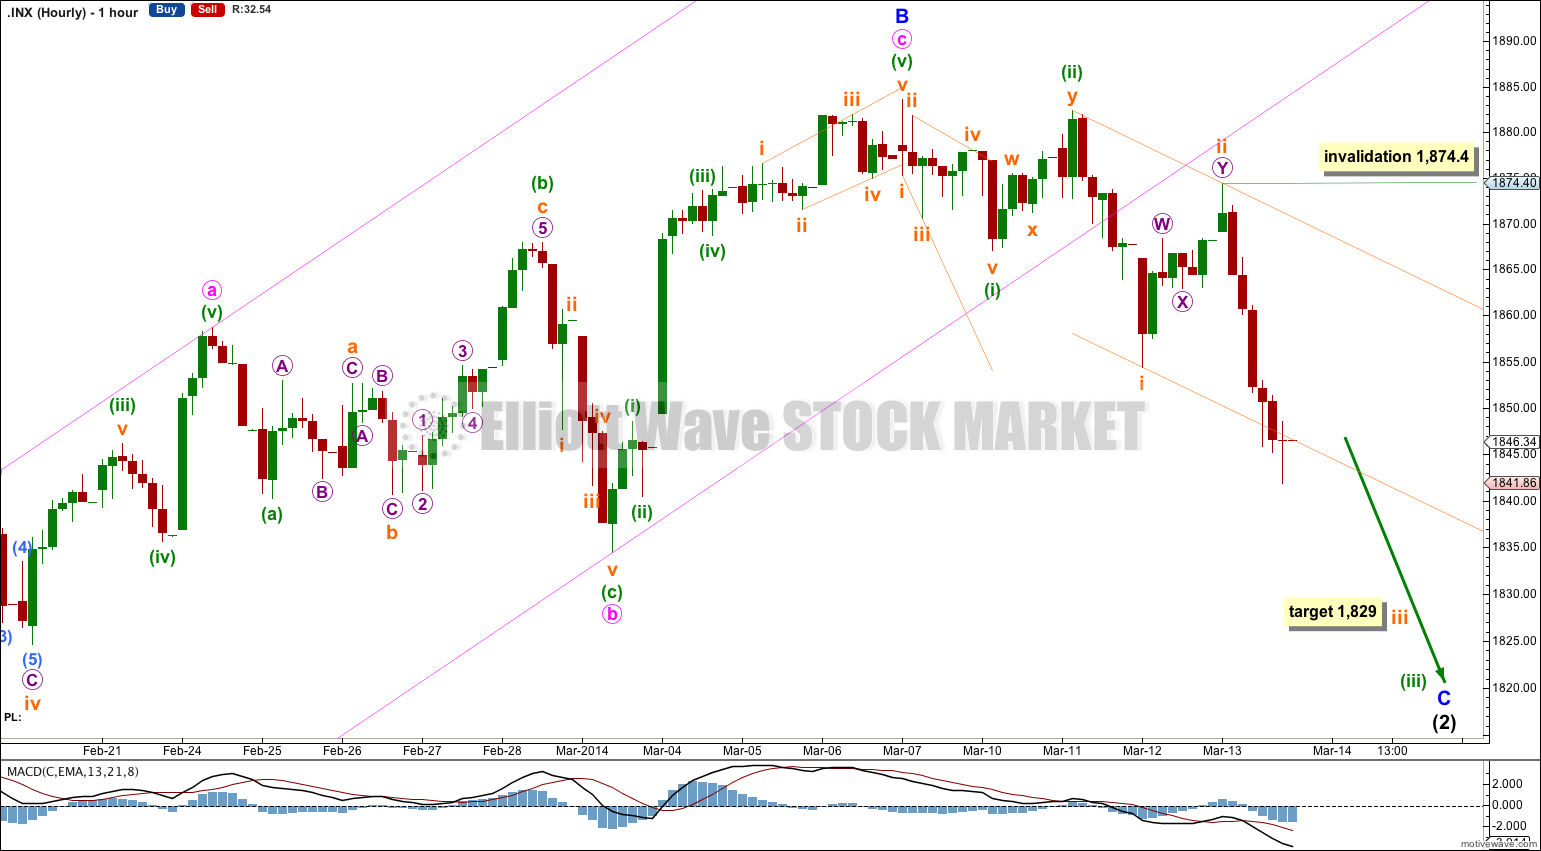
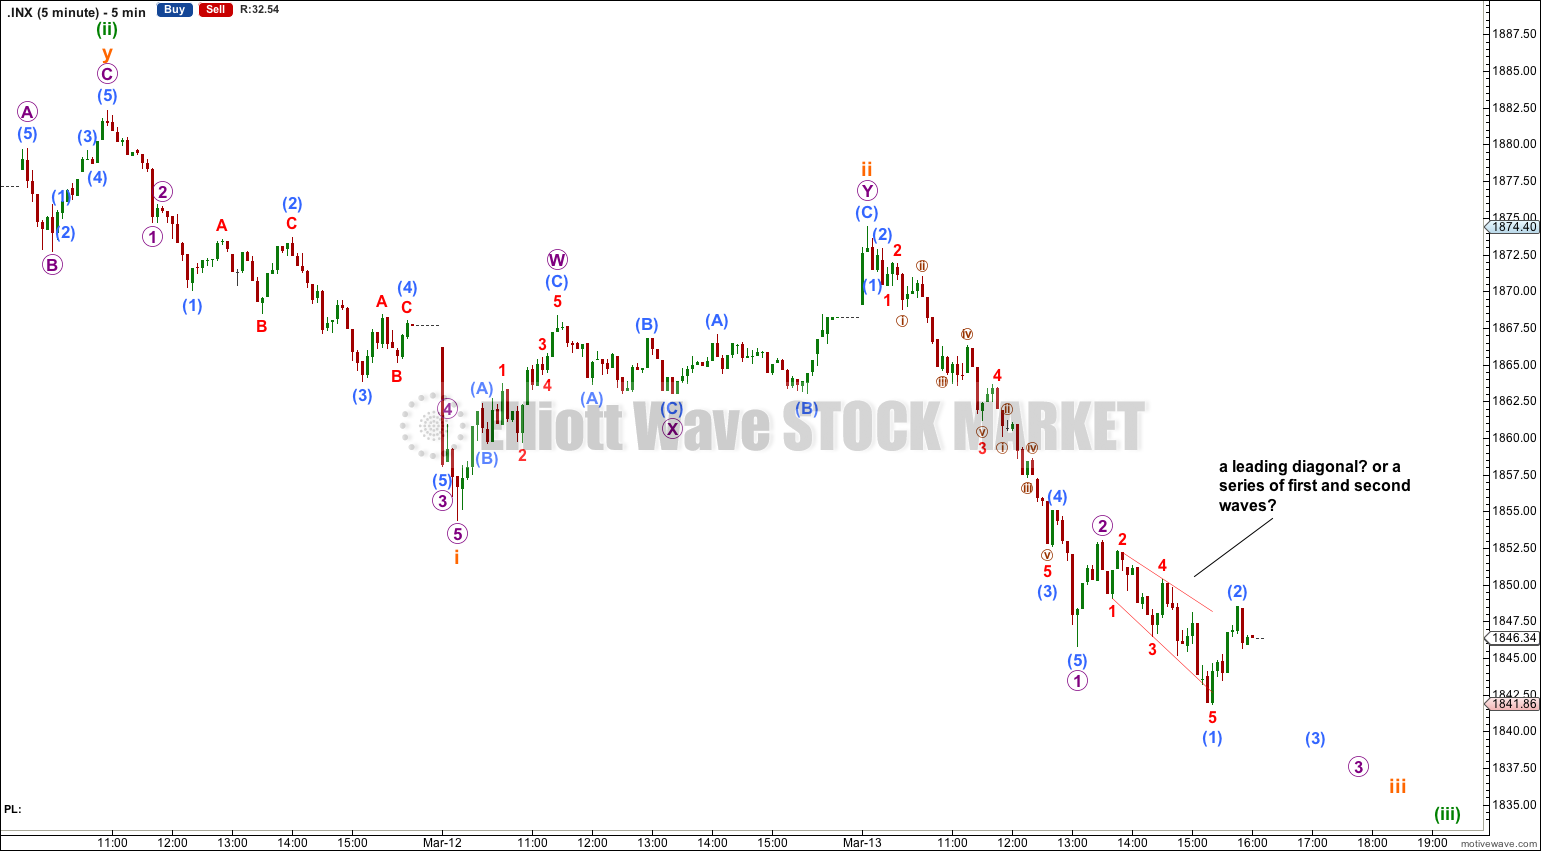
Downwards movement looks like a third wave unfolding as there is a clear increase in downwards momentum. I expect that this third wave is incomplete, and may even yet have to pass its middle (if my analysis of the five minute chart is correct today). We may see a further increase in downwards momentum tomorrow as the strongest middle of the third wave passes.
At 1,829 subminuette wave iii would reach 1.618 the length of subminuette wave i.
When subminuette waves iii and iv are complete I will calculate a target downwards for minuette wave (iii) for you. I cannot do that yet.
Within subminuette wave iii no second wave correction may move beyond the start of its first wave. At this stage the wave count is invalidated with movement above 1,874.40.
When subminuette wave iii is complete then the invalidation point may move down to the end of subminuette wave i at 1,854.38.
I have drawn a base channel about subminuette waves i and iii. This channel has been overshot. I would expect downwards movement tomorrow to clearly breach this channel because this is what third waves should do to base channels.
When subminuette wave iii is complete (maybe tomorrow) redraw the channel about this downwards movement using Elliott’s first technique: the first trend line from the ends of subminuette waves i to iii, then place a parallel copy upon the end of subminuette wave ii.
Along the way down any upwards corrections should find resistance at the upper edge of the base channel, if they even were to get up that high.
Bearish Alternate Wave Count.
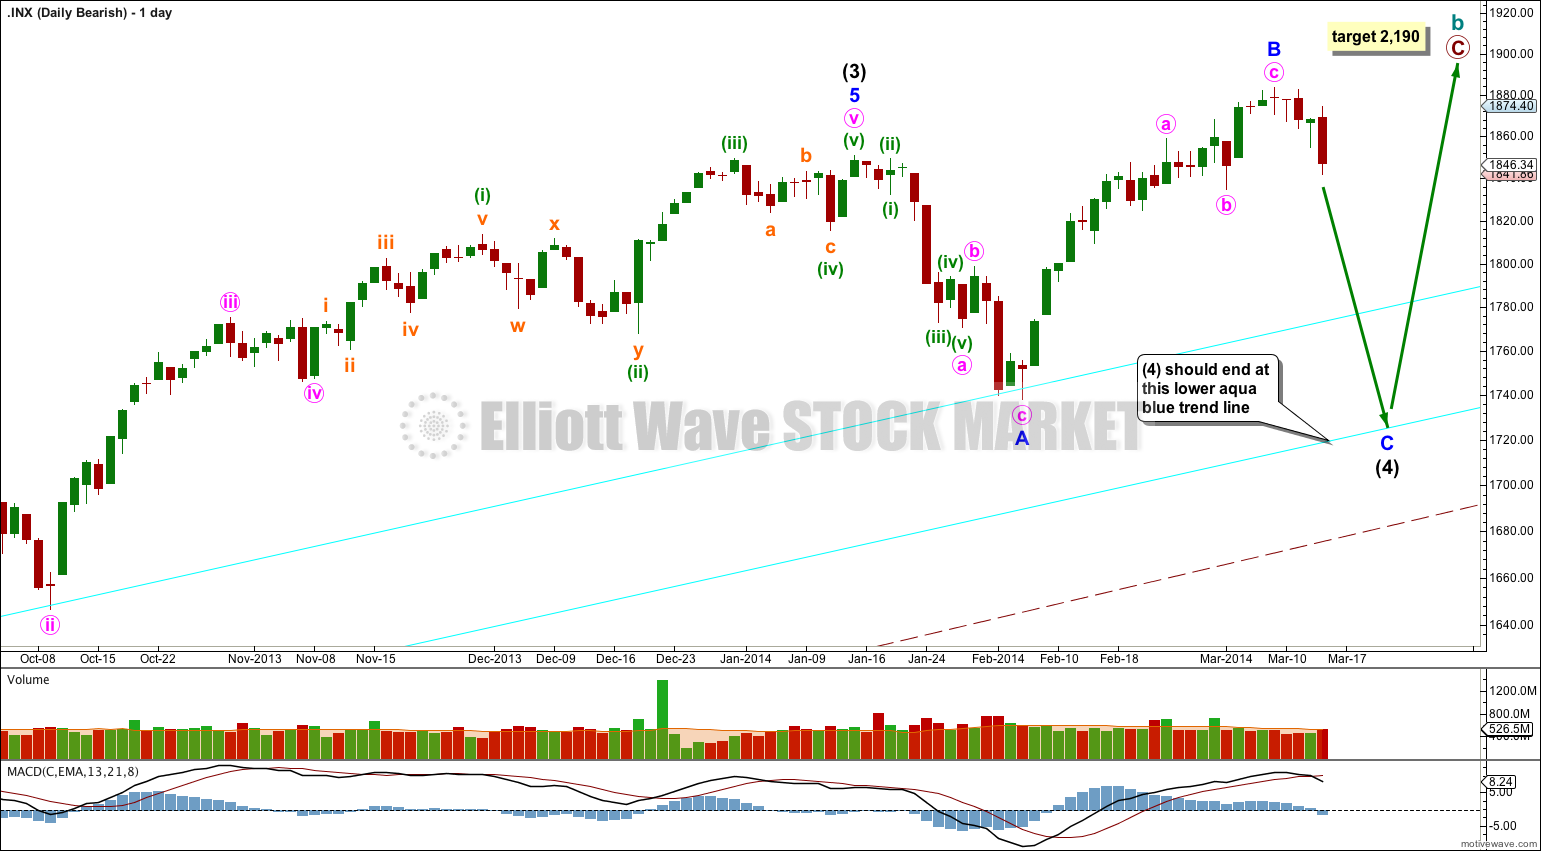
This bearish wave count expects that the correction was not over at 666.79, and that may have been just cycle wave a of a huge expanded flat for a super cycle wave II. Cycle wave b upwards is a close to complete zigzag.
Within flat corrections the maximum common length of B waves in relation to A waves is 138%. So far cycle wave b is a 141% correction of cycle wave a. For this reason only this wave count is an alternate.
Within primary wave C of the zigzag intermediate wave (4) would be incomplete.
The subdivisions for intermediate wave (4) would be the same as the main wave count for intermediate wave (2). I would expect it to end at the lower aqua blue trend line.
At 2,190 primary wave C would reach 1.618 the length of primary wave A. When intermediate wave (4) is complete I would recalculate this target at intermediate degree. I have found Fibonacci ratios between actionary waves (1, 3 and 5) of impulses are more reliable than between A and C waves within zigzags for the S&P500.
If intermediate wave (5) lasts about five to six months it may end about October this year.