
There is now a very clear channel breach on the daily chart with a full candlestick outside the channel. Despite upwards movement at the end of the session creating a green candlestick for Thursday the wave count remains the same and I have a little more confidence in it.
The wave count remains the same.
Summary: Minor wave 2 has ended. Minor wave 3 downwards should show an increase in downwards momentum. The target is 1,665 and may be three to four weeks away. The trend is down.
Click on the charts below to enlarge.
Main Bearish Wave Count.
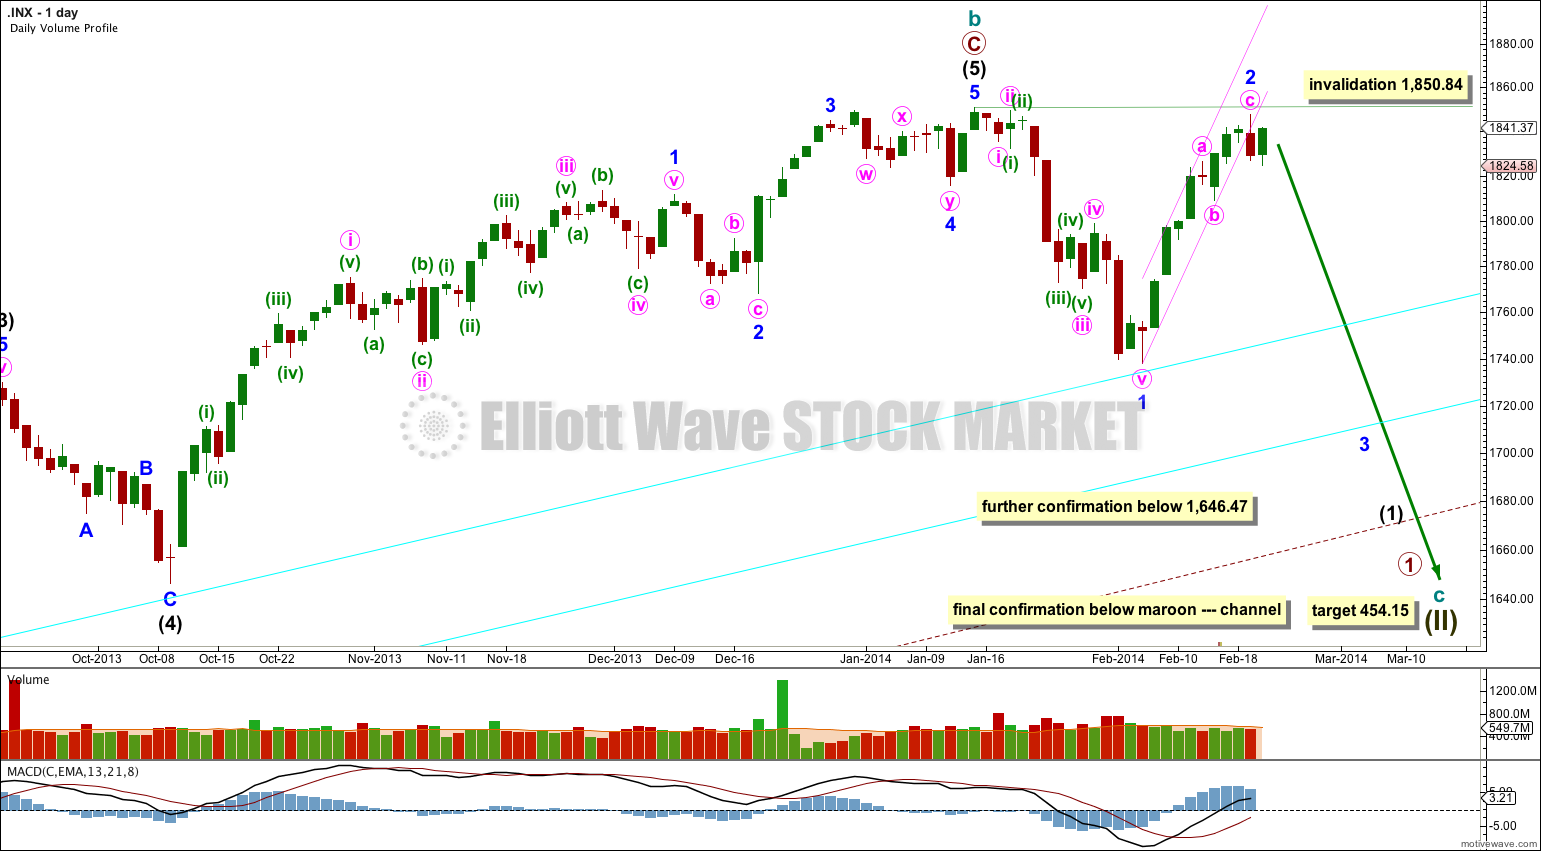
This wave count has a higher probability than the bullish alternate. Upwards movement over the last 4 years and 11 months subdivides best as a zigzag. If something is “off” about the supposed recovery then it must be a B wave because there is plenty that is off in this scenario in terms of social mood.
It is possible that cycle wave b is over and that there has been a trend change at cycle degree (bearish wave count) or intermediate wave degree (bullish alternate below). On the monthly chart there is a bearish engulfing candlestick pattern indicating a new bear market has just begun.
There is now a clear five down on the daily chart. This is indication of a trend change, at least at intermediate degree.
For this main wave count downwards movement must move below 1,530.09 because this super cycle wave (II) must move below the high of super cycle wave (I).
Cycle wave c should last between one to several years and should take price substantially below 666.79.
At 454.15 cycle wave c would reach 1.618 the length of cycle wave a. It should subdivide as a five wave motive structure, most likely a simple impulse, but it may also be an ending diagonal.
Movement below 1,646.47 would provide further confidence in a trend change, at least at intermediate wave degree.
All charts are on a semilogarithmic scale. The lower two aqua blue trend lines are a double trend line from the low of 1,158.66 in November 2011 to 1,266.74 in June 2012 with a parallel copy higher up. On the way down price may find some support here. When the lower of these two aqua trend lines is clearly breached on the daily chart then I would have a lot of confidence in this wave count.
When the lower edge of the large maroon – – – channel copied over here from the monthly chart is clearly breached by a full daily candlestick below the trend line and not touching it then I would discard the bullish alternate wave counts and this would be my only wave count.
Within cycle wave c no second wave correction may move beyond the start of its first wave. This wave count is invalidated with any movement above 1,850.84.
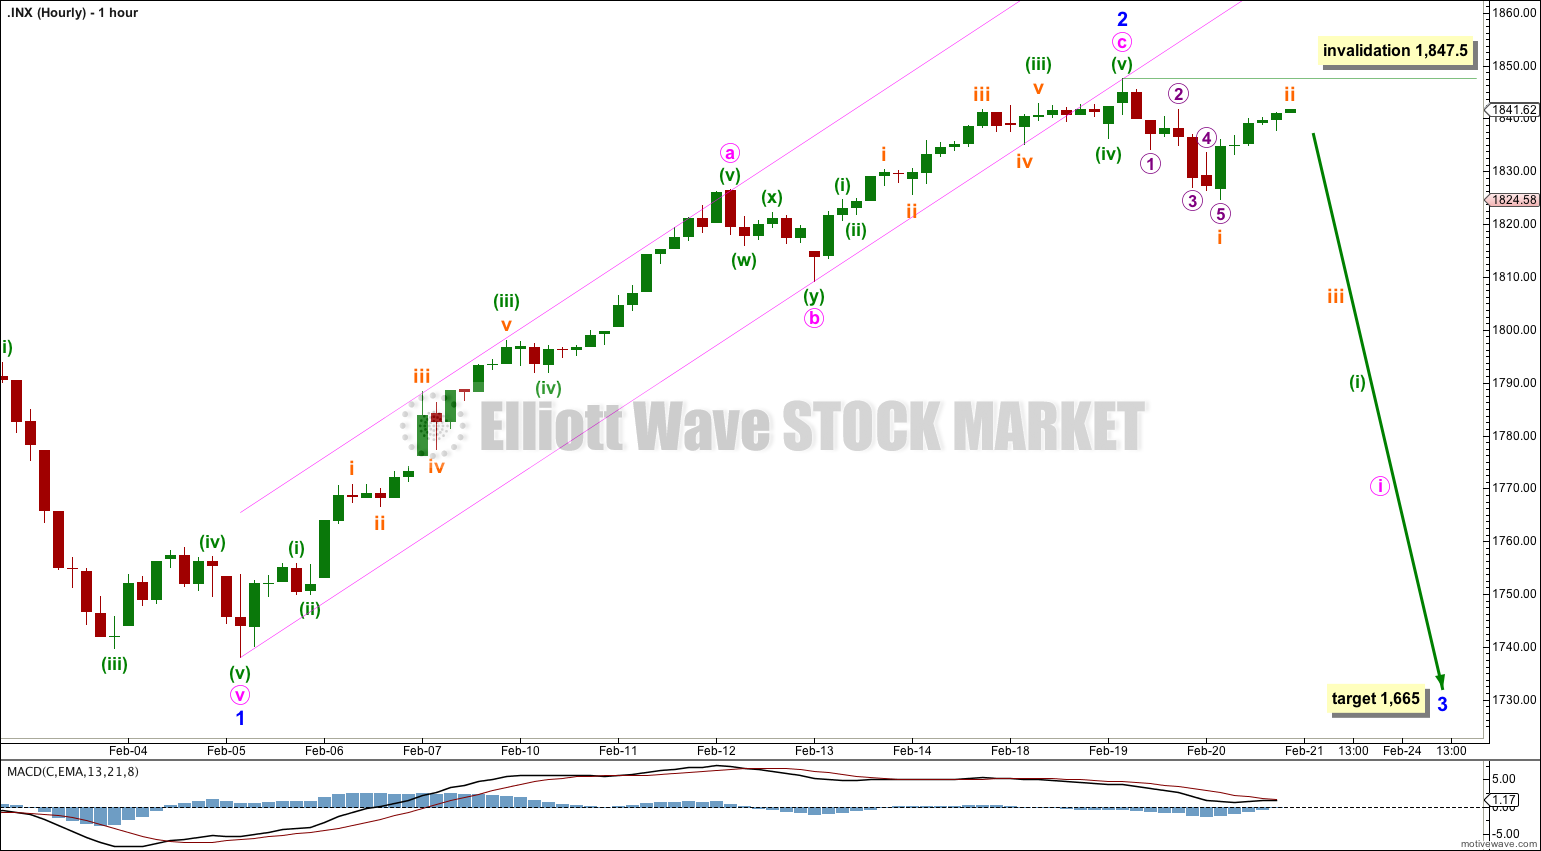
Downwards movement from the high of 1,847.5 subdivides nicely on the five minute and hourly charts as a small five wave impulse. The following upwards movement is extremely close to completion and subdivides as a zigzag. Again, we see a deep second wave correction. Only the substructure of the waves tells us in which direction price is trending.
The small subminuette waves i and ii look like a smaller fractal of minor waves 1 and 2 on the daily chart.
Minor wave 3 must move beyond the end of minor wave 1. This wave count requires and expects new lows below 1,737.92.
At 1,665 minor wave 3 would reach 1.618 the length of minor wave 1.
Minor wave 1 lasted 14 days. Minor wave 3 may last about 14 days or longer. If it is extended (which is extremely likely) then it should be longer in duration and the second and fourth wave corrections within it should show up clearly on the daily chart.
Subminuette wave ii may not move beyond the start of subminuette wave i. This wave count is invalidated with movement above 1,847.50.

Bullish Alternate Wave Count.
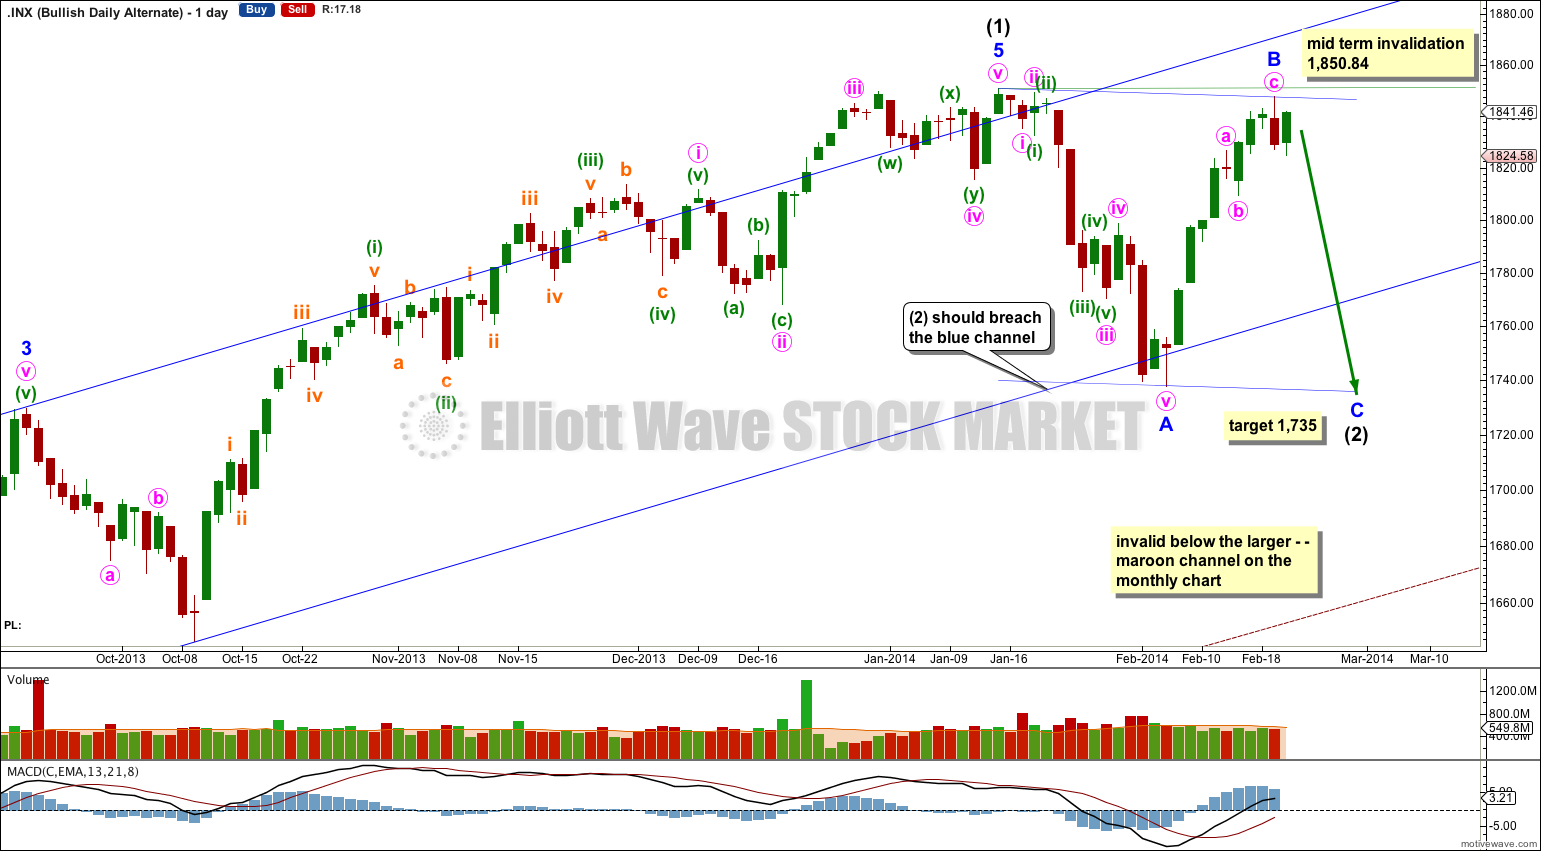
It is possible that a new cycle degree bull market began at 666.79. So far it is not yet halfway through, and I would expect it to last for a few years (at least five more years and probably longer).
At this stage this alternate bullish wave count does not diverge from the main bearish wave count, and it will not for a few to several weeks yet.
In the mid term this bullish wave count may have seen an intermediate degree trend change.
Intermediate wave (2) must subdivide as a three wave corrective structure. The first downwards movement within it must subdivide as a five and within it no second wave correction may move beyond the start of its first wave. This trend change is invalidated with any movement above 1,850.84.
Intermediate wave (2) downwards should last several weeks to a couple of months or so, and should breach the lower edge of the wide blue channel here on the daily chart.
Intermediate wave (2) should not breach support at the lower edge of the larger maroon – – – channel which is drawn the same way for both wave counts. For this alternate intermediate wave (2) should not breach the lower edge of the acceleration channel drawn about primary waves 1 and 2, one degree higher.
Second Bullish Alternate Wave Count.
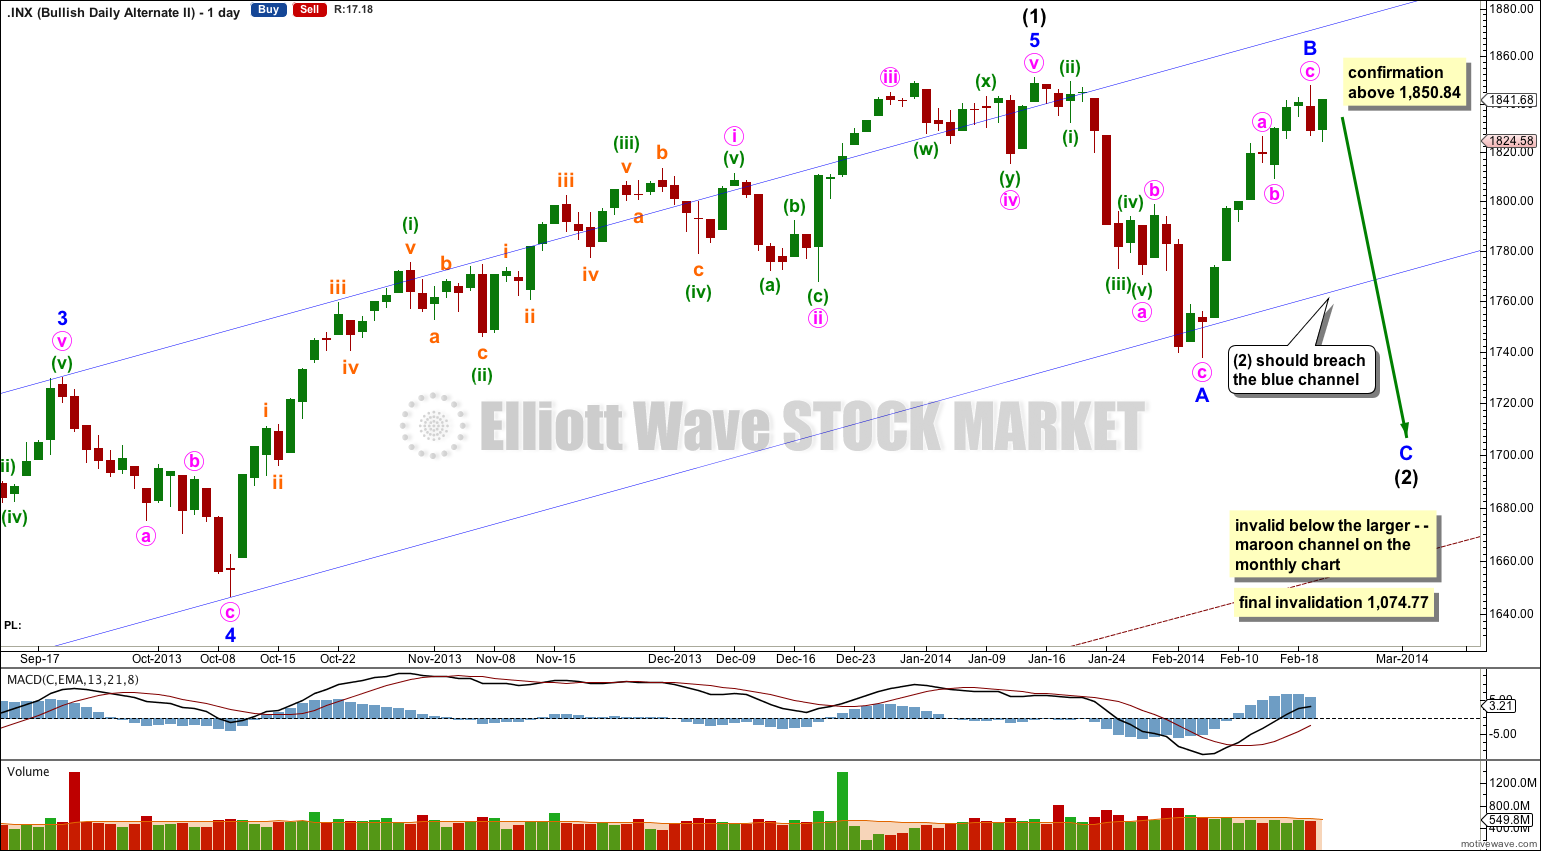
This alternate wave count keeps the labeling within intermediate wave (1) the same as the first bullish alternate, which has the best Fibonacci ratios of all the variations I can see within that movement.
It is still possible that intermediate wave (2) is unfolding as a flat correction if the downwards movement labeled here minor wave A is seen as a zigzag.
Within the flat correction minor wave B may make a new high above 1,850.84. At 1,862.39 minor wave B would reach 105% the length of minor wave A and the structure would be an expanded flat. That would then expect minor wave C downwards to most likely reach 1.618 the length of minor wave A.
Because expanded flats are the most common type of flat this wave count would see a new high as reasonably likely.
If this wave count is confirmed with movement above 1,850.84 then it would be my only wave count which I would publish. With further upwards movement the main bearish wave count reduces in probability so much that it should be relegated to an outside possibility. Above 1,858.03 I would discard it completely.