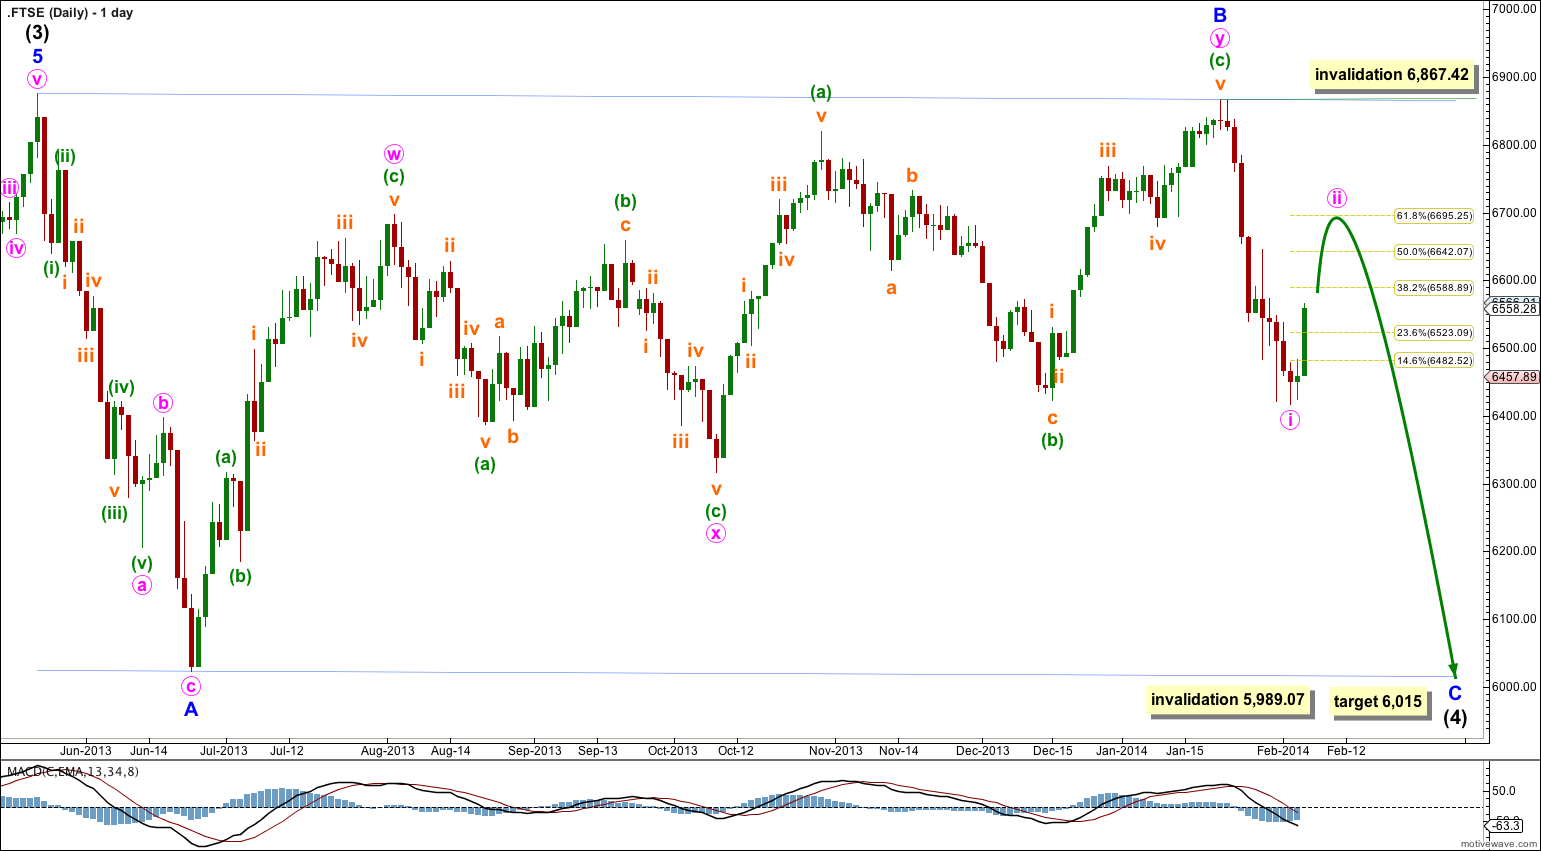
Last week’s analysis of FTSE expected more downwards movement. This is what has happened.
The target remains the same at 6,015 and this target is still about four to six weeks away. On the way down I expect two larger corrections, the first of these two has just begun and should move price a little higher.
Click on the chart below to enlarge.
Intermediate wave (4) may be completing as a regular flat correction which is reasonably common.
Within the flat minor waves A and B both subdivide as “threes”: minor wave A is a single zigzag and minor wave B is a double zigzag. Minor wave B is a 99% correction of minor wave A.
At 6,015 minor wave C would reach equality in length with minor wave A. It is very likely to make a new low below the end of minor wave A at 6,023.44 to avoid a truncation, although if it is truncated this would still be a regular flat and not a running flat.
Minor wave C may end at the lower edge of the parallel channel drawn about this flat correction.
Intermediate wave (4) may not move into intermediate wave (1) price territory. This wave count is invalidated with movement below 5,989.07.
Minor wave C downwards must subdivide as a five wave structure, either a simple impulse or an ending diagonal. Within it the first wave labeled minute wave i subdivides best on the hourly chart as an impulse, and so minor wave C is most likely to be an impulse. An ending diagonal would require the first wave to subdivide as a zigzag.
Minute wave ii is incomplete, and it should show a clear three wave structure on the daily chart. It may not move beyond the start of minute wave i above 6,867.42. It may end about the 0.618 Fibonacci ratio of minute wave i at 6,695.25.

