
Movement below 1,770.45 has confirmed a trend change. The downwards trend is either a new cycle degree wave, or an intermediate degree correction.
The wave count remains the same.
Summary: The mid term picture is now clearer. Overall downwards movement is incomplete and I expect more downwards movement. The short term target for tomorrow is 1,724. A second wave correction is coming, but it is not here yet.
Click on the charts below to enlarge.
Main Bearish Wave Count.
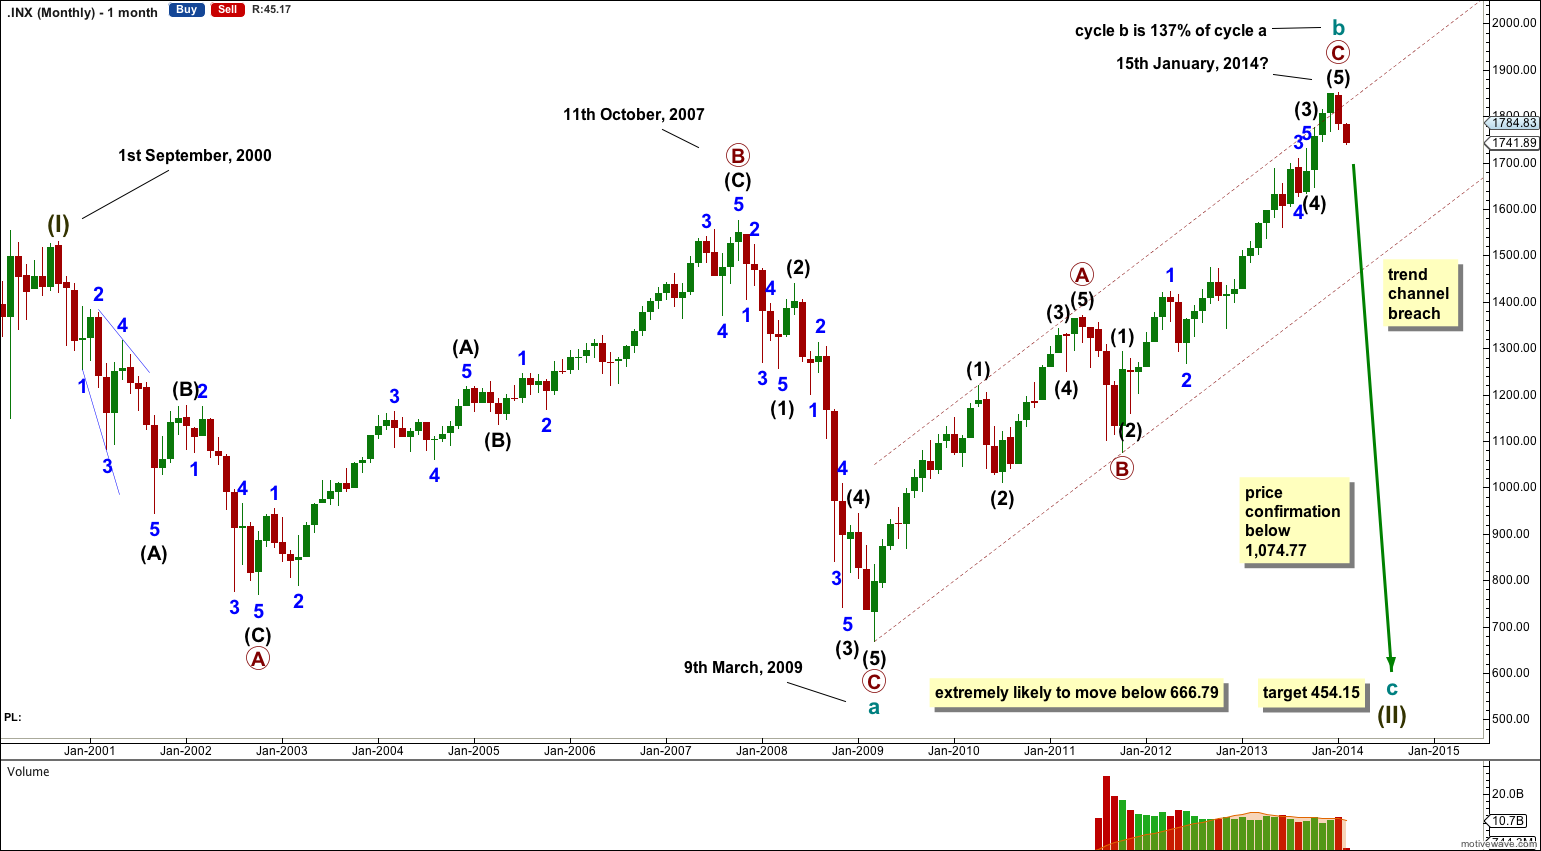
This wave count sees a huge expanded flat correction for a super cycle wave (II) incomplete. The final cycle degree wave c downwards is required.
Because cycle wave b moved substantially beyond the start of cycle wave a this is unlikely to complete as a running flat and is very likely to be an expanded flat. C waves within expanded flats normally move substantially beyond the end of their A waves, and so cycle wave c is likely to move substantially below 666.79. At 454.15 it would reach 1.618 the length of cycle wave a.
When the big maroon – – – parallel channel is clearly breached by downwards movement with a full monthly candlestick below the lower trend line, and not touching it, then this would be my only wave count.
This wave count has a higher probability than the bullish alternate. Upwards movement over the last 4 years and 11 months subdivides best as a zigzag. If something is “off” about the supposed recovery then it must be a B wave because there is plenty that is off in this scenario in terms of social mood.
It is possible that cycle wave b is over and that there has been a trend change at cycle degree (bearish wave count) or intermediate wave degree (bullish alternate below).
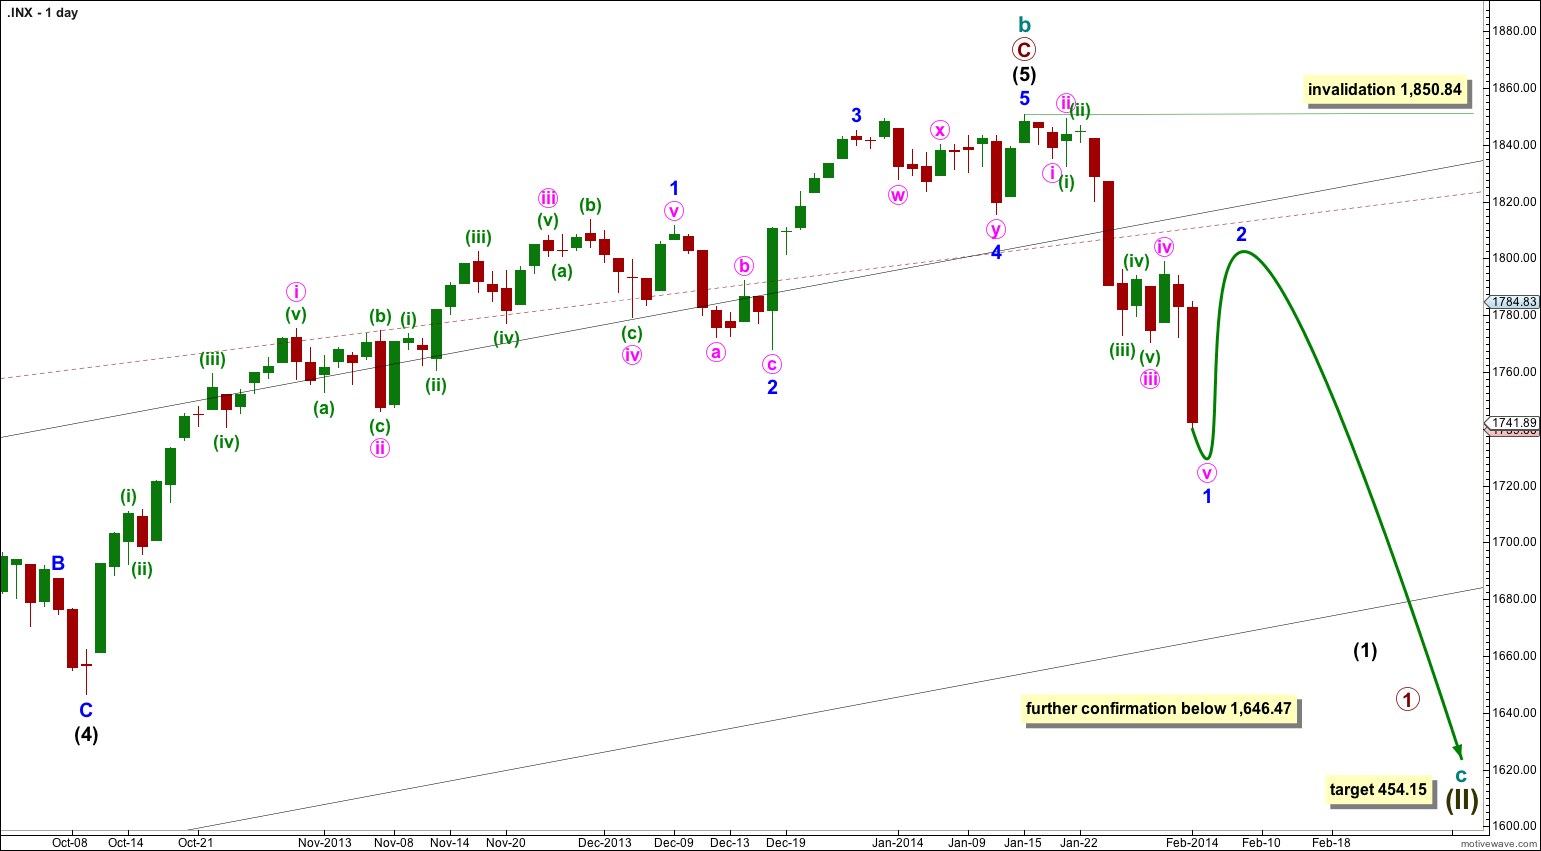
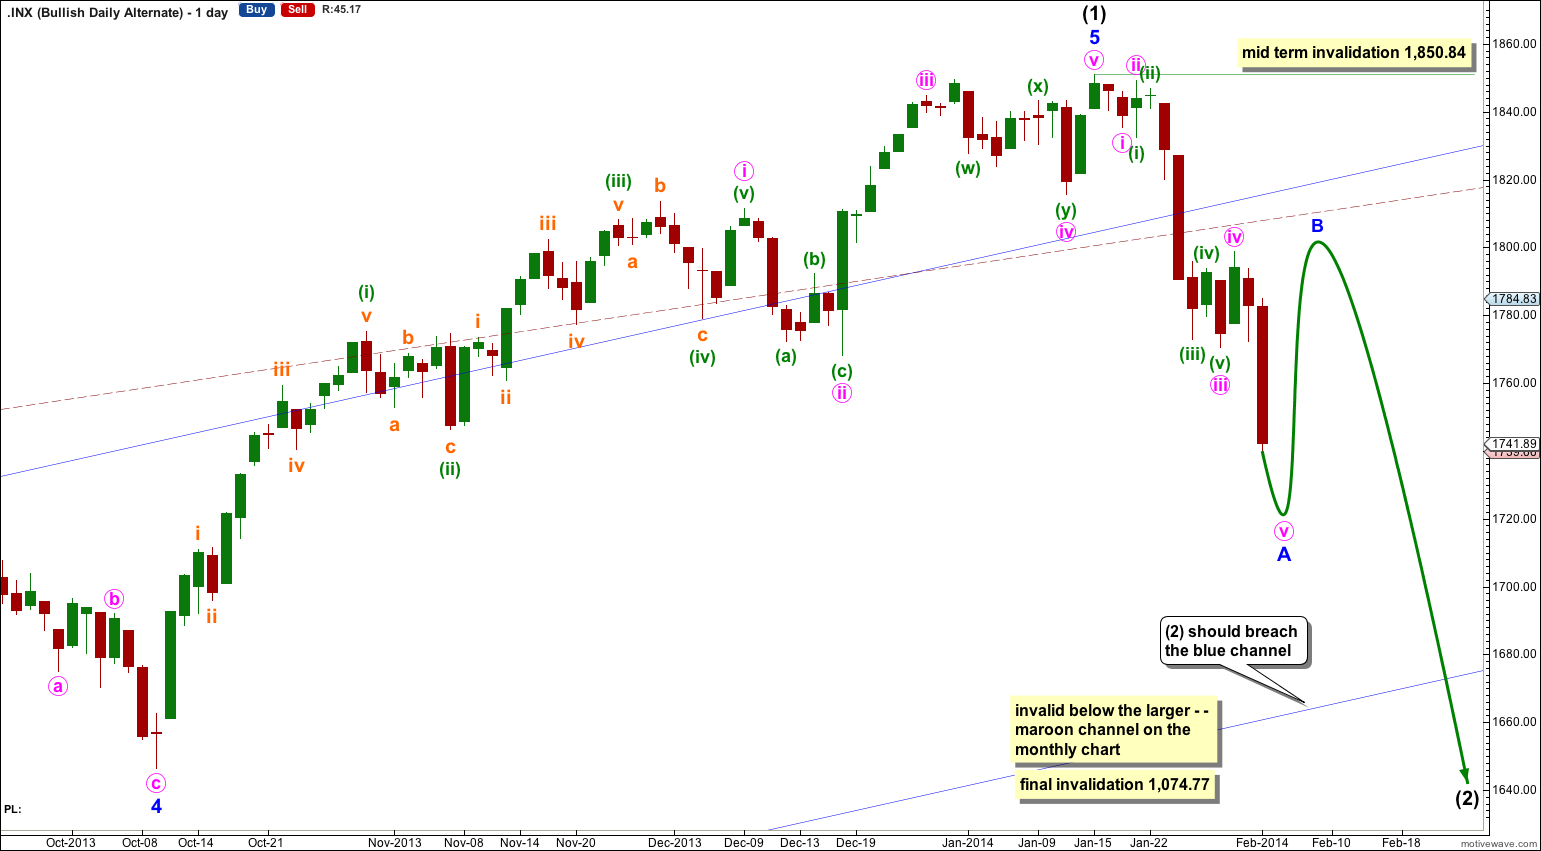
There is now a clear five down on the daily chart. This is indication of a trend change, at least at intermediate degree.
Downwards movement must move below 1,530.09 because this super cycle wave (II) must move below the high of super cycle wave (I).
Cycle wave c should last between one to several years and should take price substantially below 666.79.
At 454.15 cycle wave c would reach 1.618 the length of cycle wave a. It should subdivide as a motive structure, most likely a simple impulse.
Movement below 1,646.47 would provide further confidence in a trend change, at least at intermediate wave degree.
If downwards movement breaches the maroon – – – channel on the monthly chart then I would discard the bullish alternate and this would be my only wave count.
Within cycle wave c no second wave correction may move beyond the start of its first wave. This wave count is invalidated with any movement above 1,850.84.
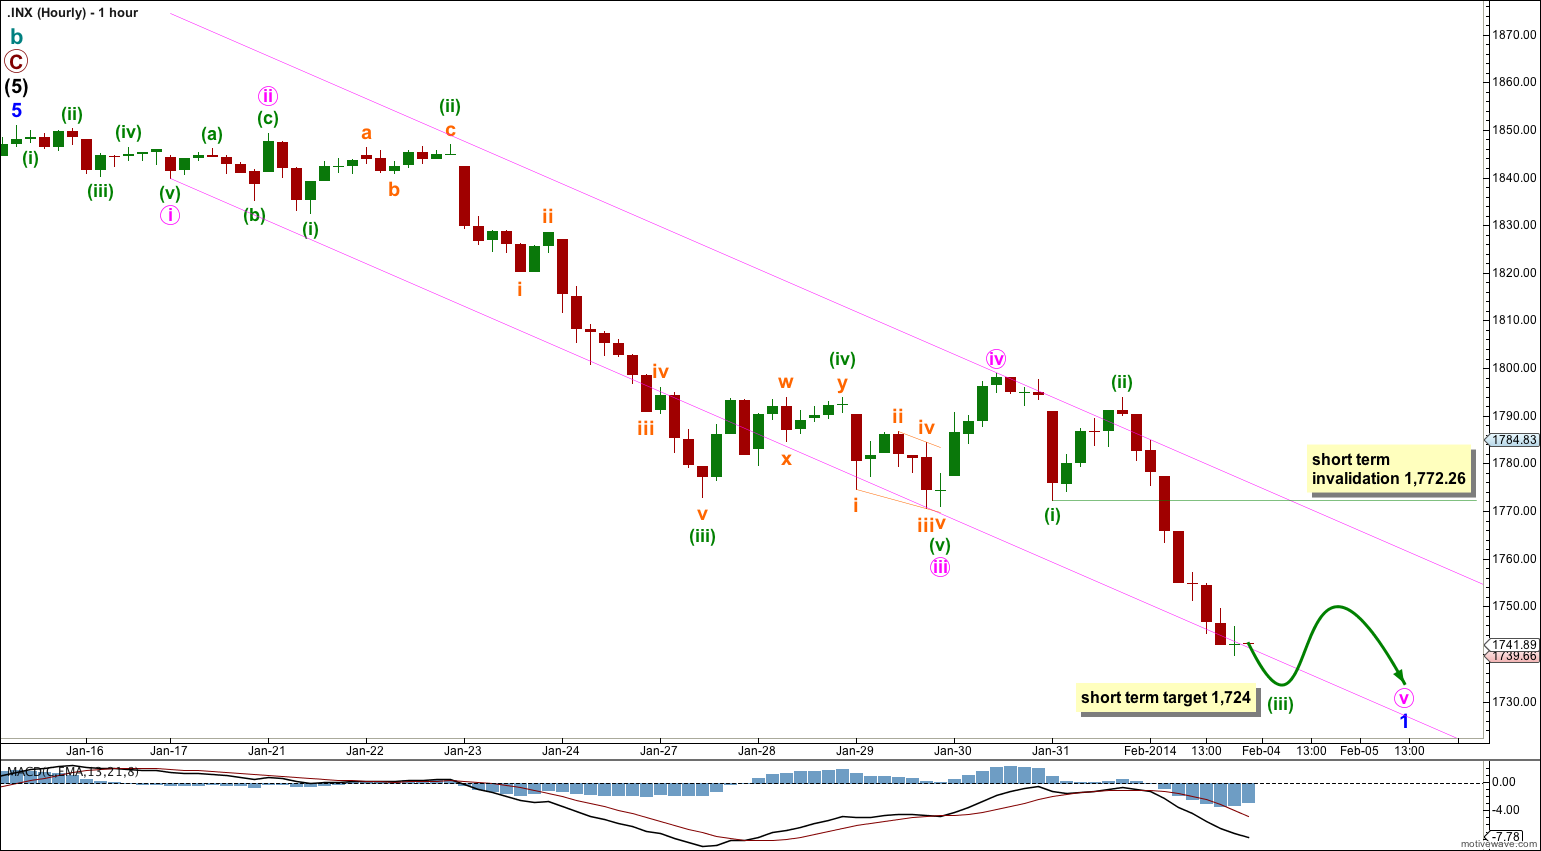
There is now an almost complete five wave structure downwards. Minute wave iv did not complete as a triangle as it was already over as a zigzag.
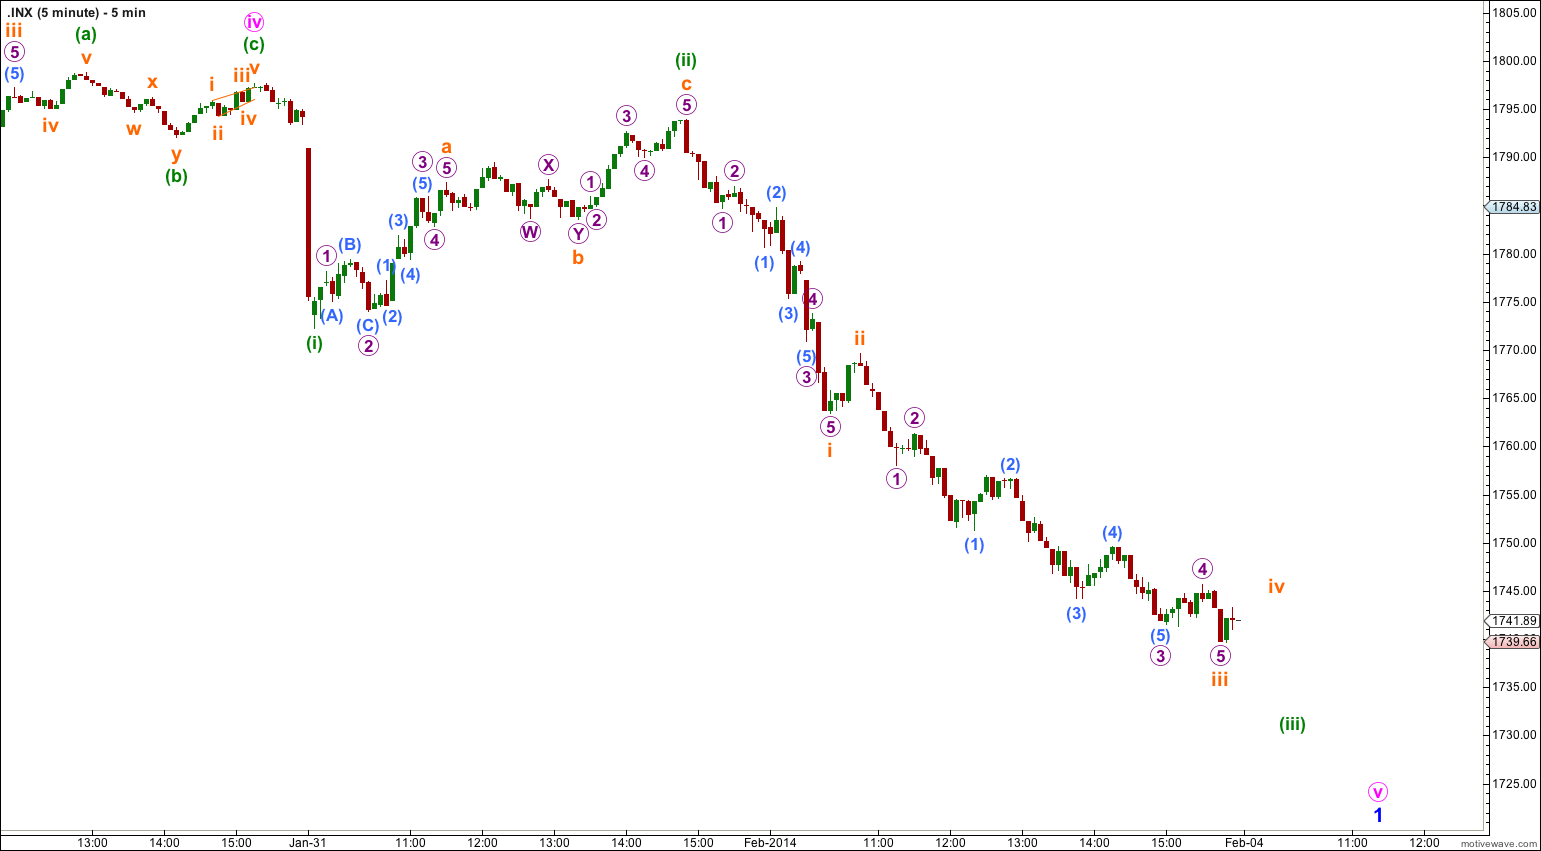
Minute wave v is an incomplete impulse. Within it minuette wave (iii) is incomplete on the five minute chart. It has passed 1.618 the length of minuette wave (i) and would reach 2.618 the length of minuette wave (i) at 1,724. The following minuette wave (iv) may not move into minuette wave (i) price territory. This wave count is invalidated with movement above 1,772.26.
Bullish Alternate Wave Count.
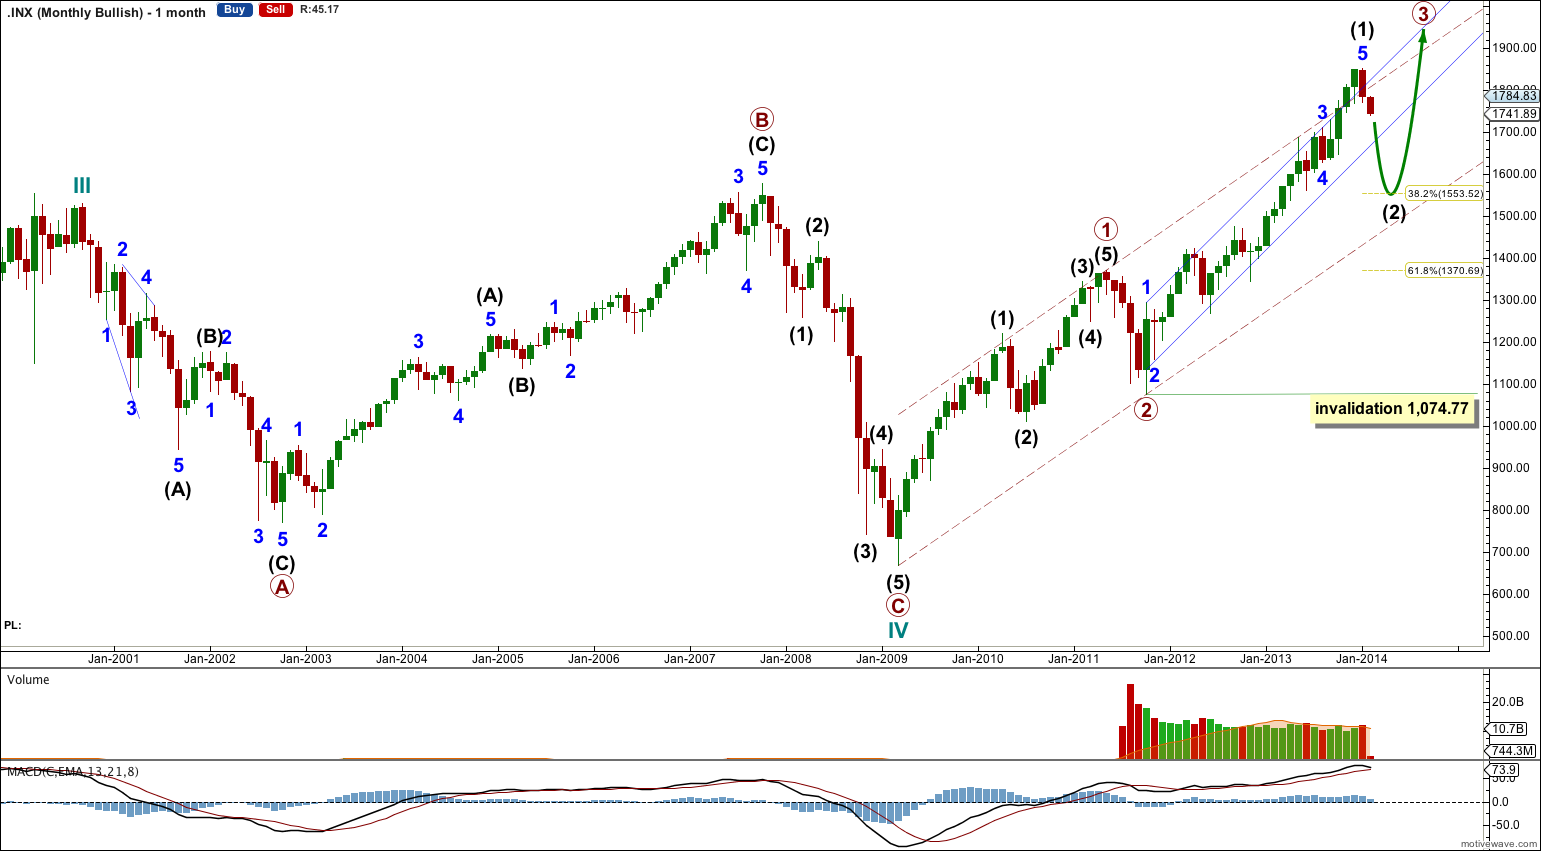
If the correction ended at 666.79 in March, 2009 then a new bull market may have begun there for cycle wave V.
If upwards movement is cycle wave V then it cannot have passed the middle yet because the third wave should show an increase in momentum and volume beyond that seen for the first wave.
Primary waves 1 and 2 may be over, and primary wave 3 may be extending. However, so far intermediate wave (1) shows a decrease in volume, although it does show an increase in momentum.
For this bullish alternate intermediate wave (2) should not breach the lower edge of the acceleration channel drawn about primary waves 1 and 2. If this channel is clearly breached then this wave count should be discarded, or would at least have a much reduced probability.
It is possible that a new cycle degree bull market began at 666.79. So far it is not yet halfway through, and I would expect it to last for a few years (at least five more years and probably longer).
In the mid term this bullish wave count may have seen an intermediate degree trend change. Intermediate wave (2) has most likely begun because price is now back in the wider blue and maroon – – – channels.
Intermediate wave (2) must subdivide as a three wave corrective structure. The first downwards movement within it must subdivide as a five and within it no second wave correction may move beyond the start of its first wave. This trend change is invalidated with any movement above 1,850.84.
Intermediate wave (2) downwards should last several weeks to a couple of months or so, and should breach the lower edge of the wide blue channel here on the daily chart.
Intermediate wave (2) should not breach support at the lower edge of the larger maroon – – – channel which is drawn the same way for both wave counts. For this alternate intermediate wave (2) should not breach the lower edge of the acceleration channel drawn about primary waves 1 and 2, one degree higher.