
It is most likely that intermediate wave (4) is not over and will complete as a regular flat correction. The triangle scenario was invalidated. It is very likely that FTSE should drop below 6,023.44. The target is 6,015.
Click on the charts below to enlarge.
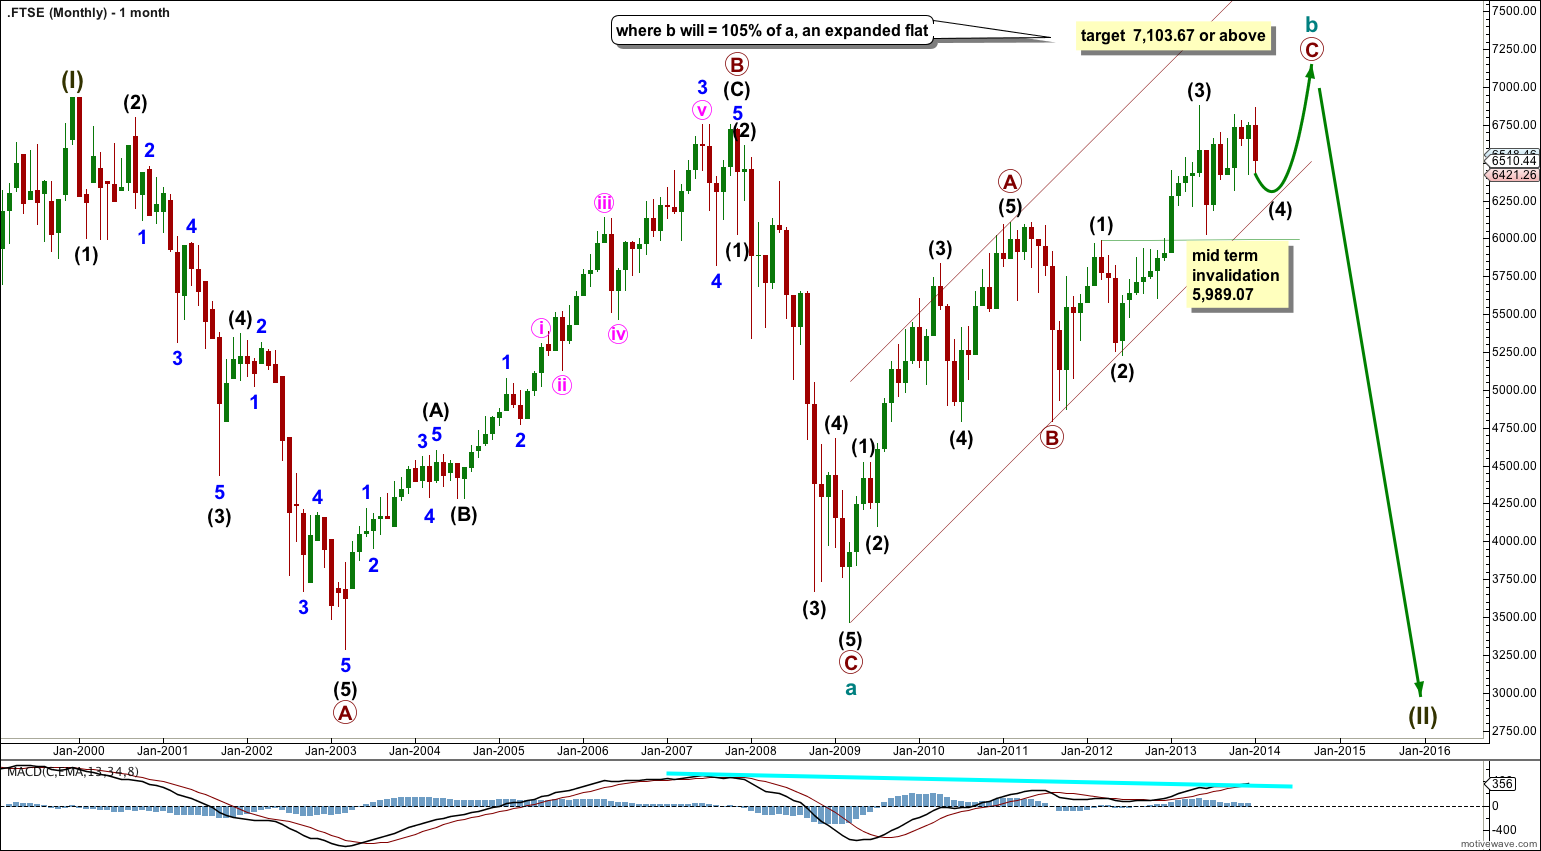
A large super cycle degree flat correction may be unfolding for super cycle wave II.
Within the flat cycle wave a is a zigzag with a truncated primary wave C.
Cycle wave b is an incomplete zigzag. Within it primary waves A and B are complete, primary wave C is incomplete.
Within primary wave C intermediate wave (4) is most likely incomplete. When it is done a final upwards wave for intermediate wave (5) would be likely to take price to 7,103.67 or above so that cycle wave b is 105% or longer than cycle wave a. This would see super cycle wave II as an expanded flat correction which is the most common type of flat.
Within primary wave C intermediate wave (4) may not move into intermediate wave (1) price territory. This wave count is invalidated with movement below 5,989.07.
When I have confidence that intermediate wave (4) is over then I would use the ratios at intermediate degree within primary wave C to calculate a target for intermediate wave (5) to end.
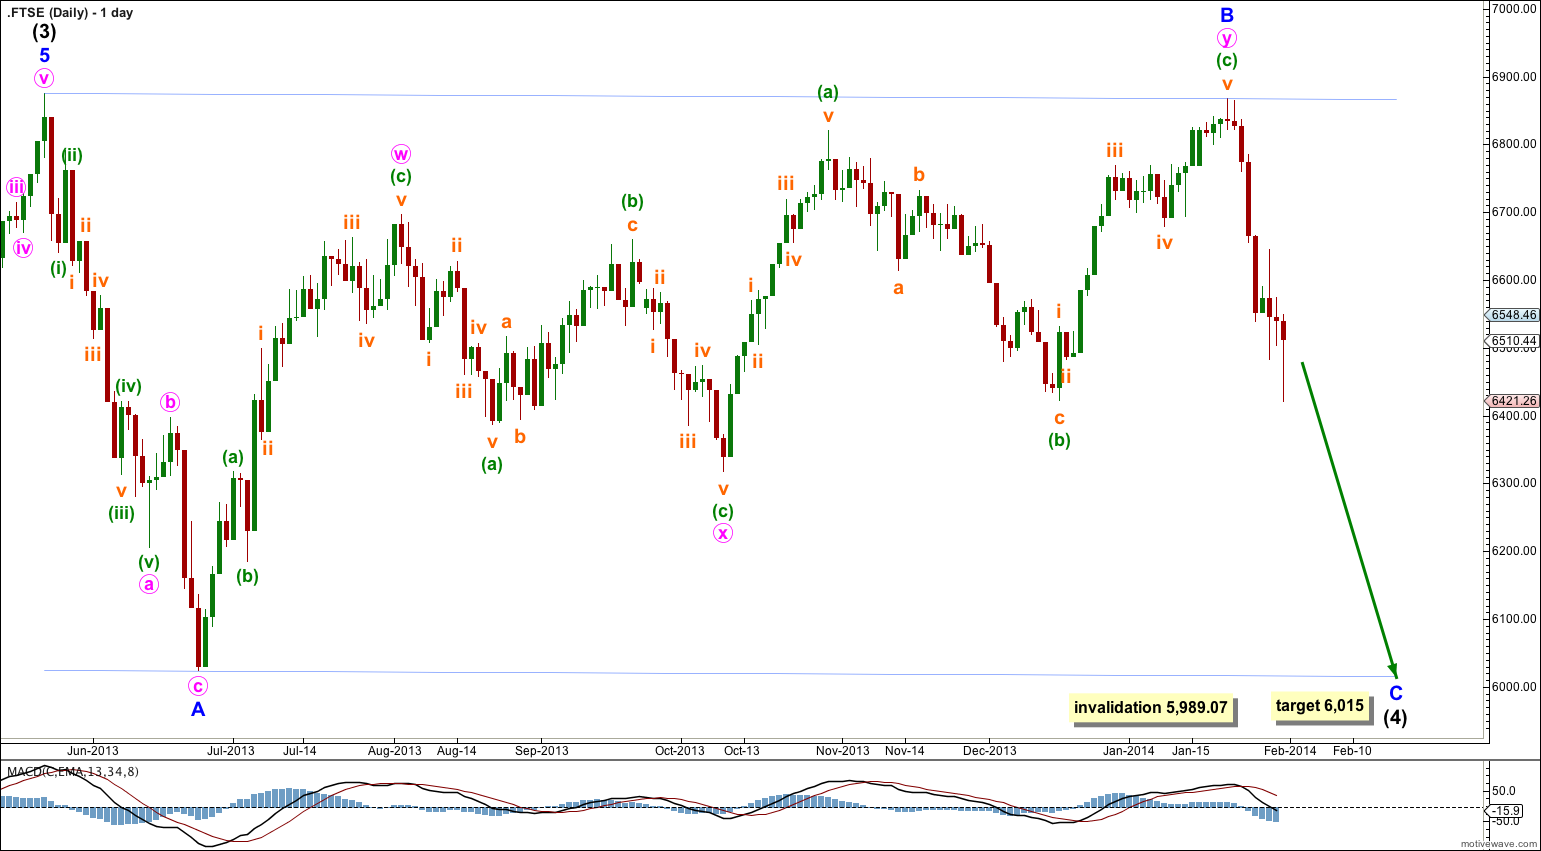
Intermediate wave (4) is not a triangle, but it may be a regular flat correction which is reasonably common.
Within the flat minor waves A and B both subdivide as “threes”; minor wave A is a single zigzag, minor wave B is a double zigzag. Minor wave B is a 99% correction of minor wave A.
At 6,015 minor wave C would reach equality in length with minor wave A. It is very likely to make a new low below the end of minor wave A at 6,023.44 to avoid a truncation, although if it is truncated this would still be a regular flat and not a running flat.
Minor wave C may end at the lower edge of the parallel channel drawn about this flat correction.
Intermediate wave (4) may not move into intermediate wave (1) price territory. This wave count is invalidated with movement below 5,989.07.
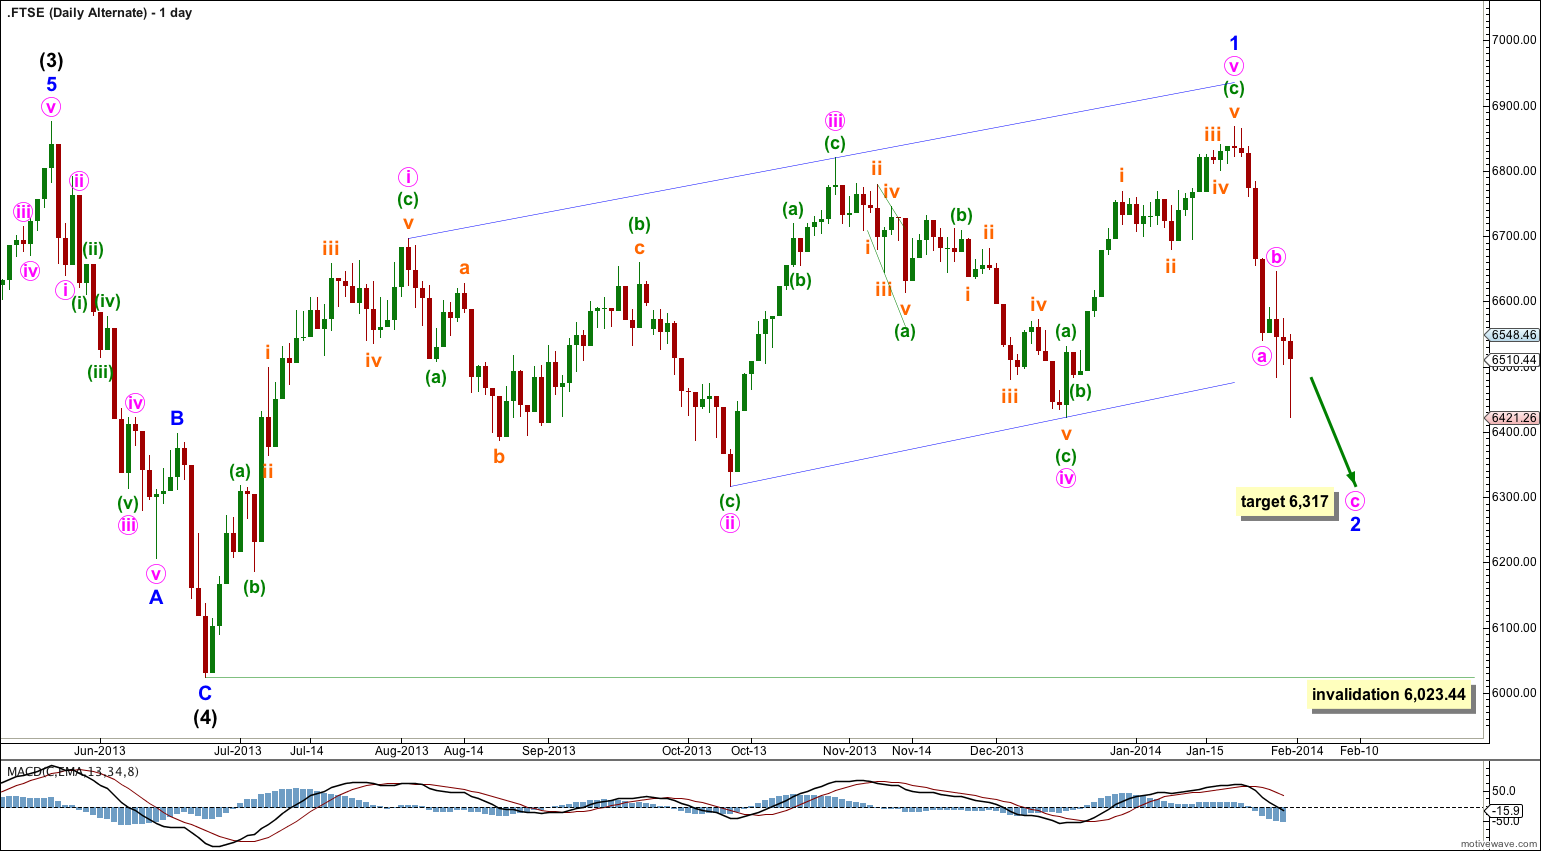
I publish this possible alternate mostly to play devil’s advocate. It has too many problems to be viable. I use it to illustrate why intermediate wave (4) is most likely not over because if intermediate wave (5) has begun then the subdivisions do not fit.
If intermediate wave (4) was over at 6,023.44 as a brief single zigzag then it shows little structural alternation with intermediate wave (2) which also fits best as a single zigzag.
If intermediate wave (5) began at 6,023.44 then the first wave up within it looks like it could be a leading diagonal. The problem with this idea is the wave lengths within the diagonal. The actionary waves i, iii and v are progressively shorter so this indicates the diagonal should be contracting, but the reactionary waves of ii and iv are progressively longer which indicates the diagonal should be expanding. It is neither expanding nor contracting and the trend lines look mostly parallel. This movement does not fit well at all as a diagonal. Only because the subdivisions fit would I consider this, and only then when all other possible alternates have been invalidated.
The diagonal would be extremely unlikely to be an ending diagonal because it is very rare to see fifth wave ending diagonals which end in a fifth wave truncation. If this diagonal is intermediate wave (5) as an ending diagonal then it failed slightly to move beyond the end of intermediate wave (3) at 6,875.62 by 8.2 points.