
Last analysis expected more downwards movement. The first target at 1,785 was not where the subminuette wave iii ended, but the second target for minuette wave (iii) at 1,775 was met and only slightly exceeded by 2.12 points.
Downwards movement was expected and was what happened.
The wave count remains the same.
Summary: A small fourth wave correction halfway through, it may end tomorrow or the day after. Overall downwards movement should continue because this structure is still incomplete.
Click on the charts below to enlarge.
Main Bearish Wave Count.
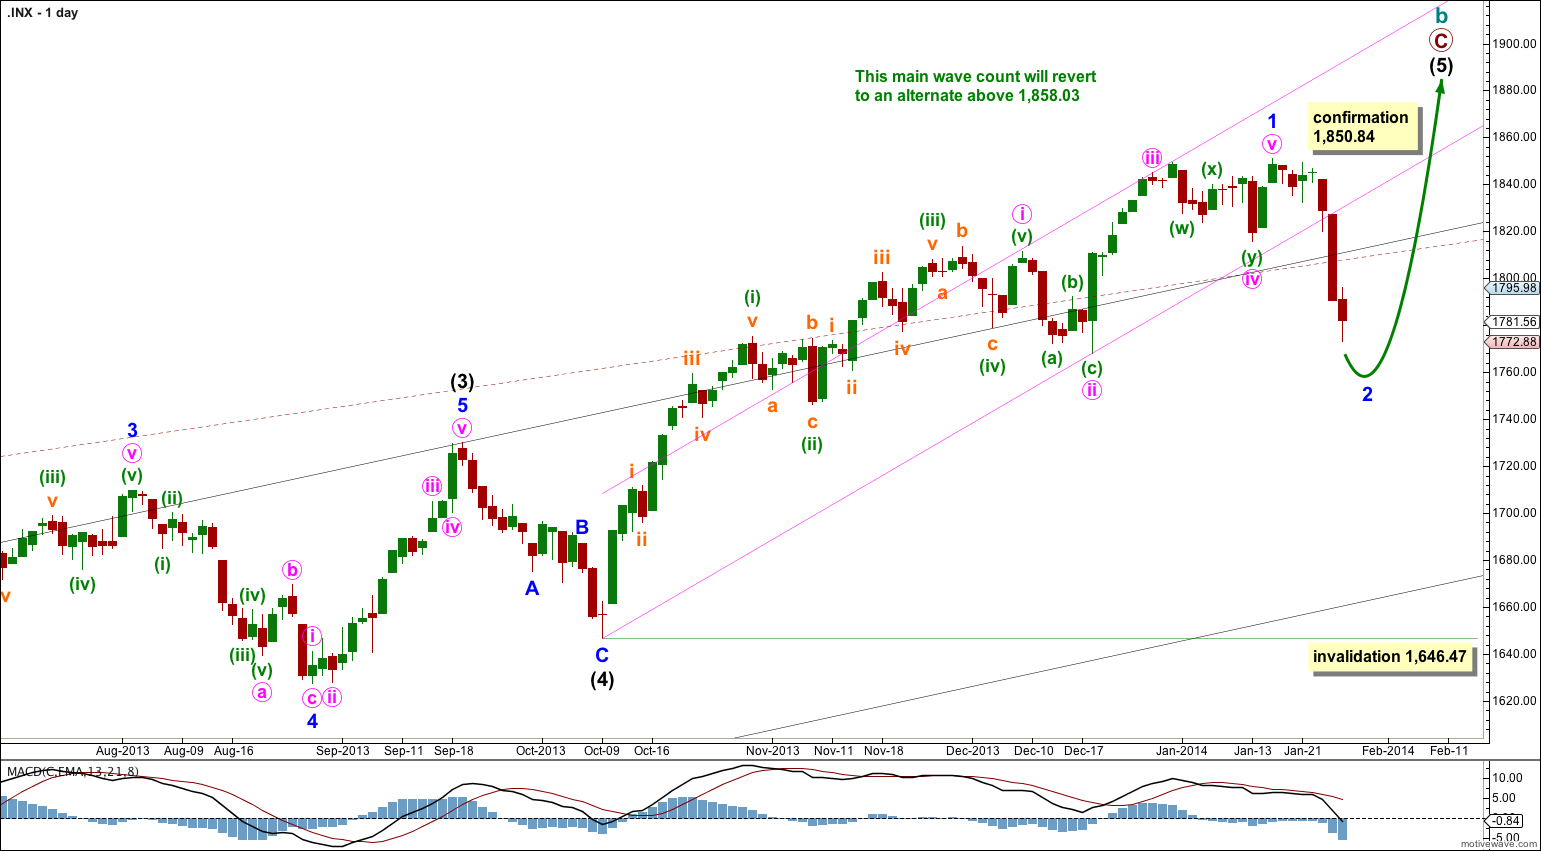
This wave count has a higher probability than the bullish alternate. Upwards movement over the last 4 years and 10 months subdivides best as a zigzag. If something is “off” about the supposed recovery then it must be a B wave because there is plenty that is off in this scenario in terms of social mood.
We should always assume that the trend remains the same until proven otherwise. While price remains above 1,646.47 we should assume the upwards trend is still in place.
The pink channel is drawn about minor wave 1 using Elliott’s first technique: draw the first trend line from the highs of minute waves i to iii, then place a parallel copy upon the low of minute wave ii. I would expect minor wave 2 to breach this channel. Minor wave 2 has now also breached the upper edges of the black and maroon – – – channels copied over from weekly and monthly charts. I had expected downwards movement to find support there. Because it did not I will give a little more weight to the alternate bearish wave count.
Minor wave 2 may not move beyond the start of minor wave 1. This wave count is invalidated with movement below 1,646.47.
At super cycle degree the structure is an expanded flat correction. Within the flat the maximum common length of cycle wave b is 138% the length of cycle wave a, and this is achieved at 1,858.03. When cycle wave b is longer than the common length of cycle wave a then the probability that an expanded flat is unfolding would reduce and it would be more likely that a long term bull market is underway. Above 1,858.03 I will swap this main wave count over with the bullish alternate.
Minor wave 2 may be unfolding as a zigzag. Within the zigzag minute waves a and b are complete, and minute wave c is still incomplete.
Minute wave c has passed 1.618, 2.618 and 4.236 the length of minute wave a. It may not exhibit a Fibonacci ratio to minute wave a. Because of the length of this downwards impulse labeled minute wave c in relation to the shorter impulse of minute wave a this unfolding structure looks more like a third wave extension than a C wave, and so again I will add a little more weight to the alternate bearish wave count below.
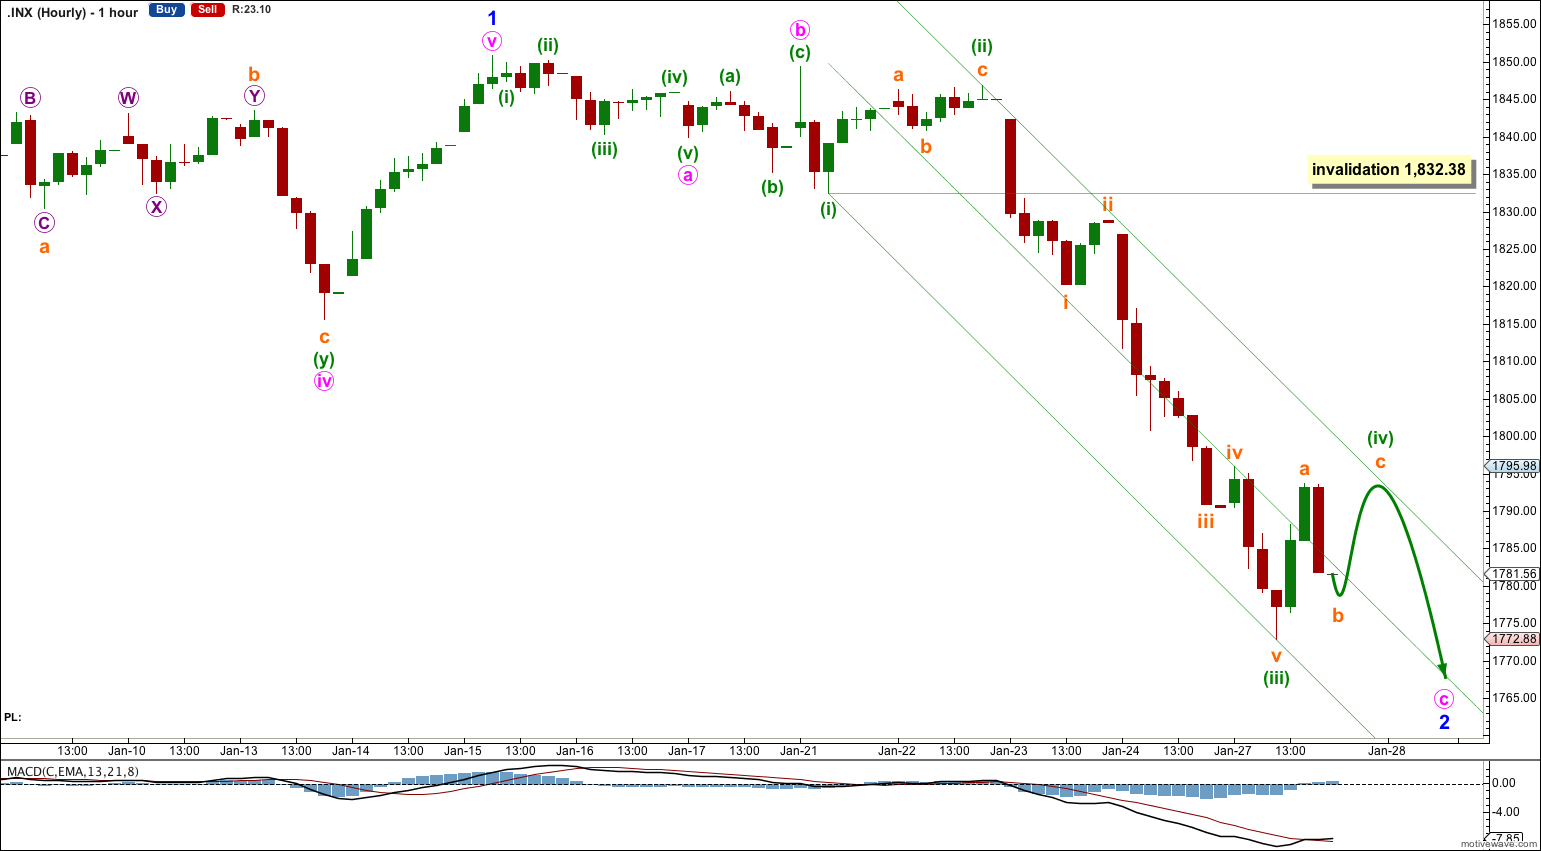
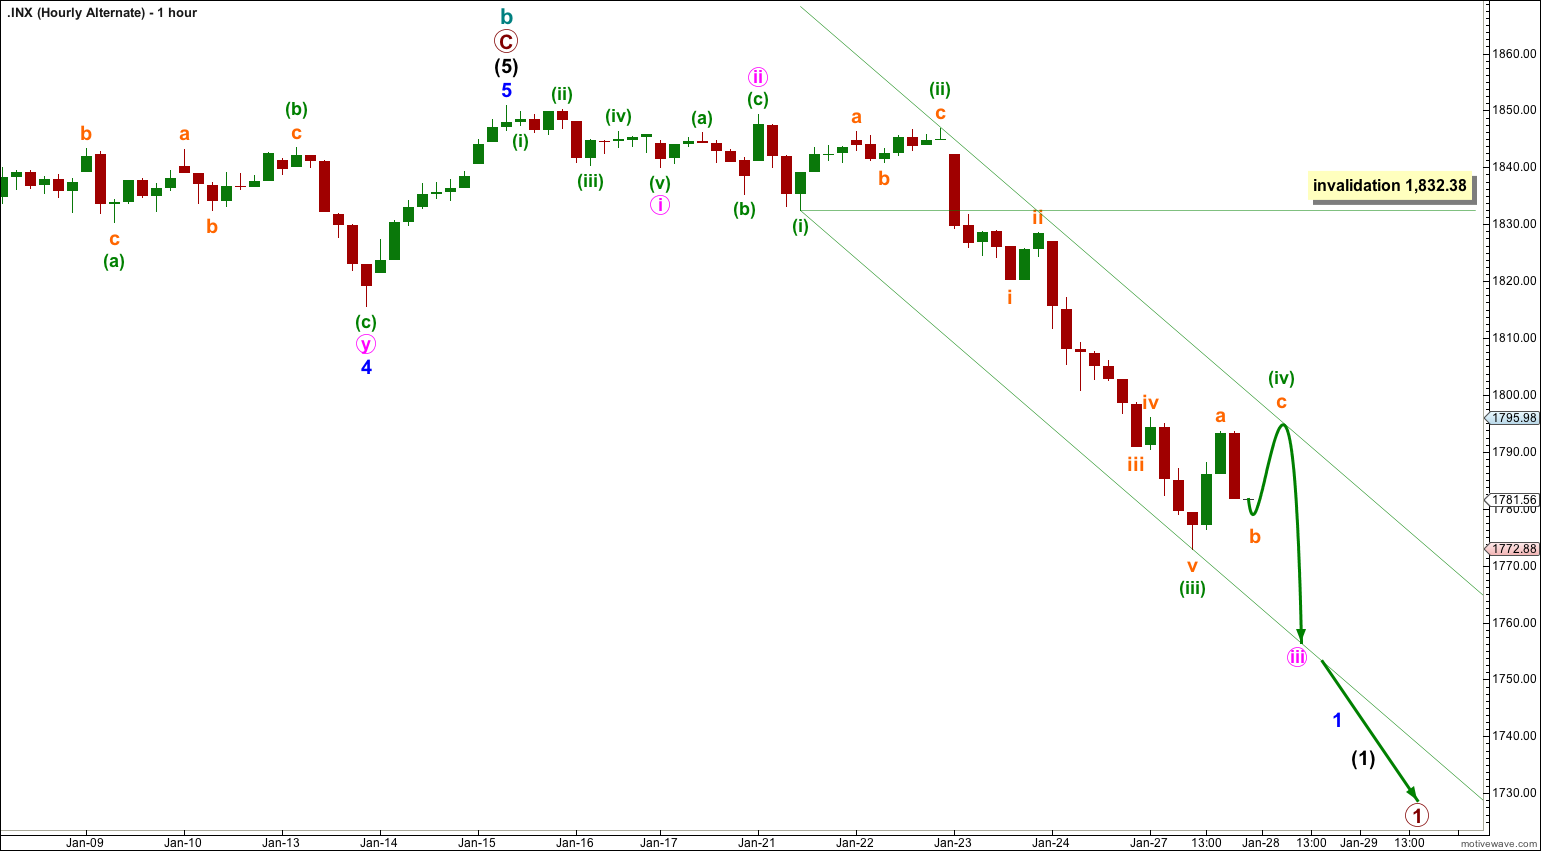
When minuette wave (iv) is complete then I would calculate a target downwards for minuette wave (v). I would expect minuette wave (v) to most likely be about 45.73 points in length, 0.618 the length of minuette wave (ii). However, minuette wave (v) may not exhibit a Fibonacci ratio to minuette waves (i) or (iii) because there is already a good Fibonacci ratio between the first two actionary waves. Minuette wave (iii) is 2.27 points longer than 4.236 the length of minuette wave (i).
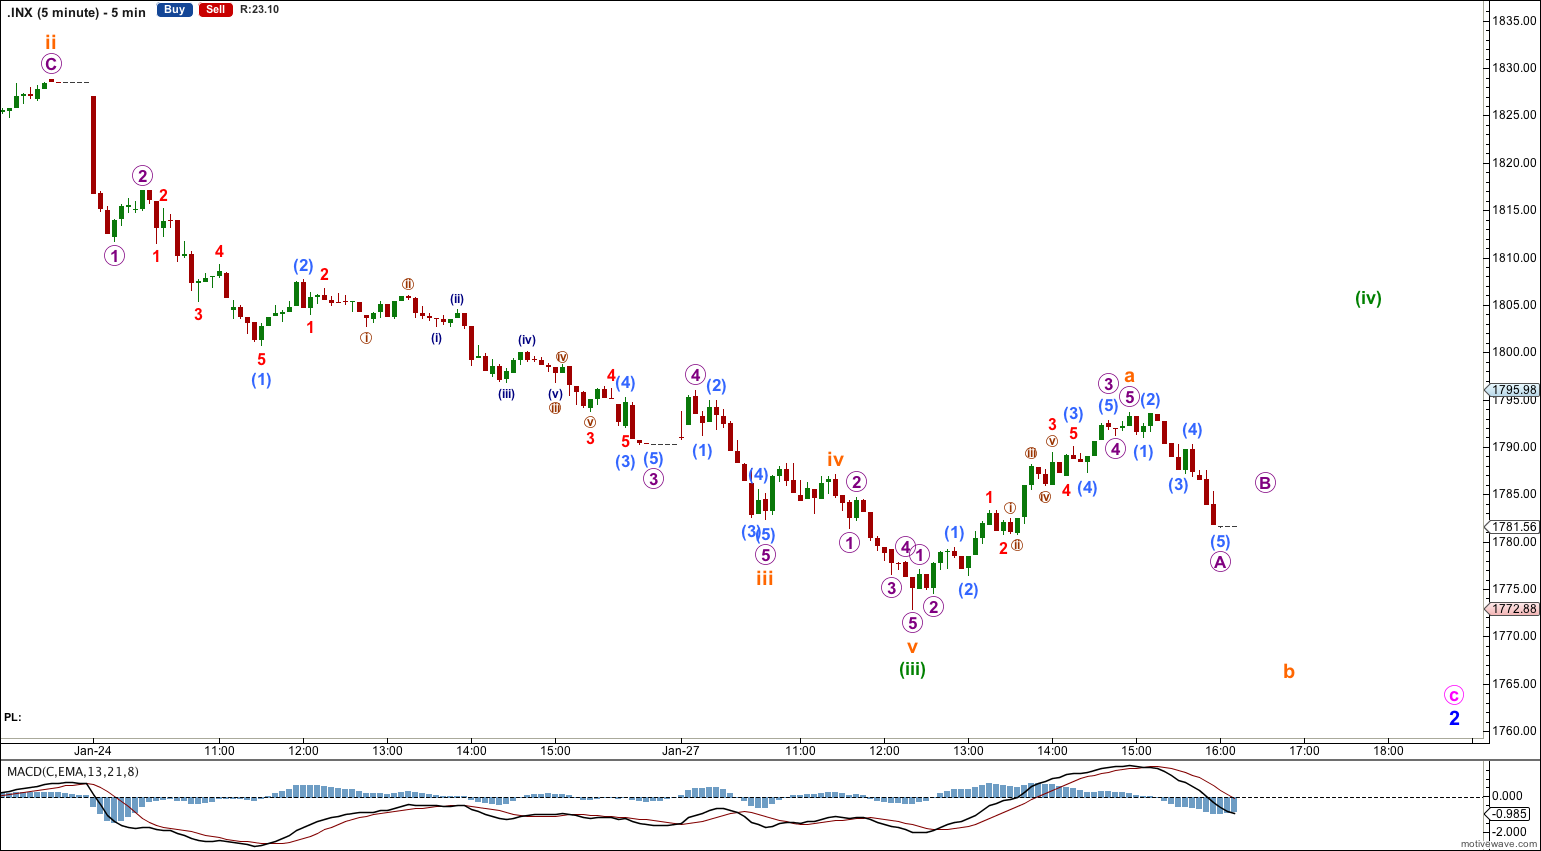
On the five minute chart the structure of minuette wave (iv) looks like it is incomplete. I would expect some more choppy overlapping movement and a slightly higher high above 1,793.64 to unfold over the next day or so. Minuette wave (iv) may find resistance at the upper edge of the parallel channel which is drawn using Elliott’s first technique.
Minuette wave (iv) may not move into minuette wave (i) price territory. This wave count is invalidated with movement above 1,832.38.
Bearish Alternate Wave Count.
It is again possible that cycle wave b is over and that there has been a trend change at cycle degree (bearish wave count) or intermediate wave degree (bullish alternate below).
If a clear five down on the daily chart develops then this will be my main wave count.
Downwards movement must move below 1,530.09 because this super cycle wave (II) must move below the high of super cycle wave (I).
Cycle wave c should last between one to several years and should take price substantially below 666.79. I must subdivide as a five wave structure.
At 454.15 cycle wave c would reach 1.618 the length of cycle wave a. It should subdivide as a motive structure, most likely a simple impulse.
It is always wise to assume that the trend remains the same until proven otherwise. While price remains above 1,646.47 we should assume the trend remains up and this will be an alternate wave count.
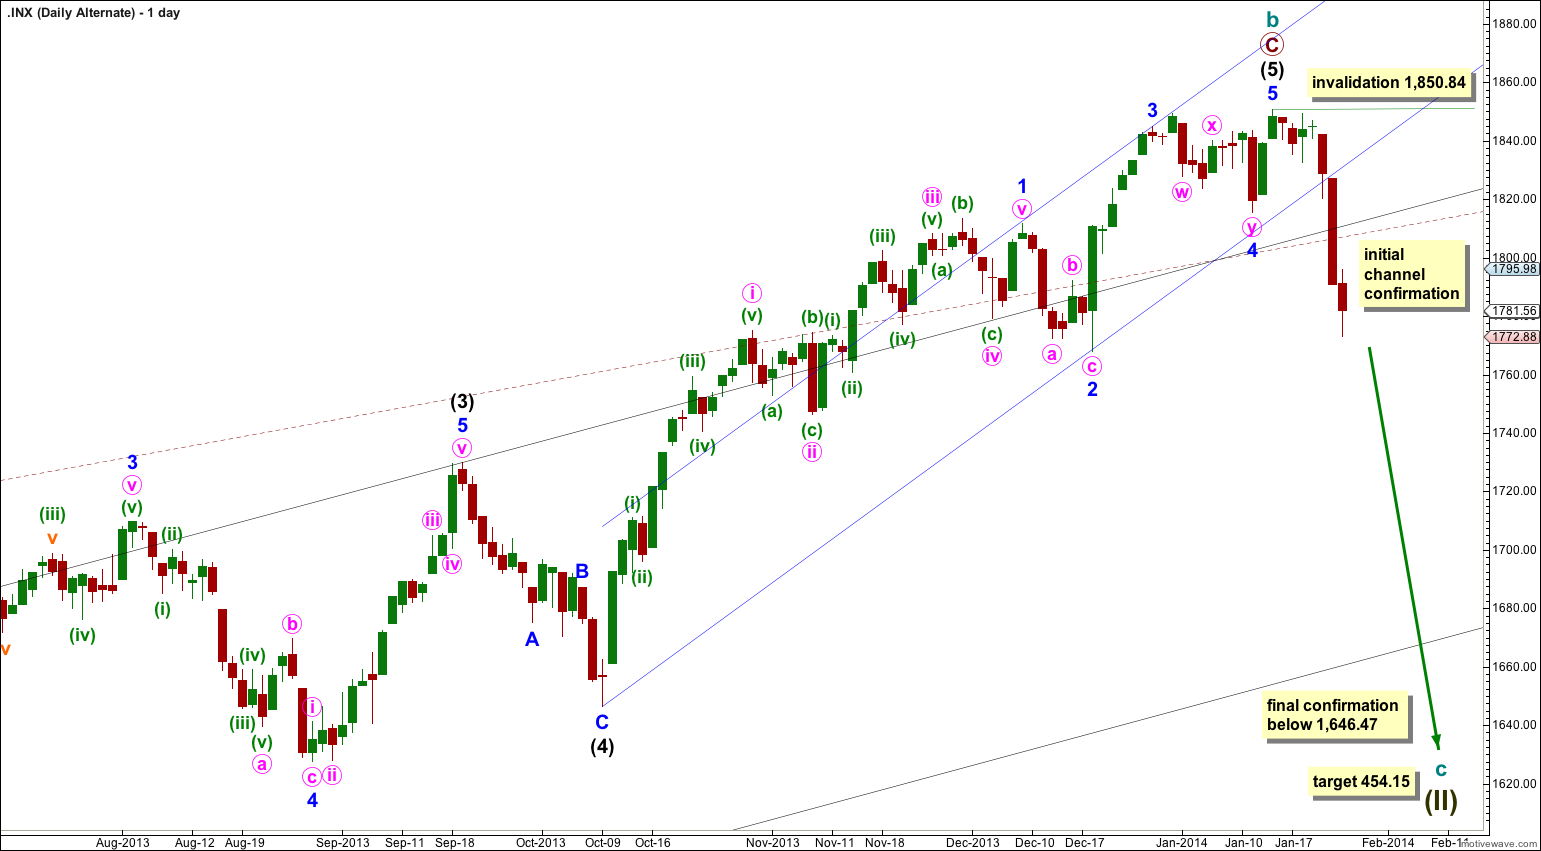
There is now a clear breach of the upper edge of the black and maroon – – – channels. This increases the probability of an intermediate or cycle degree trend change. If we see a clear five wave structure downwards on the daily chart this would become my main wave count. Movement below 1,646.47 would confirm a trend change, at least at intermediate wave degree.
Within cycle wave c no second wave correction may move beyond the start of its first wave. This wave count is invalidated with any movement above 1,850.84.
Because a trend change at cycle or intermediate wave degree has now increased in probability it is time to follow this wave count on the hourly chart.
A-B-C and 1-2-3 have exactly the same subdivisions. The subdivisions on this hourly alternate are exactly the same as the main hourly wave count. Both wave counts expect more downwards movement in the short to mid term.
This alternate would expect minute wave iii to most likely end about the lower edge of the channel drawn about this unfolding impulse.
For this alternate downwards movement would be an unfolding first wave down within a first wave at primary degree.
Bullish Alternate Wave Count.
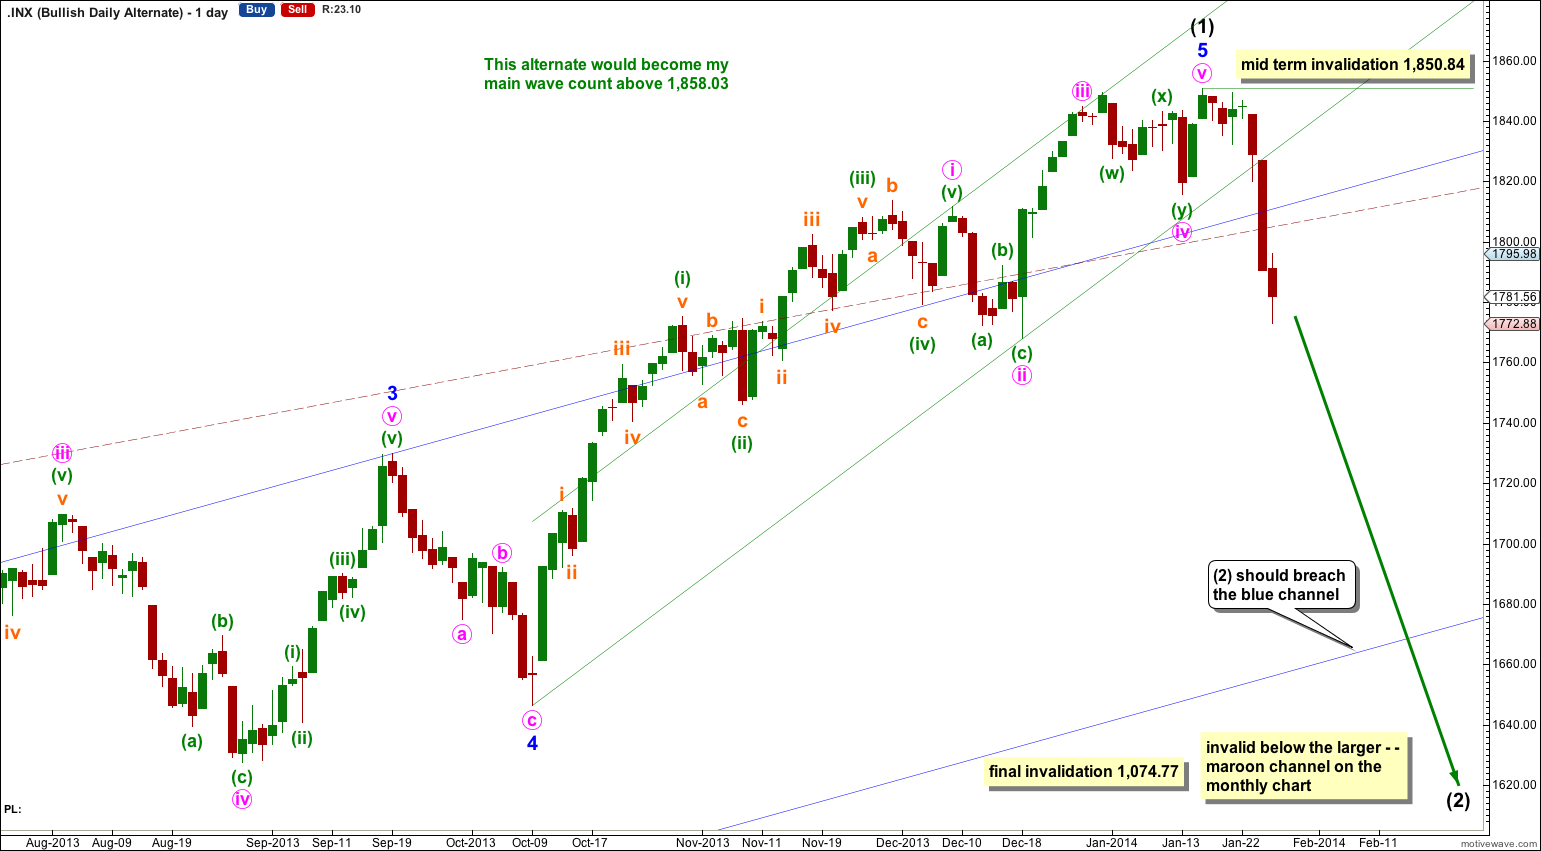
It is possible that a new cycle degree bull market began at 666.79. So far it is not yet halfway through, and I would expect it to last for a few years (at least five more years and probably longer).
In the mid term this bullish wave count may have seen an intermediate degree trend change. Intermediate wave has most likely begun because price is now back in the wider blue and maroon – – – channels.
Intermediate wave (2) must subdivide as a three wave corrective structure. The first downwards movement within it must subdivide as a five and within it no second wave correction may move beyond the start of its first wave. This trend change is invalidated with any movement above 1,850.84.
Intermediate wave (2) downwards should last several weeks to a couple of months or so, and should breach the lower edge of the wide blue channel here on the daily chart.
Intermediate wave (2) should not breach support at the lower edge of the larger maroon – – – channel which is drawn the same way for both wave counts. For this alternate intermediate wave (2) should not breach the lower edge of the acceleration channel drawn about primary waves 1 and 2, one degree higher.