
Yesterday’s analysis expected upwards movement for Tuesday which is exactly what has happened.
It is time again to take a look at the big picture.
Click on the charts below to enlarge.
Main Bearish Wave Count.
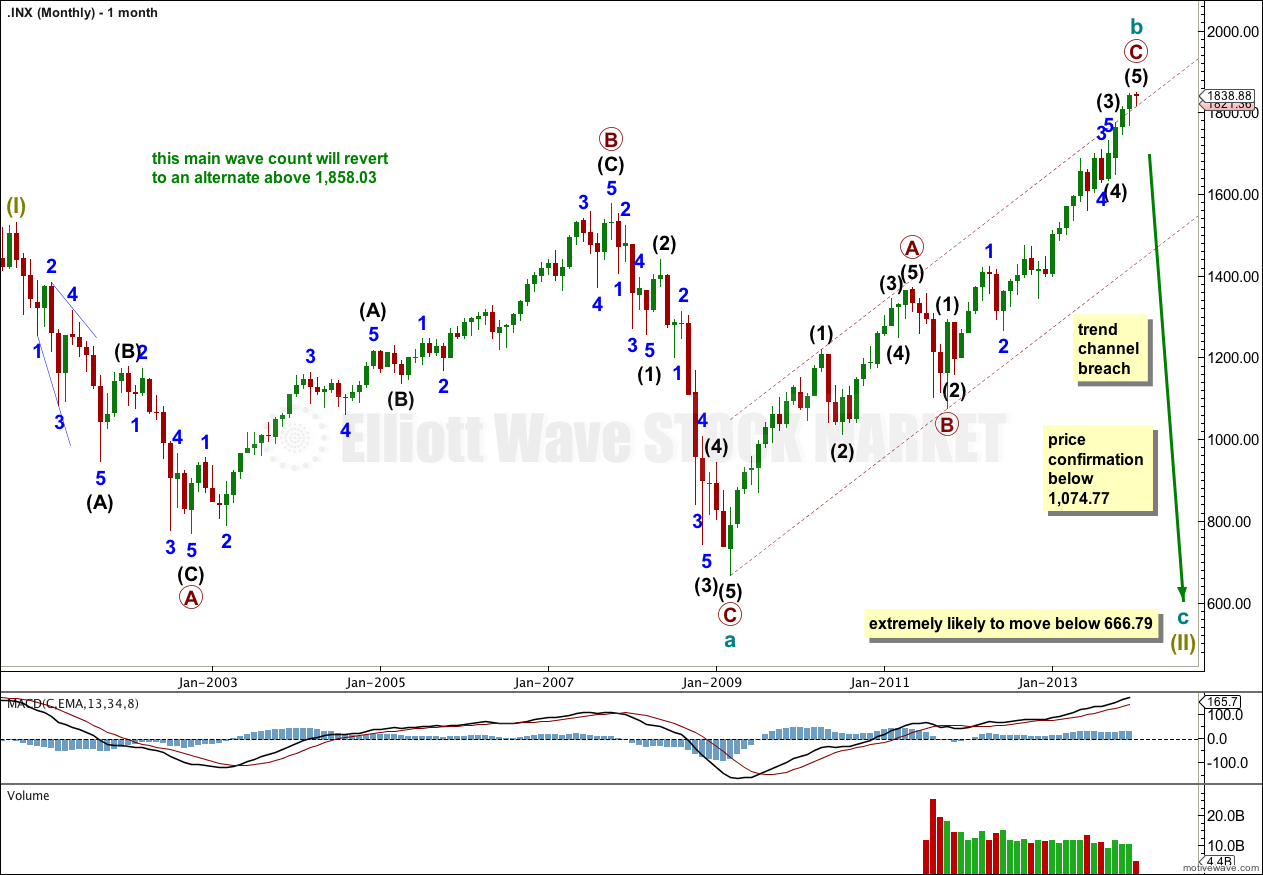
If the correction is not over then it is unfolding as a large flat at super cycle degree. Within the flat cycle wave a subdivides as an expanded flat. Cycle wave b subdivides as a zigzag which is almost complete.
Within the zigzag of cycle wave b primary wave C has slightly breached the upper edge of the channel drawn about the zigzag. This is reasonably common. Primary wave C has passed equality with primary wave A. It may not exhibit a Fibonacci ratio to primary wave A.
When the channel about cycle wave b is clearly breached by downwards movement then that should provide trend channel confirmation that cycle wave b is over and cycle wave c is underway. A clear breach of this channel would see me discard the alternate bullish wave count as at that stage it would have a very low probability.
The super cycle flat wave (II) flat is an expanded flat because cycle wave b is over 105% the length of cycle wave a. This would expect cycle wave c to most likely be 1.618 the length of cycle wave a at 1,397 points in length. C waves of expanded flats most commonly move price substantially beyond the end of their A waves.
There is no lower invalidation point for this wave count.
This wave count has a higher probability than the bullish alternate. Upwards movement over the last 4 years and 10 months subdivides best as a zigzag. If something is “off” about the supposed recovery then it must be a B wave because there is plenty that is off in this scenario in terms of social mood.
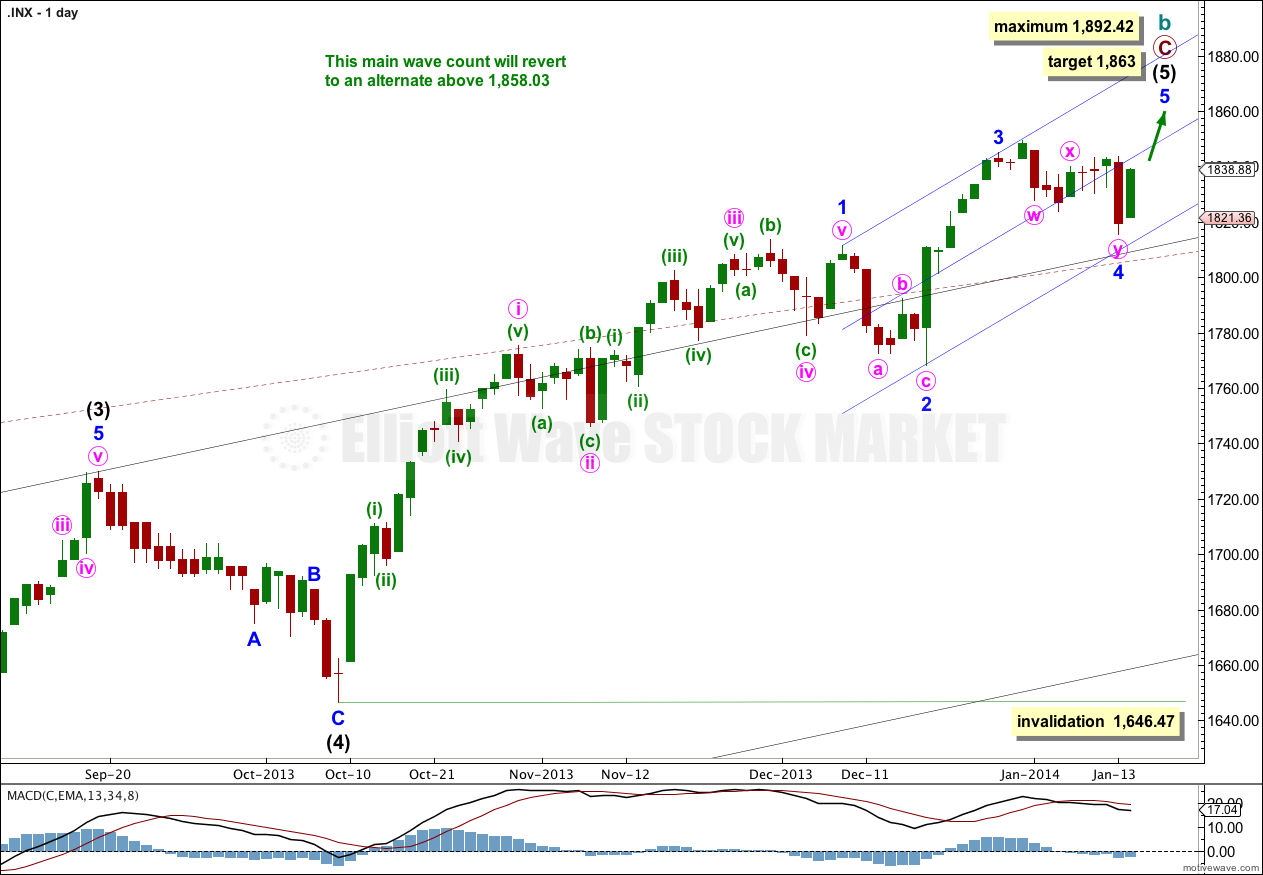
Minor waves 1, 2, 3 and 4 are now complete.
We may be about to see a larger fractal at minor wave degree of the structure within minor wave 1 at minute wave degree; there the first wave was extended, the third wave was shorter, and the fifth wave was shorter still.
Intermediate wave (3) is just 0.76 points short of 2.618 the length of intermediate wave (1). We may not see a Fibonacci ratio between intermediate wave (5) and either of (3) or (1).
At this stage I am not expecting intermediate wave (5) to exhibit a Fibonacci time relationship.
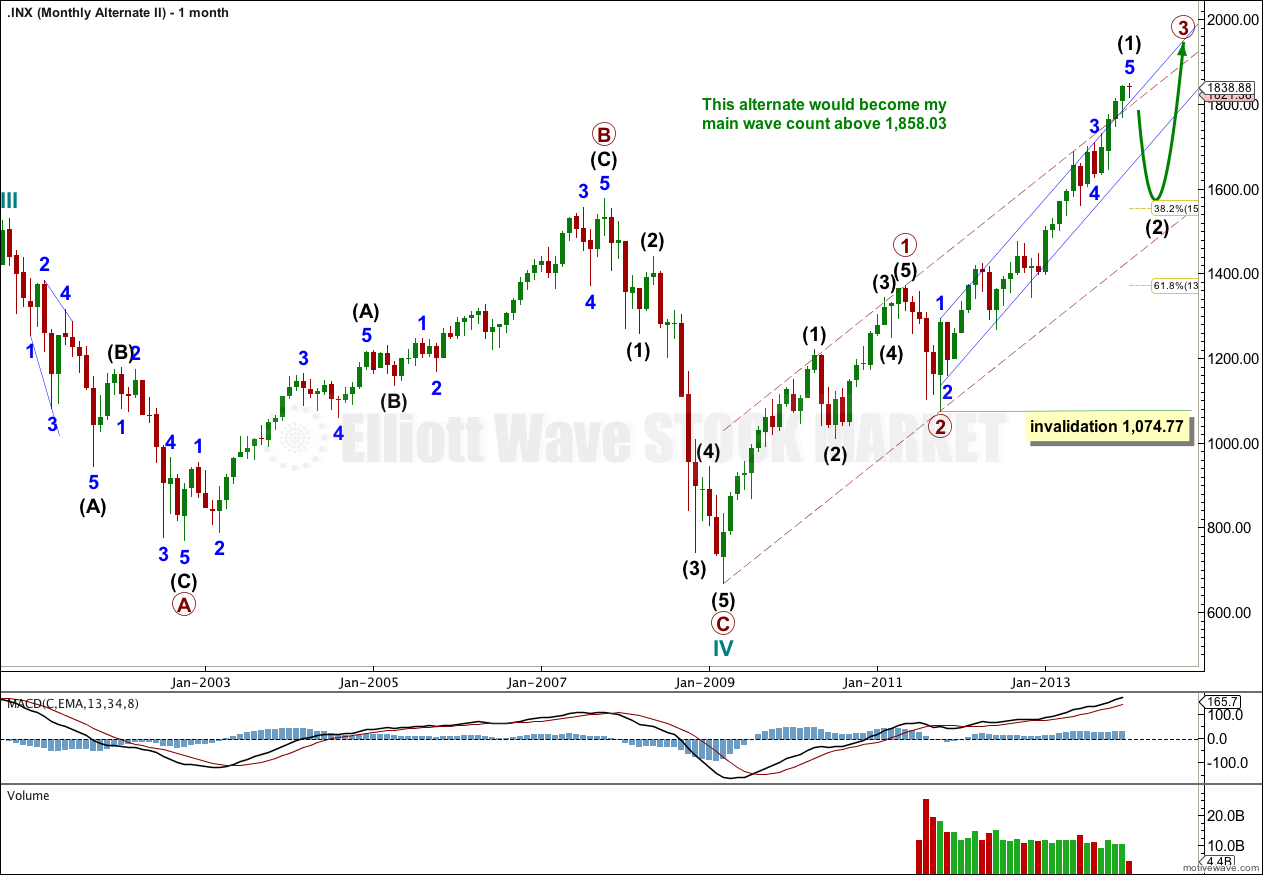
At super cycle degree the structure is an expanded flat correction. Within the flat the maximum common length of cycle wave b is 138% the length of cycle wave a, and this is achieved at 1,858.03. When cycle wave b is longer than the common length of cycle wave a then the probability that an expanded flat is unfolding would reduce and it would be more likely that a long term bull market is underway. Above 1,858.03 I will swap this main wave count over with the bullish alternate.
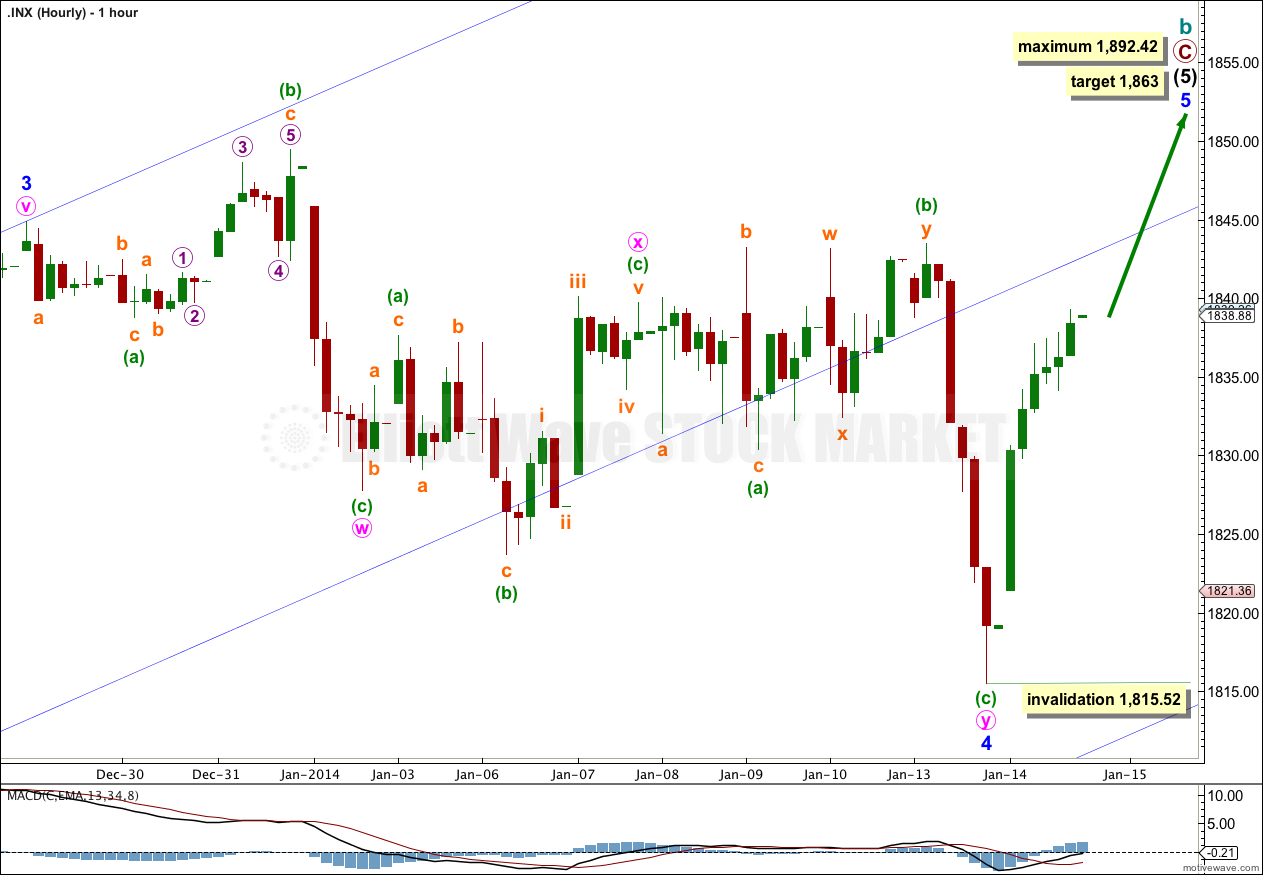
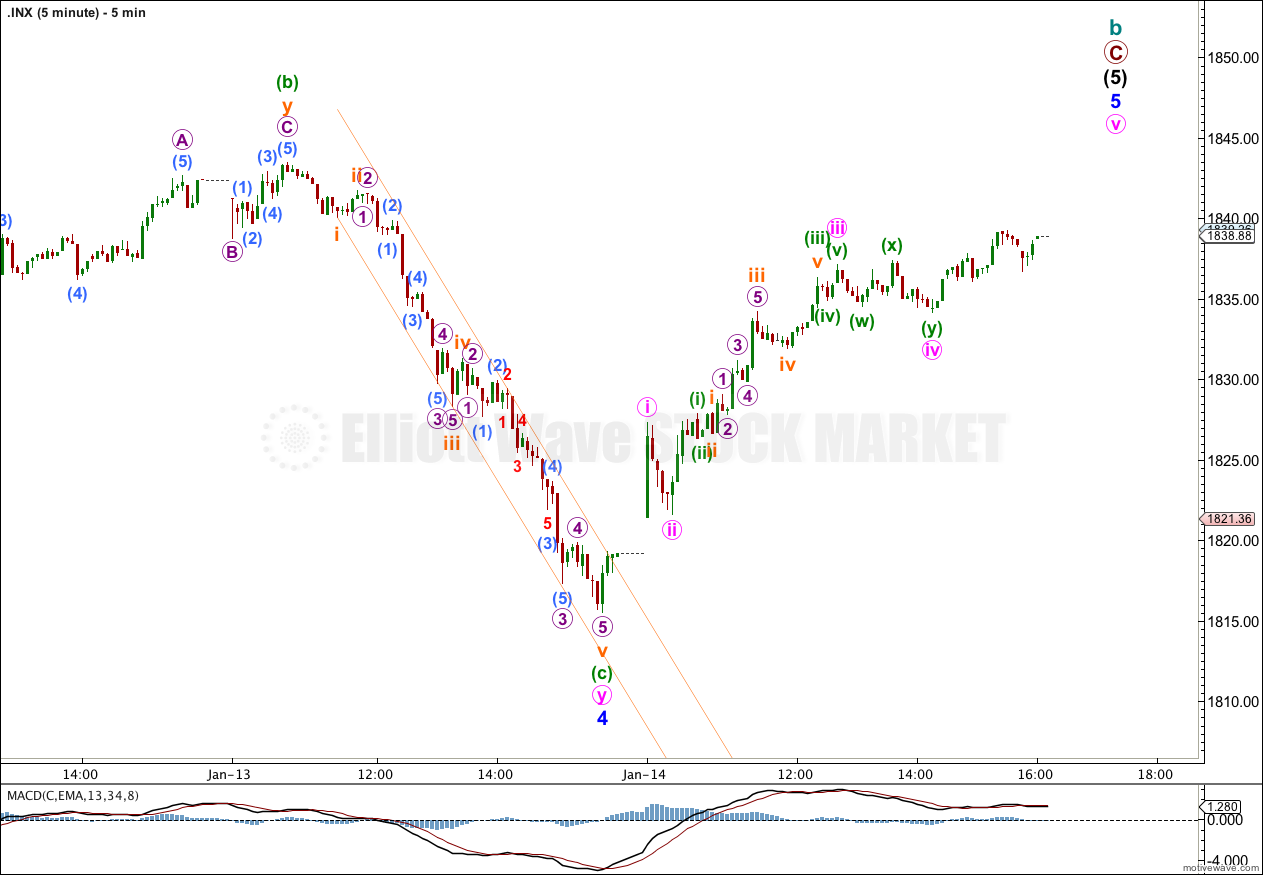
Within minor wave 5 there is an incomplete impulse upwards; on the five minute chart the structure of the fifth wave is incomplete. This may be minor wave 5 nearing completion quickly, or it may only be minute wave i within minor wave 5 nearing completion (if the labeling within minor wave 5 on the five minute chart below is moved down one degree).
If we are yet to see a second wave correction within minor wave 5 then minute wave ii may not move beyond the start of minute wave i. This wave count is invalidated with movement below 1,815.52.
I would expect minor wave 5 to end about the mid line of this parallel channel.
Bullish Alternate Wave Count.
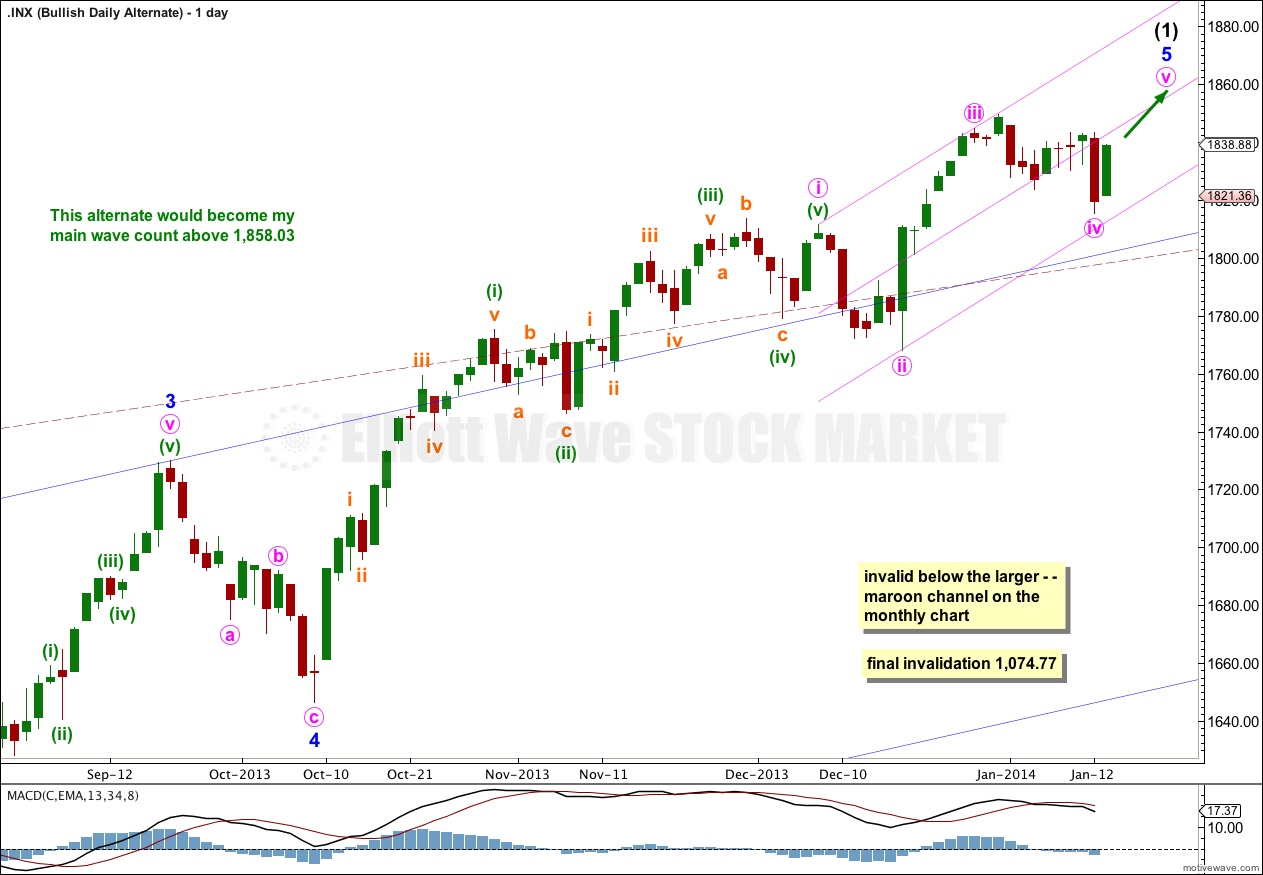
In the short term at the daily chart level this bullish wave count does not diverge from the main wave count, but at the monthly chart level and in the mid term it differs significantly.
If the correction was over at 666.79 in March, 2009 then a new bull market to last one to several years may have begun there.
Within this possible bull market the middle of the third wave has not yet passed, because although upwards momentum shows an increase it does not correspond with a strong upper breach of the parallel channel.
This parallel – – – maroon channel is drawn in exactly the same way for both wave counts. For the main wave count it is a corrective channel, for this alternate it is termed an acceleration channel. Third waves should strongly breach and remain above acceleration channels.
The narrower blue channel is drawn using Elliott’s technique about intermediate wave (1). I would expect intermediate wave (2) downwards to breach this channel clearly, but to not breach the lower edge of the larger maroon – – – acceleration channel. Second waves should not breach the lower edge of an acceleration channel drawn about a first and second wave one degree higher (very occasionally they do, but it is unusual).
This wave count would expect a second wave correction which must subdivide as a corrective structure and may last a few weeks to a couple of months or so. It should find support and remain within the acceleration channel.
Intermediate wave (2) may not move beyond the start of intermediate wave (1). This wave count is invalidated with movement below 1,074.77.
It is possible that a new cycle degree bull market began at 666.79. So far it is not yet halfway through, and I would expect it to last for a few years (at least five more years and probably longer).
The current upwards impulse, labeled intermediate wave (5) for the main wave count and minor wave 5 for this alternate is incomplete. The structure within the final fifth wave is the same, and the structure on the hourly chart is the same. Targets would be the same for this bullish wave count. This wave count does not diverge with the main wave count, and it will not for several weeks or a couple of months or so yet.