
Yesterday’s analysis expected Thursday’s session to begin with some upwards movement towards a short term target at 1,841 and then to move lower towards a target at 1,828 – 1,825.
Price began with upwards movement for Thursday, reaching 1,843.23 before moving lower. The lower target was not met and the structure is incomplete. Now that there is more structure to analyse I can calculate a more accurate target for you.
I have a new alternate hourly wave count.
Click on the charts below to enlarge.
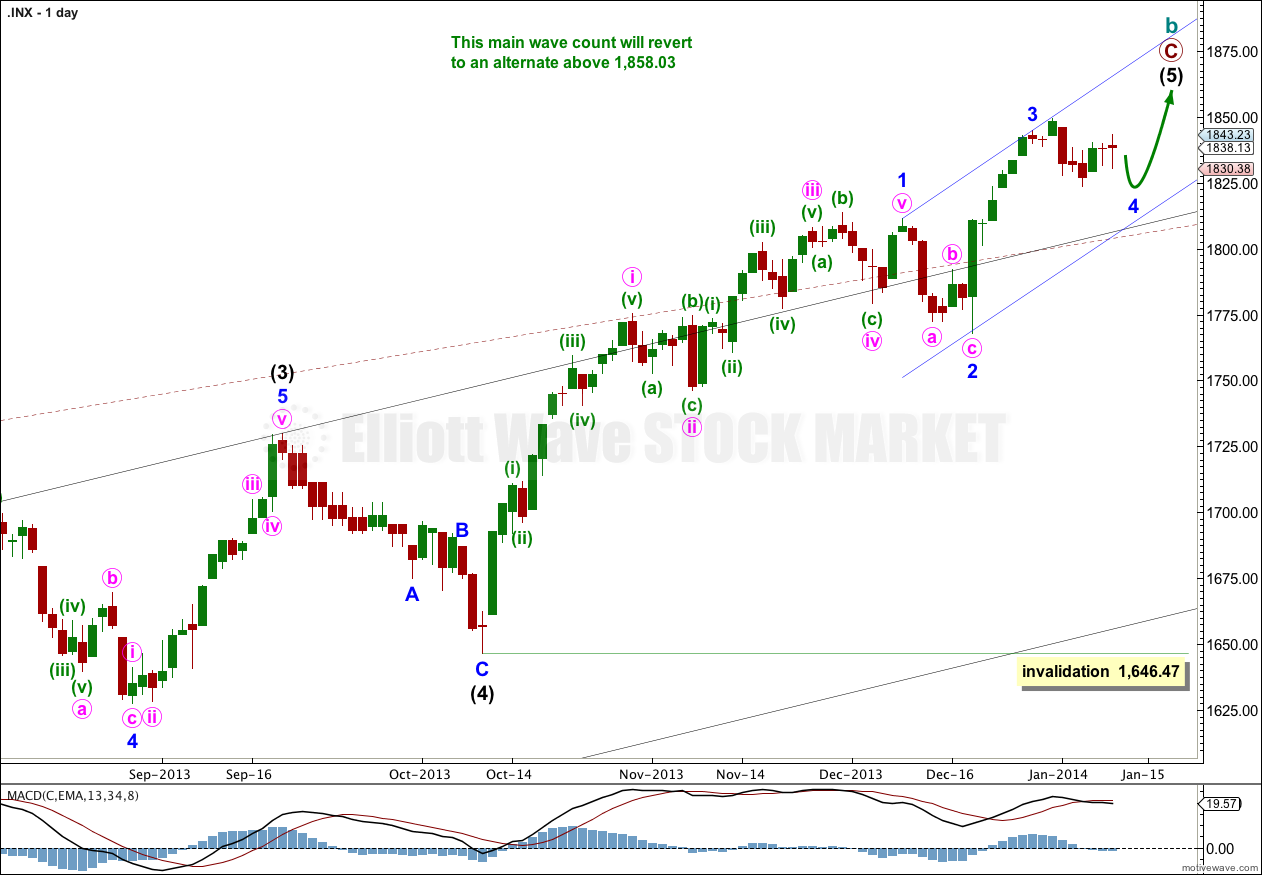
This wave count has a higher probability than the bullish alternate. Upwards movement over the last 4 1/2 years subdivides best as a zigzag. If something is “off” about the supposed recovery then it must be a B wave because there is plenty that is off in this scenario in terms of social mood.
Minor waves 1, 2 and 3 are complete. Minor wave 4 is either incomplete and may continue for another one or two days having no Fibonacci time relationship (main hourly wave count), or it was over 1,823.73 and lasted a Fibonacci five days (alternate hourly wave count).
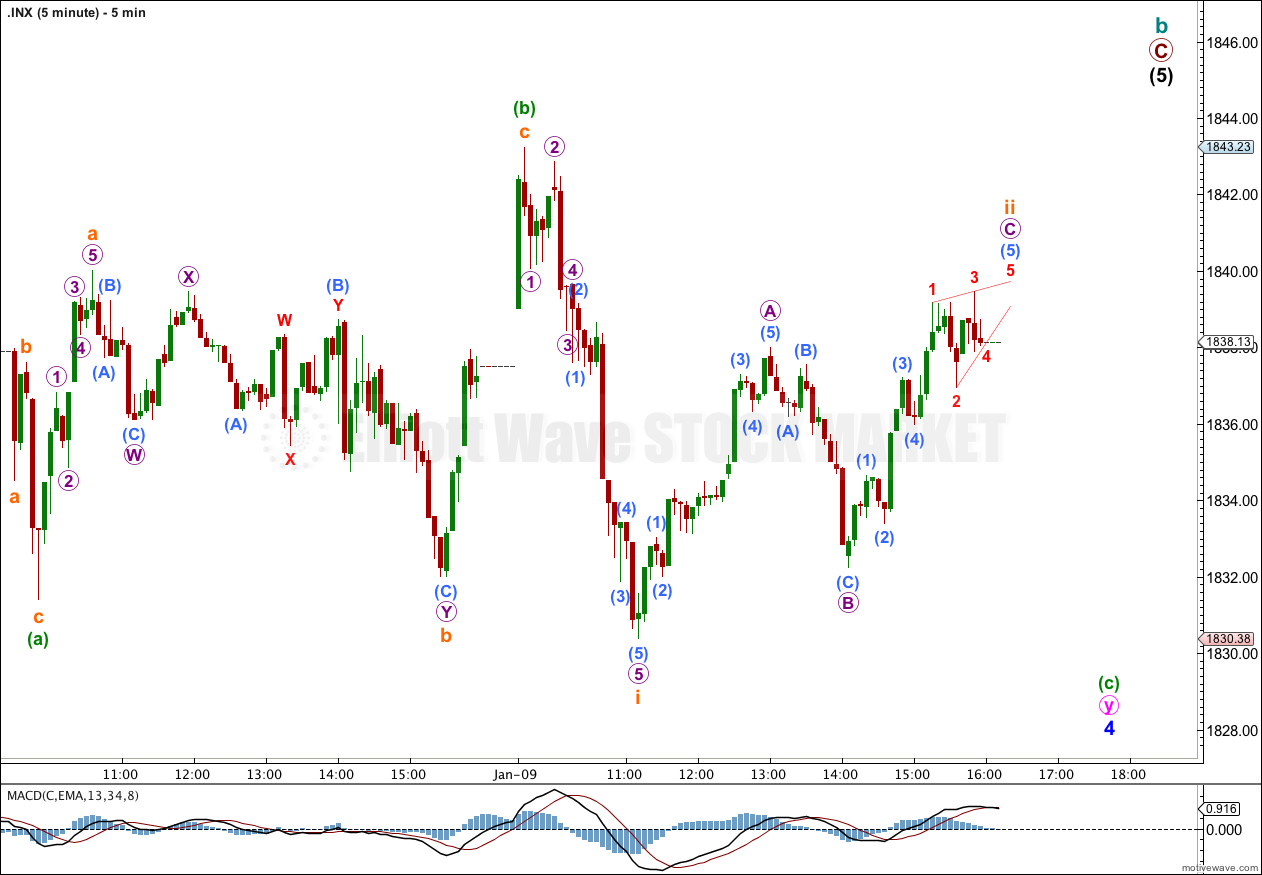
We may be about to see a larger fractal at minor wave degree of the structure within minor wave 1 at minute wave degree; there the first wave was extended, the third wave was shorter, and the fifth wave was shorter still.
Intermediate wave (3) is just 0.76 points short of 2.618 the length of intermediate wave (1). We may not see a Fibonacci ratio between intermediate wave (5) and either of (3) or (1).
Intermediate wave (1) lasted 18 days. Intermediate wave (5) may last a total of a Fibonacci 89 days which would see it end on 10th February, 2014. However, Fibonacci time relationships are not very reliable for the S&P. This is a rough guideline only,
At super cycle degree the structure is an expanded flat correction. Within the flat the maximum common length of cycle wave b is 138% the length of cycle wave a, and this is achieved at 1,858.03. When cycle wave b is longer than the common length of cycle wave a then the probability that an expanded flat is unfolding would reduce and it would be more likely that a long term bull market is underway. Above 1,858.03 I will swap this main wave count over with the bullish alternate.
Main Hourly Wave Count.
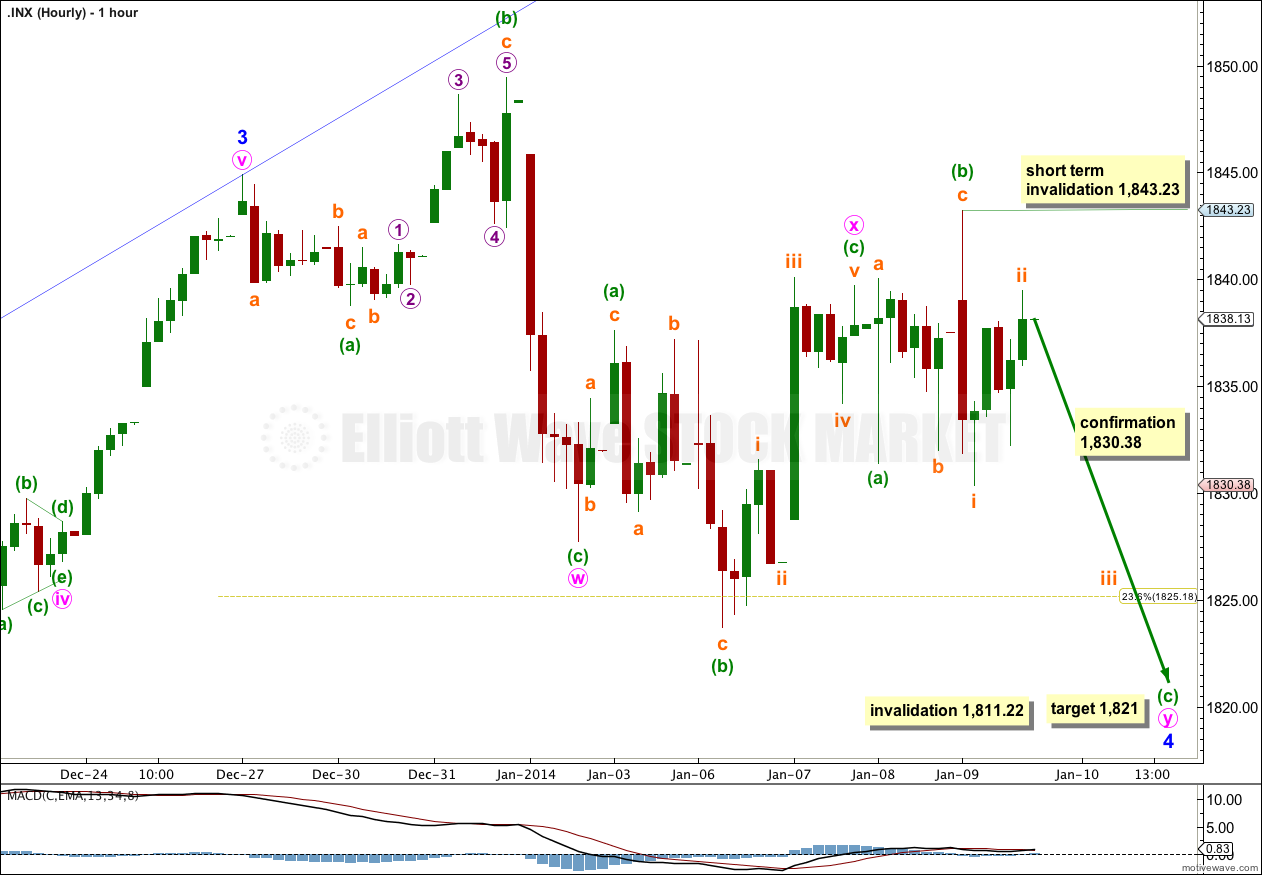
Minute wave y is now closer to completion. It looks like minor wave 4 may not exhibit a Fibonacci time relationship and last longer than a Fibonacci eight days.
I do not think minute wave y was over at Thursday’s low of 1,830.38 because then it would be out of proportion to minute wave w and would have ended higher than minute wave w. This downwards wave is most likely to be just subminuette wave i within minuette wave (c).
Minuette wave (b) within minute wave y is a 142% correction of minuette wave (a). Because this is a long B wave in relation to its A wave, I would expect minuette wave (c) to most likely be 2.618 the length of minuette wave (a) at 1,821.
I would expect downwards movement for one or two sessions to complete this structure. Movement below 1,830.38 would invalidate the alternate below and provide confirmation for this main wave count.
Within minuette wave (c) subminuette wave ii may not move beyond the start of subminuette wave i. This wave count is invalidated tomorrow with movement above 1,843.23.
Minor wave 4 may not move into minor wave 1 price territory. This wave count is invalidated with movement below 1,811.22.
Alternate Hourly Wave Count.
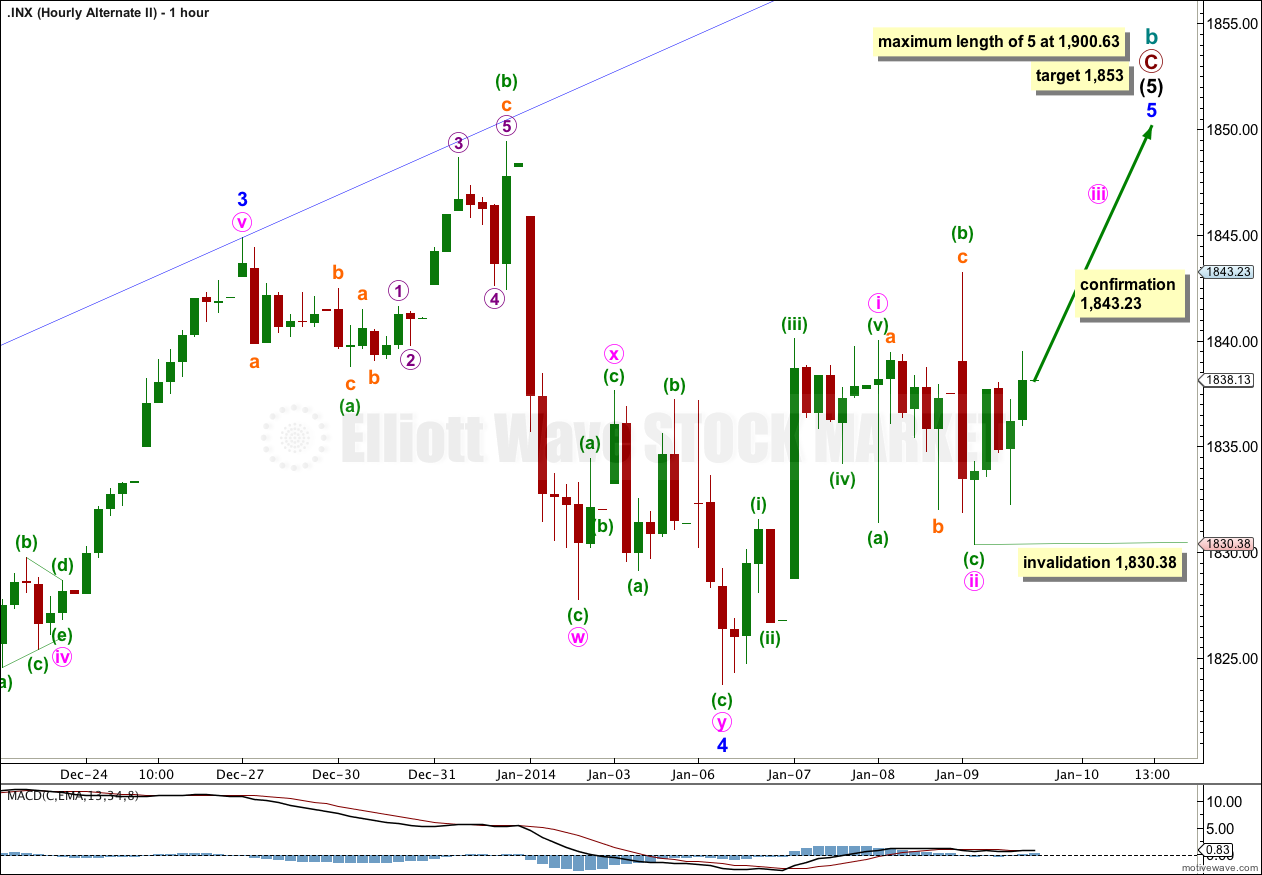
If the main hourly wave count is invalidated tomorrow with movement above 1,843.23 then this alternate would be a good explanation.
Minor wave 4 may have been over in four days as a double flat correction. The problem with this wave count, and the reason it has a lower probability than the main hourly wave count, is the brevity of minute wave y in comparison to minute wave w. Also, minute wave y ends lower than minute wave w and the whole structure of this possible double flat has a downwards slope and look, not sideways which is what double flats should look like.
At 1,853 minor wave 5 would reach 0.382 the length of minor wave 3.
At 1,900.63 minor wave 5 would reach equality with minor wave 3. This is the maximum allowable length for minor wave 5 because minor wave 3 may not be the shortest wave.
Within minute wave iii no second wave correction may move beyond the start of its first wave. This wave count is invalidated with movement below 1,830.38.
Bullish Alternate Wave Count.
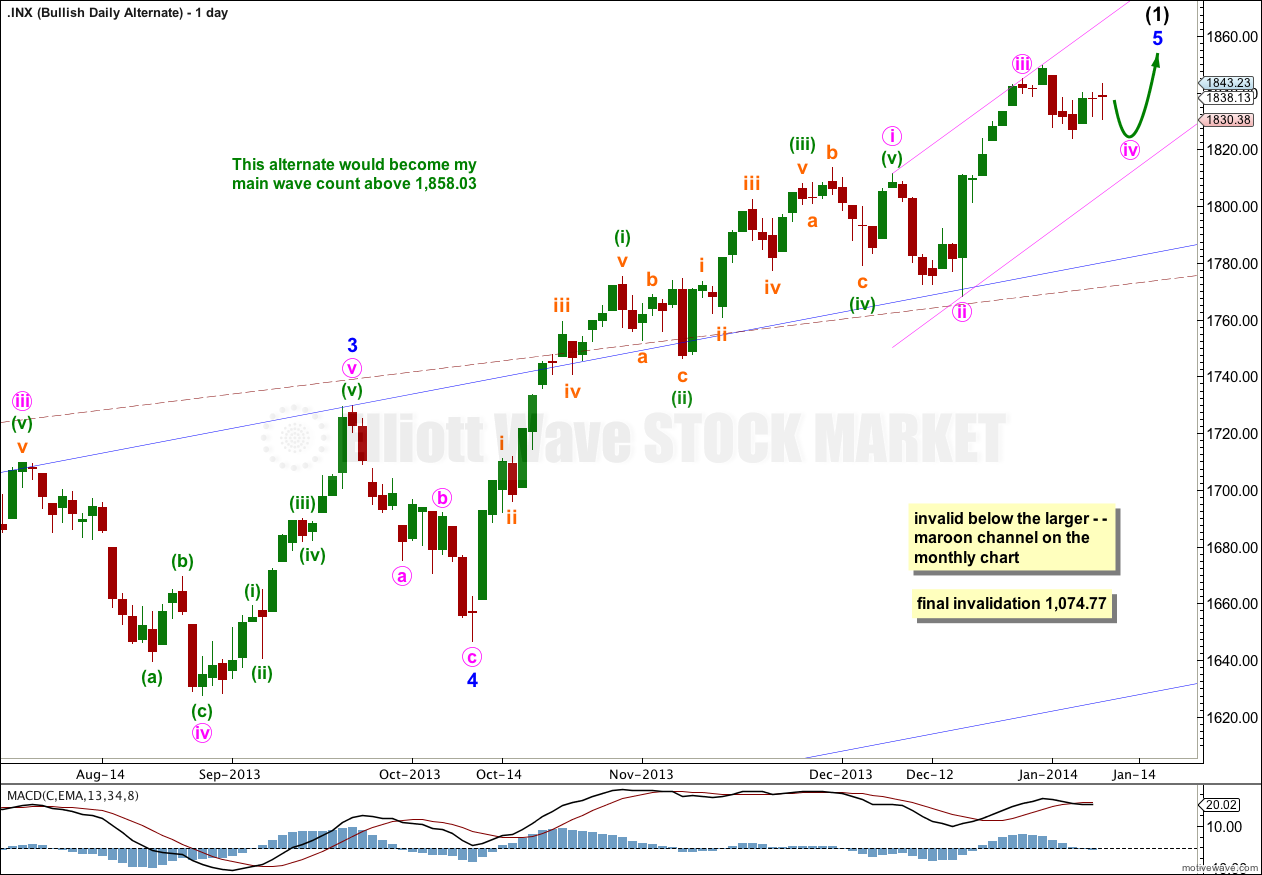
It is possible that a new cycle degree bull market began at 666.79. So far it is not yet halfway through, and I would expect it to last for a few years (at least five more years and probably longer).
The current upwards impulse, labeled intermediate wave (5) for the main wave count and minor wave 5 for this alternate is incomplete. The structure within the final fifth wave is the same, and the structure on the hourly chart is the same. Targets would be the same for this bullish wave count. This wave count does not diverge with the main wave count, and it will not for several weeks or a couple of months or so yet.
The maroon – – – channel is an acceleration channel drawn about primary waves 1 and 2 on the monthly chart (it is drawn in exactly the same way on the main wave count, but there it is termed a corrective channel). I would not expect intermediate wave (2) to breach this channel because a lower degree (intermediate) wave should not breach an acceleration channel of a higher degree (primary) first and second wave.