
Last analysis expected downwards movement for Thursday’s session to a short term target at 1,833. Price moved lower, reaching 5.26 points below the target.
I have two hourly wave counts for you today.
Click on the charts below to enlarge.
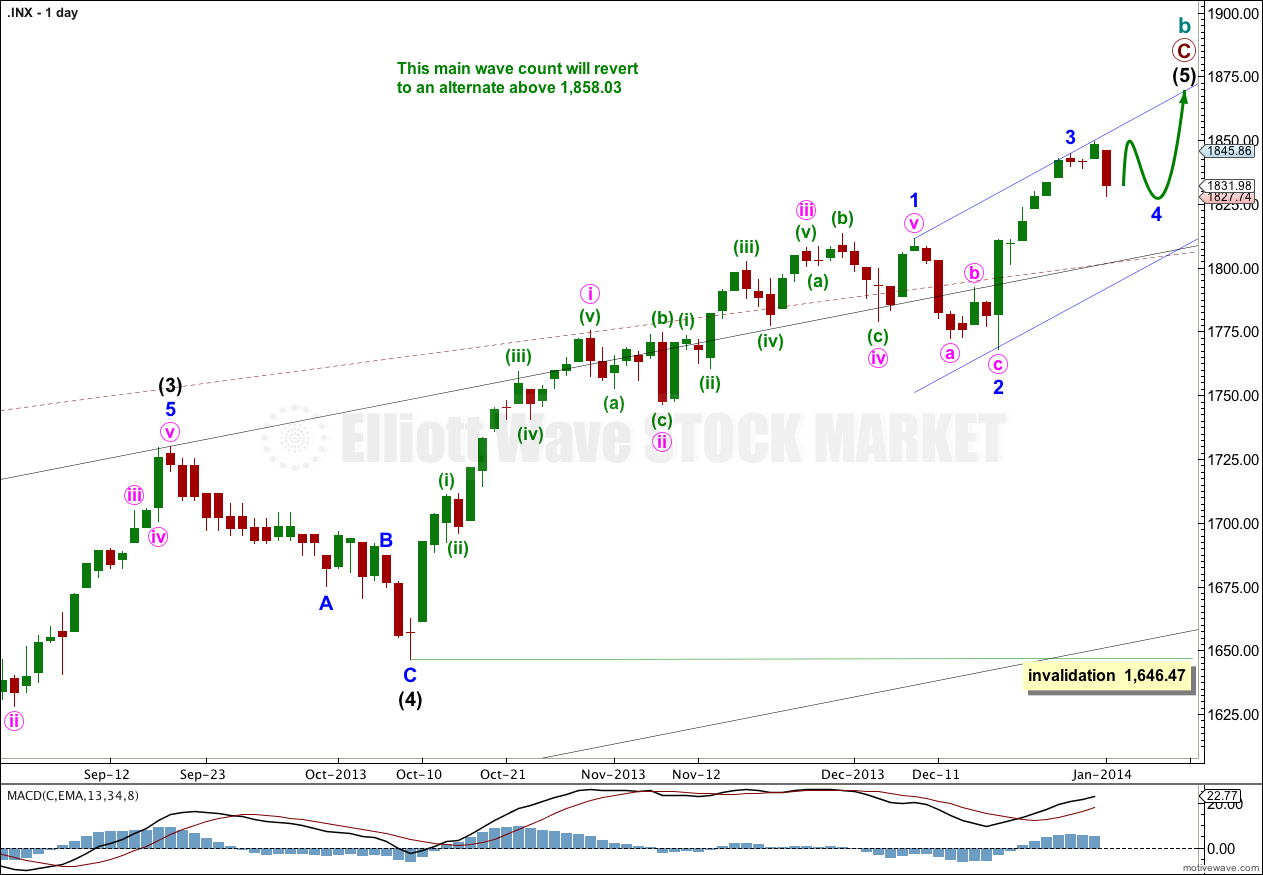
This wave count has a higher probability than the bullish alternate. Upwards movement over the last 4 1/2 years subdivides best as a zigzag. If something is “off” about the supposed recovery then it must be a B wave because there is plenty that is off in this scenario in terms of social mood.
We should always assume the trend remains the same, until proven otherwise. This is a huge trend change. I will assume we are yet to see new highs while price remains above 1,646.47.
Minor waves 1, 2 and 3 are complete. Minor wave 4 is either halfway done, or has just ended.
We may be about to see a larger fractal at minor wave degree of the structure within minor wave 1 at minute wave degree; there the first wave was extended, the third wave was shorter, and the fifth wave was shorter still.
Intermediate wave (3) is just 0.76 points short of 2.618 the length of intermediate wave (1). We may not see a Fibonacci ratio between intermediate wave (5) and either of (3) or (1).
Intermediate wave (1) lasted 18 days. Intermediate wave (5) may last a total of a Fibonacci 89 days which would see it end on 10th February, 2014. However, Fibonacci time relationships are not very reliable for the S&P. This is a rough guideline only,
At super cycle degree the structure is an expanded flat correction. Within the flat the maximum common length of cycle wave b is 138% the length of cycle wave a, and this is achieved at 1,858.03. When cycle wave b is longer than the common length of cycle wave a then the probability that an expanded flat is unfolding would reduce and it would be more likely that a long term bull market is underway. Above 1,858.03 I will swap this main wave count over with the bullish alternate.
Main Hourly Wave Count.
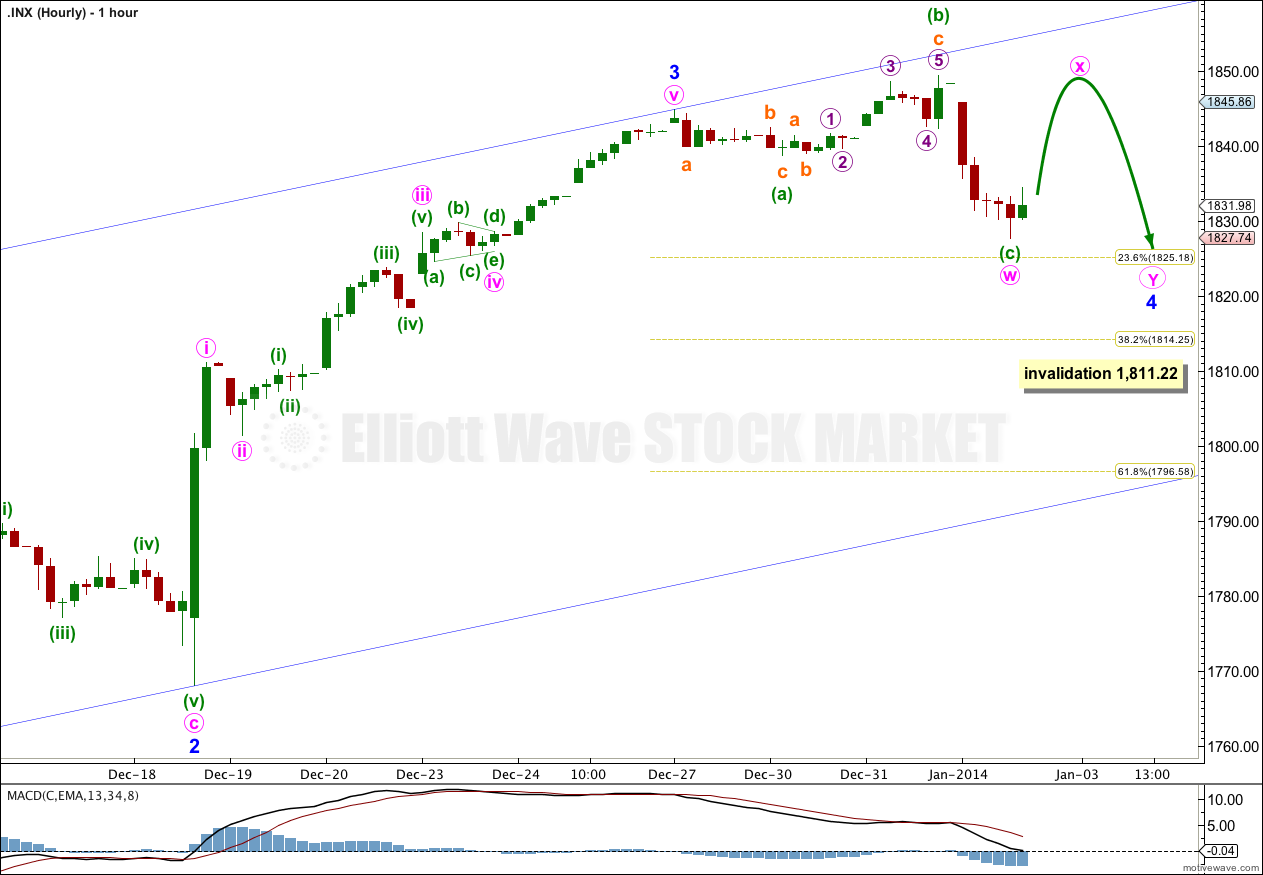
Downwards movement has completed an expanded flat correction. Within it minuette wave (b) is a 174% correction of minuette wave (a), and minuette wave (c) has no Fibonacci ratio to minuette wave (a).
This is the main hourly wave count because I would expect minor wave 4 to last longer than three days to be better in proportion to minor wave 2 which lasted seven days. This first flat correction may be the first structure in a double flat or double combination.
The purpose of double flats and double combinations is to take up time and move price sideways. I would expect minor wave 4 to finally end about the same level as minute wave w at 1,827.74, and to not move significantly lower than this point.
The two structures in the double should be joined by a three wave structure in the opposite direction which would be labeled minute wave x. This upwards movement is most likely to be a zigzag, but it may be any corrective structure (including a multiple).
This main hourly wave count expects a three wave structure upwards to unfold over one or two days. It should end about 1,844.89, but it may make a new high above this point.
Minor wave 4 may not move into minor wave 1 price territory. This wave count is invalidated with movement below 1,811.22.
Alternate Hourly Wave Count.
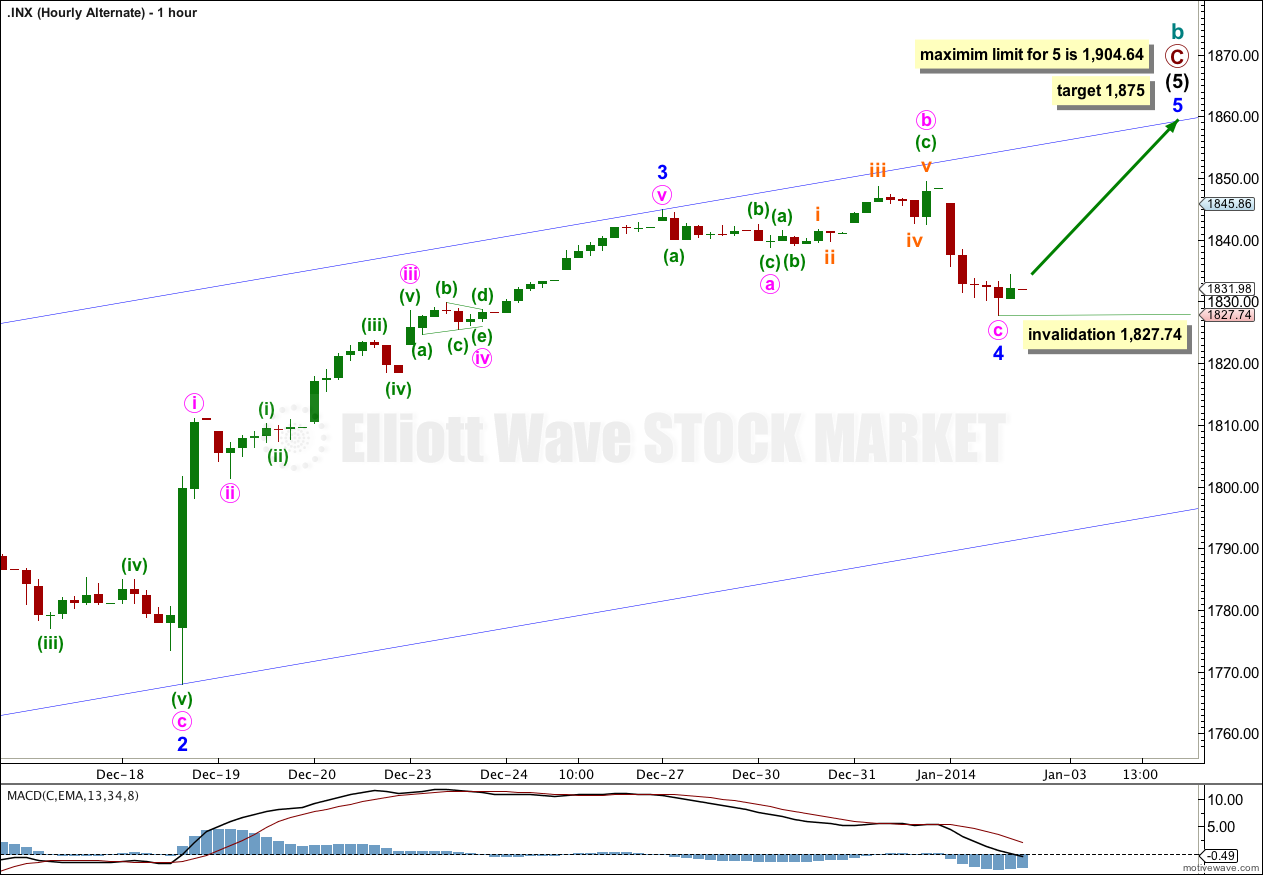
Although it would be somewhat out of proportion to minor wave 2 it is still possible that minor wave 4 could have ended during Thursday’s session as a single expanded flat correction.
This alternate wave count expects minor wave 5 to begin from here. The next upwards movement, a first wave within minor wave 5, must subdivide as a five wave structure.
Unfortunately, there is no specific price point which differentiates these two hourly wave counts. We will have to pay careful attention to the structure of the next upwards wave to determine whether or not minor wave 4 is over; if it is a three then minor wave 4 is continuing, if it is a five then minor wave 4 is over.
At 1,875 minor wave 5 would reach 0.618 the length of minor wave 3.
At 1,904.64 minor wave 5 would reach equality in length with minor wave 3. Because minor wave 3 is shorter than minor wave 1, and because a third wave may never be the shortest wave, this limits minor wave 5.
Within minor wave 5 no second wave correction may move beyond the start of its first wave. This wave count is invalidated with movement below 1,827.74.
Bullish Alternate Wave Count.
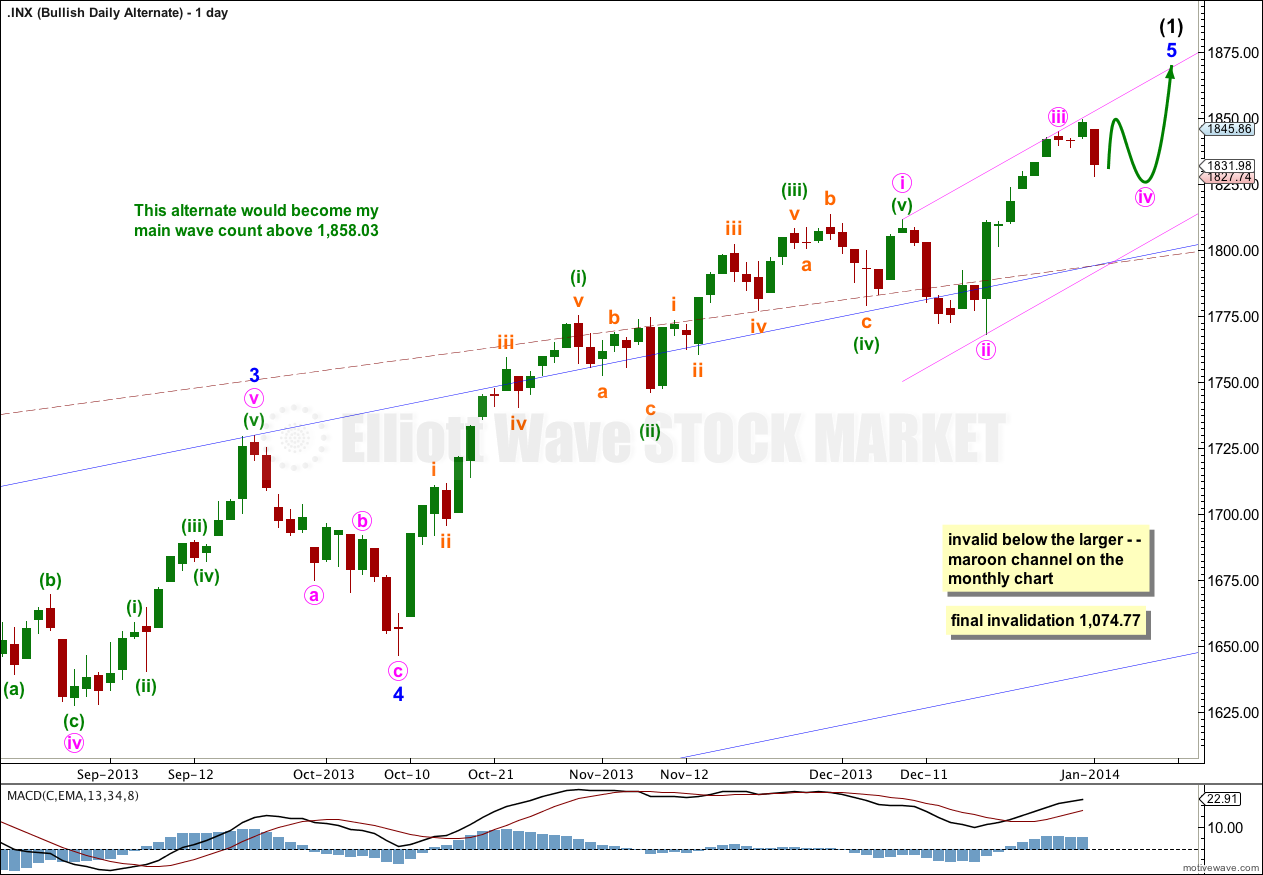
It is possible that a new cycle degree bull market began at 666.79. So far it is not yet halfway through, and I would expect it to last for a few years (at least five more years and probably longer).
The current upwards impulse, labeled intermediate wave (5) for the main wave count and minor wave 5 for this alternate is incomplete. The structure within the final fifth wave is the same, and the structure on the hourly chart is the same. Targets would be the same for this bullish wave count. This wave count does not diverge with the main wave count, and it will not for several weeks or a couple of months or so yet.
The maroon – – – channel is an acceleration channel drawn about primary waves 1 and 2 on the monthly chart (it is drawn in exactly the same way on the main wave count, but there it is termed a corrective channel). I would not expect intermediate wave (2) to breach this channel because a lower degree (intermediate) wave should not breach an acceleration channel of a higher degree (primary) first and second wave.