
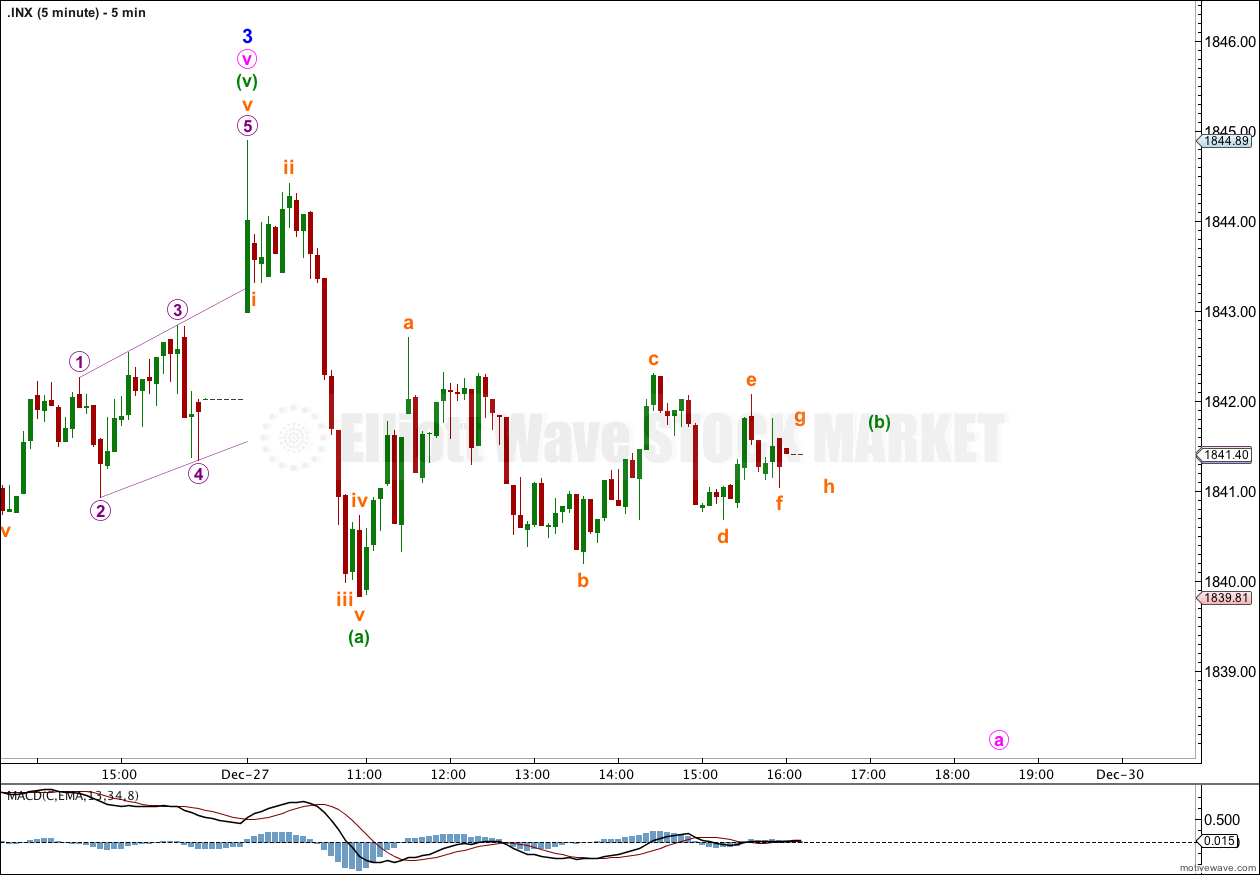
Last analysis expected choppy overlapping movement to begin and last for five to eight days. Friday’s session was very quiet and produced a small red candlestick which fits nicely with the wave count.
The wave count remains mostly the same.
Click on the charts below to enlarge.
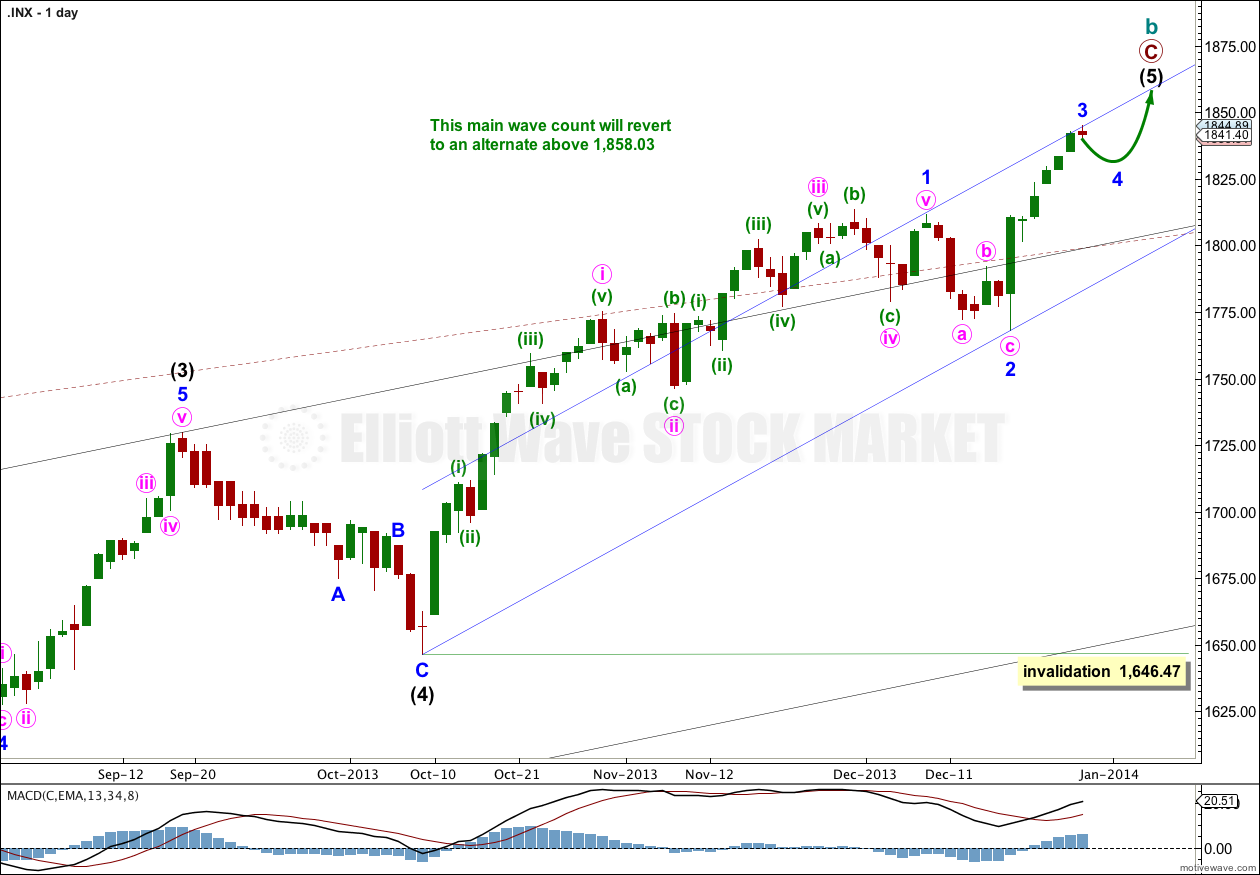
This wave count has a higher probability than the bullish alternate. Upwards movement over the last 4 1/2 years subdivides best as a zigzag. If something is “off” about the supposed recovery then it must be a B wave because there is plenty that is off in this scenario in terms of social mood.
We should always assume the trend remains the same, until proven otherwise. This is a huge trend change. I will assume we are yet to see new highs while price remains above 1,646.47.
Minor waves 1 and now also 2 are most likely complete. Minor wave 3 upwards may have begun. I have drawn an acceleration channel about minor waves 1 and 2. Minor wave 3 may have found resistance at the upper trend line and may have ended there. The lower trend line should provide support for corrections within minor wave 3.
We may be about to see a larger fractal at minor wave degree of the structure within minor wave 1 at minute wave degree; there the first wave was extended, the third wave was shorter, and the fifth wave was shorter still.
Intermediate wave (3) is just 0.76 points short of 2.618 the length of intermediate wave (1). We may not see a Fibonacci ratio between intermediate wave (5) and either of (3) or (1).
Intermediate wave (1) lasted 18 days. So far intermediate wave (5) has lasted 53 days. It may last a total of a Fibonacci 89 days which would see it end on 10th February, 2014. However, Fibonacci time relationships are not very reliable for the S&P. This is a rough guideline only,
At super cycle degree the structure is an expanded flat correction. Within the flat the maximum common length of cycle wave b is 138% the length of cycle wave a, and this is achieved at 1,858.03. When cycle wave b is longer than the common length of cycle wave a then the probability that an expanded flat is unfolding would reduce and it would be more likely that a long term bull market is underway. Above 1,858.03 I will swap this main wave count over with the bullish alternate.
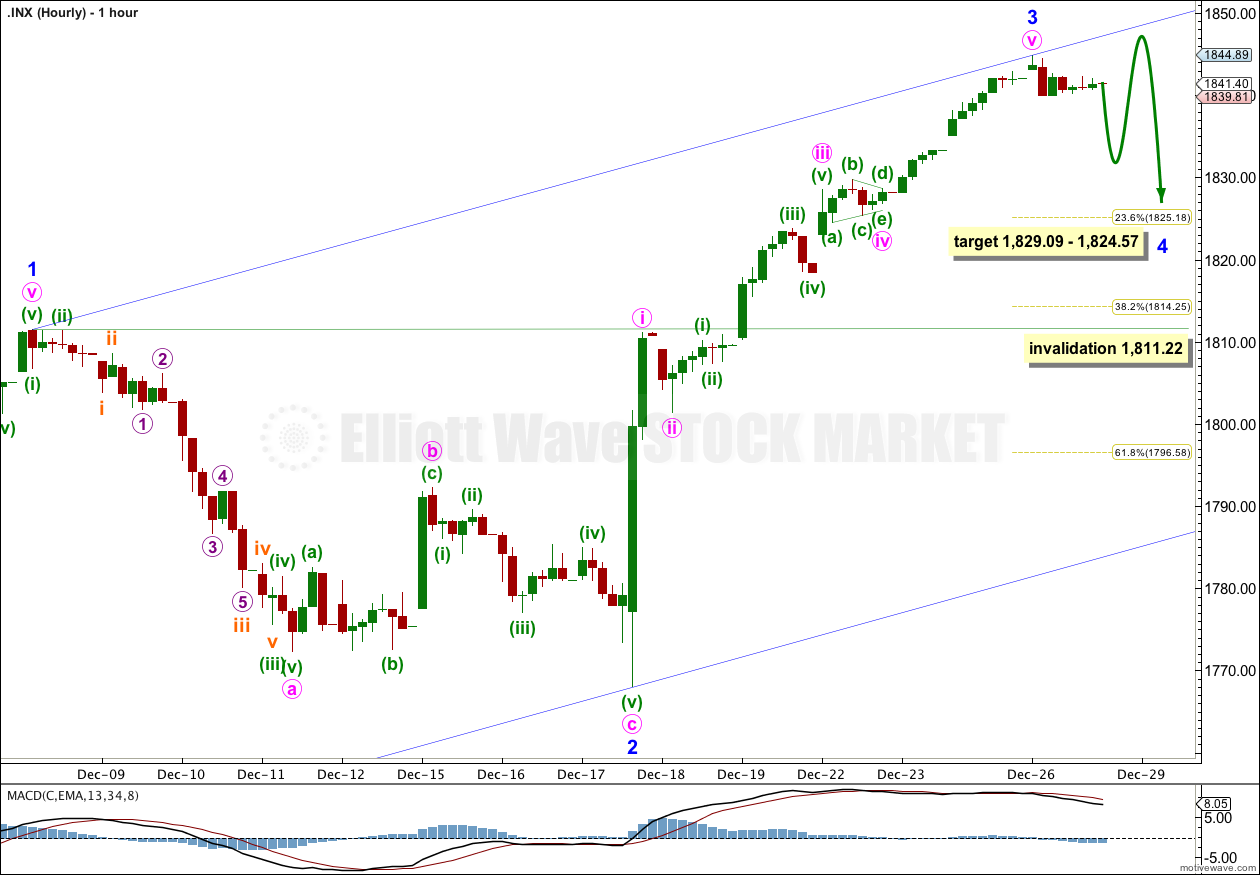
Friday began with a slight new high, and this fits best as an end to minor wave 3. It still looks like minor wave 3 is complete and has no Fibonacci ratio to minor wave 1. This makes it more likely we shall see a Fibonacci ratio exhibited between minor wave 5 and either of 3 or 1.
Minor wave 2 lasted seven days and was a shallow 26% zigzag. Given the guideline of alternation I would expect to see alternation for minor wave 4 in structure and / or depth of correction.
At this early stage it is impossible to tell which of the 13 possible corrective structures minor wave 4 will unfold as. It is only possible to say that a zigzag is the least likely. Some possible structures, such as an expanded flat or running triangle, may include a new high above 1,844.85 and so there is no upper invalidation point for this fourth wave.
Minor wave 4 is quite likely to unfold as a flat correction in order to exhibit alternation with the zigzag of minor wave 2. The most common type of flat is an expanded flat which must include a new high above 1,844.85, and so this is reasonably likely.
I am still expecting more choppy overlapping movement for minor wave 4 for another four to seven days.
Minor wave 4 is likely to end within the price territory of the fourth wave of one lesser degree (minute wave iv price territory is between 1,829.09 and 1,824.57).
Minor wave 4 may not move into minor wave 1 price territory. This wave count is invalidated with movement below 1,811.22.
Bullish Alternate Wave Count.
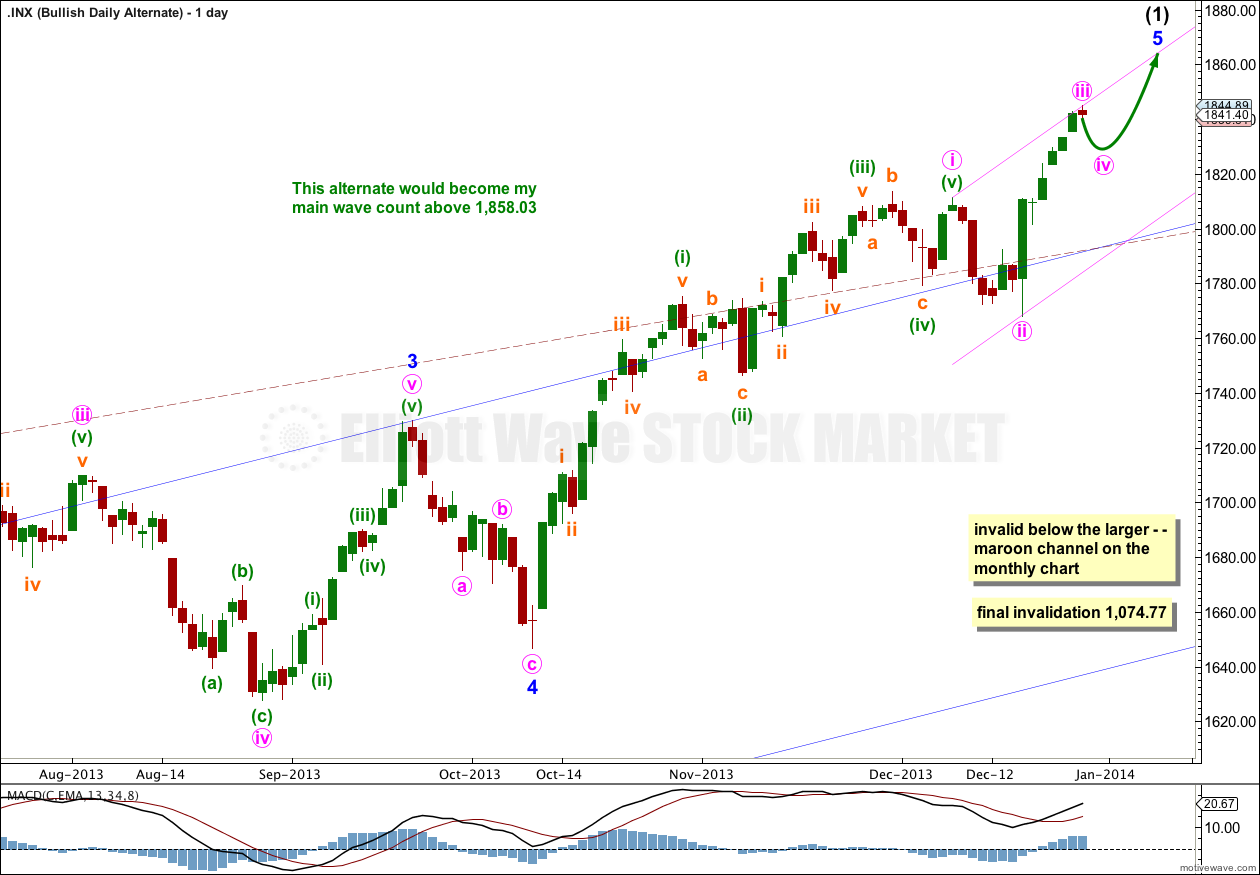
It is possible that a new cycle degree bull market began at 666.79. So far it is not yet halfway through, and I would expect it to last for a few years (at least five more years and probably longer).
The current upwards impulse, labeled intermediate wave (5) for the main wave count and minor wave 5 for this alternate is incomplete. The structure within the final fifth wave is the same, and the structure on the hourly chart is the same. Targets would be the same for this bullish wave count. This wave count again does not diverge with the main wave count, and it will not for several weeks or a a couple of months or so yet.
The maroon – – – channel is an acceleration channel drawn about primary waves 1 and 2 on the monthly chart (it is drawn in exactly the same way on the main wave count, but there it is termed a corrective channel). I would not expect intermediate wave (2) to breach this channel because a lower degree (intermediate) wave should not breach an acceleration channel of a higher degree (primary) first and second wave.