
Last analysis expected a little more downwards movement to complete a small fourth wave correction before the upwards trend resumed.
Price did not move lower. The correction completed as a sideways moving triangle, and was followed by more upwards movement.
The wave counts remain the same.
Click on the charts below to enlarge.
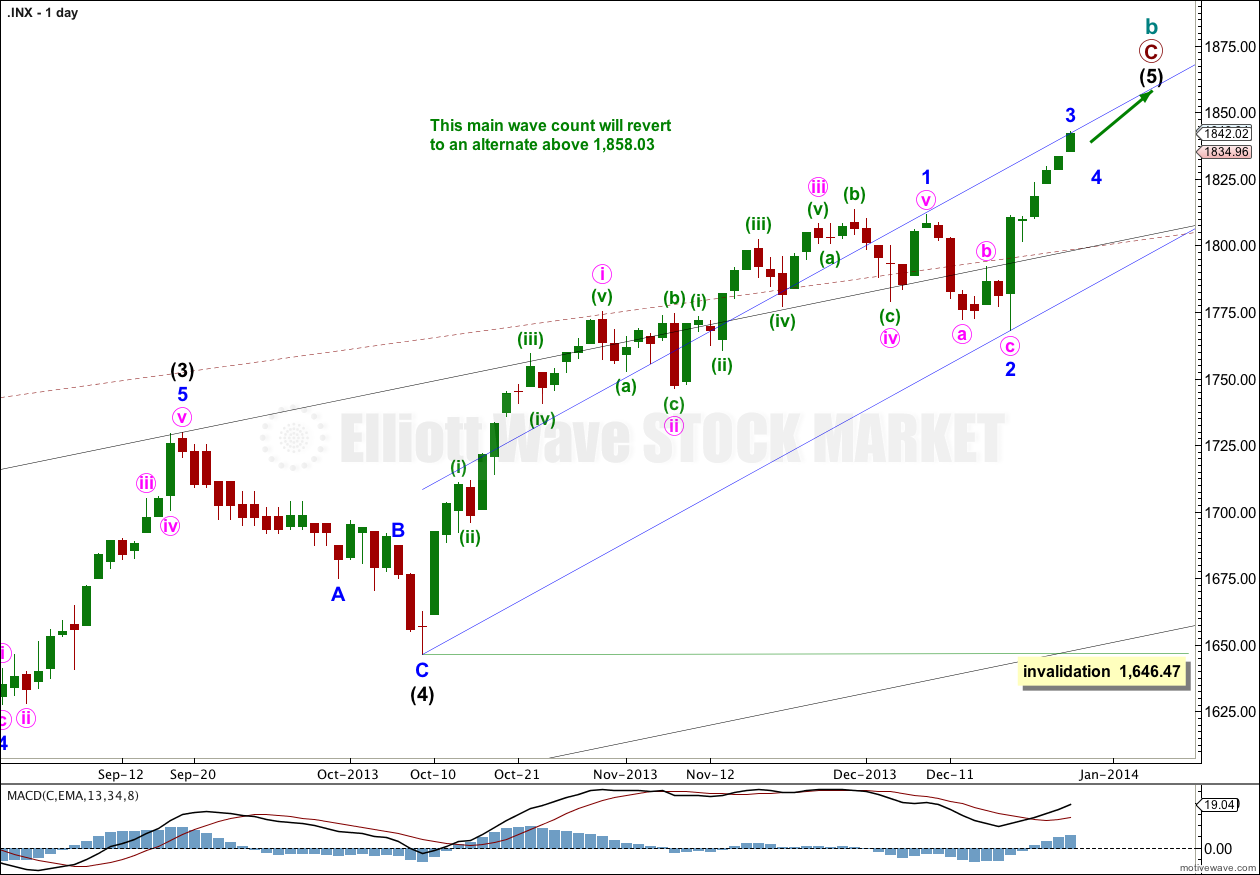
This wave count has a higher probability than the bullish alternate. Upwards movement over the last 4 1/2 years subdivides best as a zigzag. If something is “off” about the supposed recovery then it must be a B wave because there is plenty that is off in this scenario in terms of social mood.
We should always assume the trend remains the same, until proven otherwise. This is a huge trend change. I will assume we are yet to see new highs while price remains above 1,646.47.
Minor waves 1 and now also 2 are most likely complete. Minor wave 3 upwards may have begun. I have drawn an acceleration channel about minor waves 1 and 2. Minor wave 3 may have found resistance at the upper trend line and may have ended there. The lower trend line should provide support for corrections within minor wave 3.
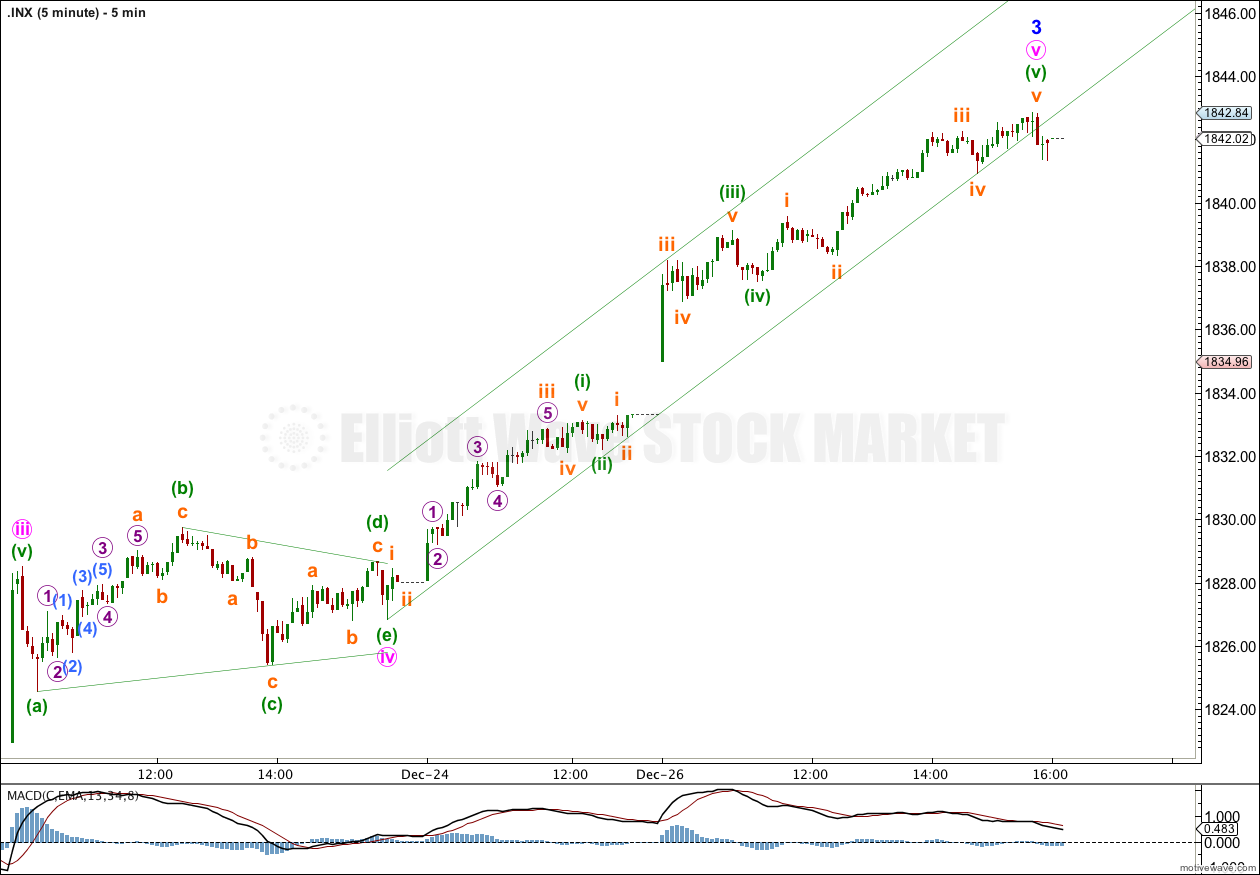
We may be about to see a larger fractal at minor wave degree of the structure within minor wave 1 at minute wave degree; there the first wave was extended, the third wave was shorter, and the fifth wave was shorter still.
Intermediate wave (3) is just 0.76 points short of 2.618 the length of intermediate wave (1). We may not see a Fibonacci ratio between intermediate wave (5) and either of (3) or (1).
Intermediate wave (1) lasted 18 days. So far intermediate wave (5) has lasted 53 days. It may last a total of a Fibonacci 89 days which would see it end on 10th February, 2014. However, Fibonacci time relationships are not very reliable for the S&P. This is a rough guideline only,
At super cycle degree the structure is an expanded flat correction. Within the flat the maximum common length of cycle wave b is 138% the length of cycle wave a, and this is achieved at 1,858.03. When cycle wave b is longer than the common length of cycle wave a then the probability that an expanded flat is unfolding would reduce and it would be more likely that a long term bull market is underway. Above 1,858.03 I will swap this main wave count over with the bullish alternate.
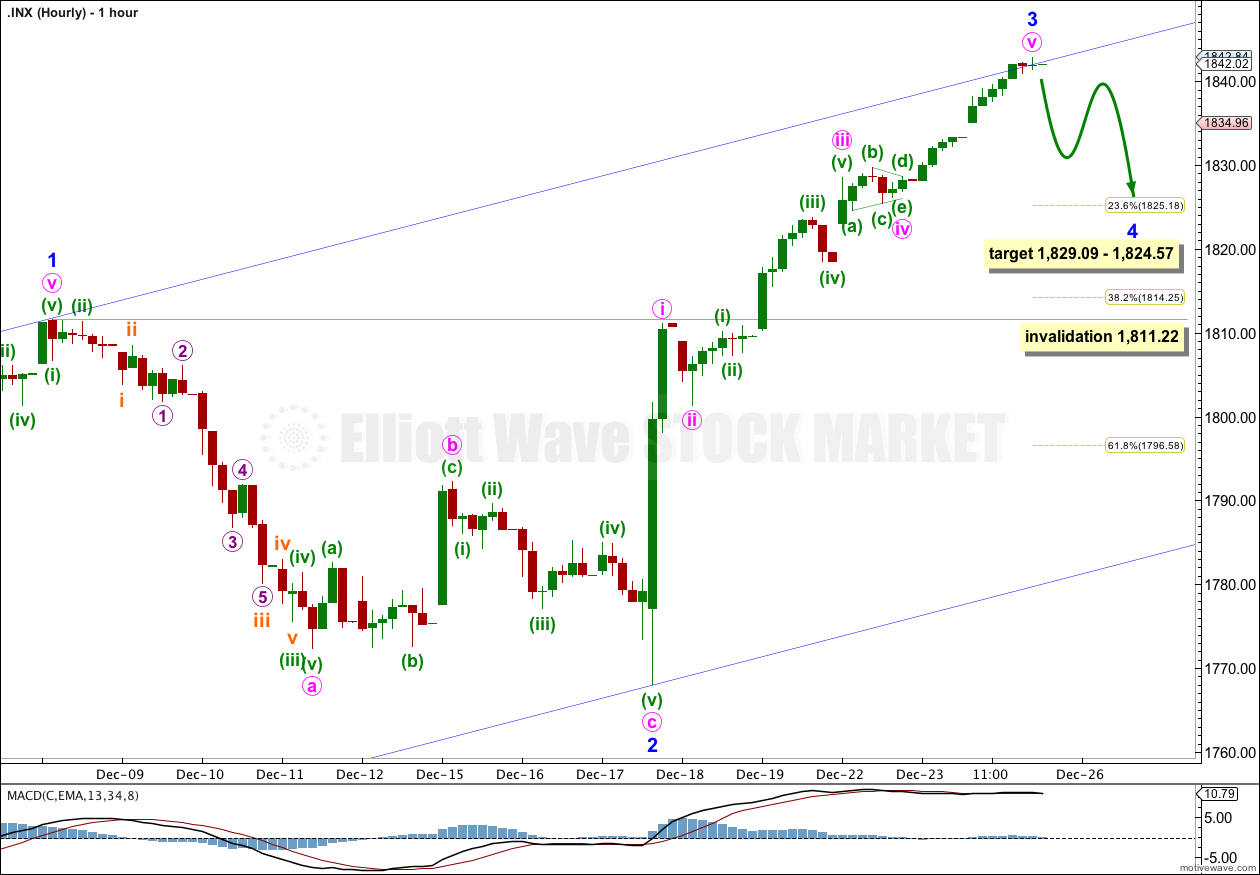
It looks like minor wave 3 may now be complete.
Ratios within minor wave 3 are: minute wave iii is 0.53 points longer than 0.618 the length of minute wave i, and minute wave v is 0.74 points short of 0.618 the length of minute wave iii.
There is no Fibonacci ratio between minor waves 3 and 1. This makes it more likely we shall see a ratio between minor wave 5 and either of 3 or 1. When minor wave 4 is completed I will calculate a target for minor wave 5 upwards to end this whole movement up to and including cycle wave b, which should have a good probability.
Within minor wave 3 minute wave ii is a shallow 21% expanded flat correction. Minute wave iv shows alternation as a more shallow 6% triangle.
Minor wave 3 may be over, or the final fifth wave within it may extend. Movement below 1,840.93 would provide some confidence that minute wave v is completed and at that stage I would expect that minor wave 4 should be underway.
Because minor wave 3 has not breached the upper edge of the acceleration channel I must allow for the reasonable possibility that it may not be over and may yet move higher for another day or two before the fourth wave arrives. While price remains above 1,840.93 this possibility will remain.
Minor wave 2 was a shallow 26% zigzag correction. I would expect minor wave 4 to show alternation in structure and / or depth. Minor wave 4 is most likely to be a flat, combination or triangle.
Minor wave 4 is most likely to end within the price territory of the fourth wave of one lesser degree (minute wave iv price territory is between 1,829.09 and 1,824.57).
Minor wave 2 lasted seven days. I would expect minor wave 4 to be somewhat in proportion to minor wave 2 so the wave count has the “right look” overall. Minor wave 4 may last about five to eight days, depending upon what structure it takes.
Minor wave 4 may not move into minor wave 1 price territory. This wave count is invalidated with movement below 1,811.22.
Bullish Alternate Wave Count.
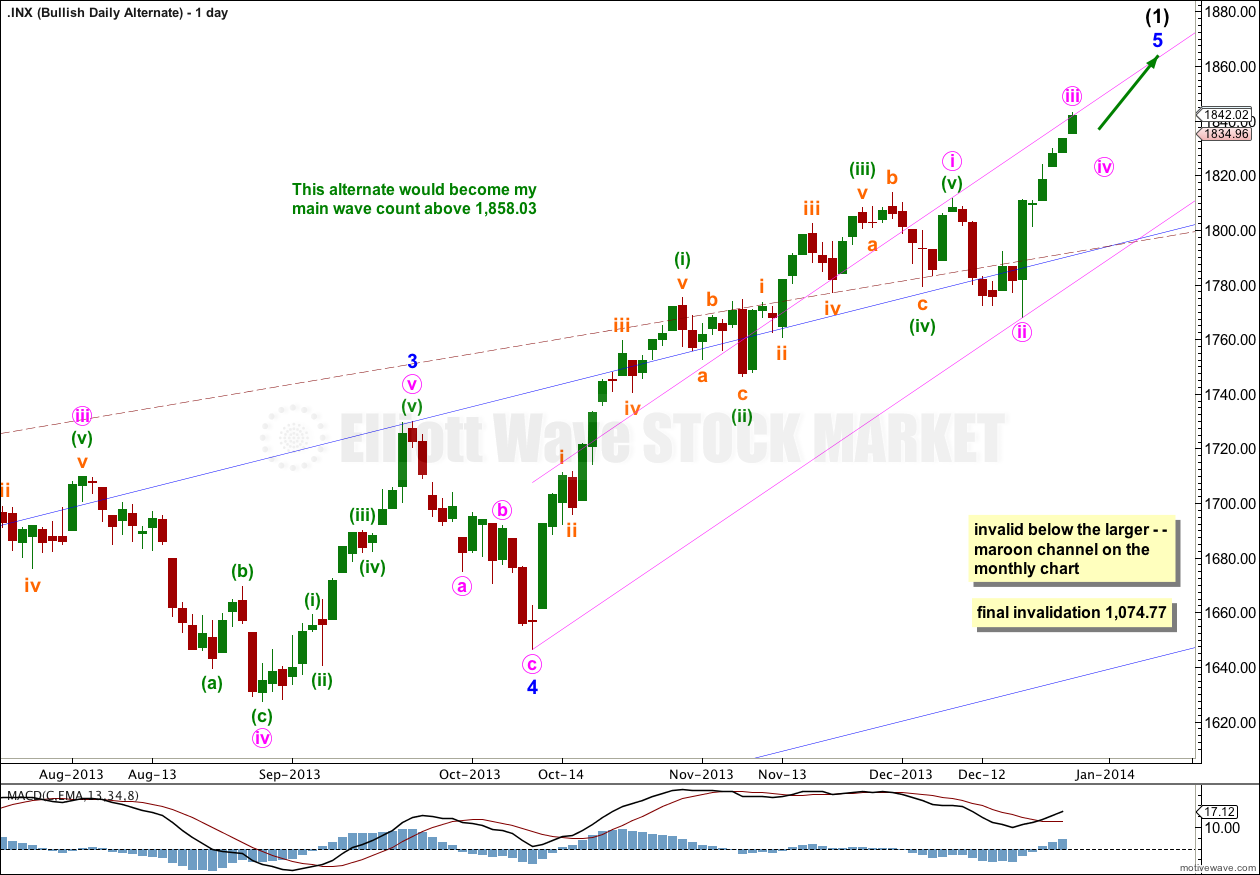
It is possible that a new cycle degree bull market began at 666.79. So far it is not yet halfway through, and I would expect it to last for a few years (at least five more years and probably longer).
The current upwards impulse, labeled intermediate wave (5) for the main wave count and minor wave 5 for this alternate is incomplete. The structure within the final fifth wave is the same, and the structure on the hourly chart is the same. Targets would be the same for this bullish wave count. This wave count again does not diverge with the main wave count, and it will not for several weeks or a a couple of months or so yet.
The maroon – – – channel is an acceleration channel drawn about primary waves 1 and 2 on the monthly chart (it is drawn in exactly the same way on the main wave count, but there it is termed a corrective channel). I would not expect intermediate wave (2) to breach this channel because a lower degree (intermediate) wave should not breach an acceleration channel of a higher degree (primary) first and second wave.