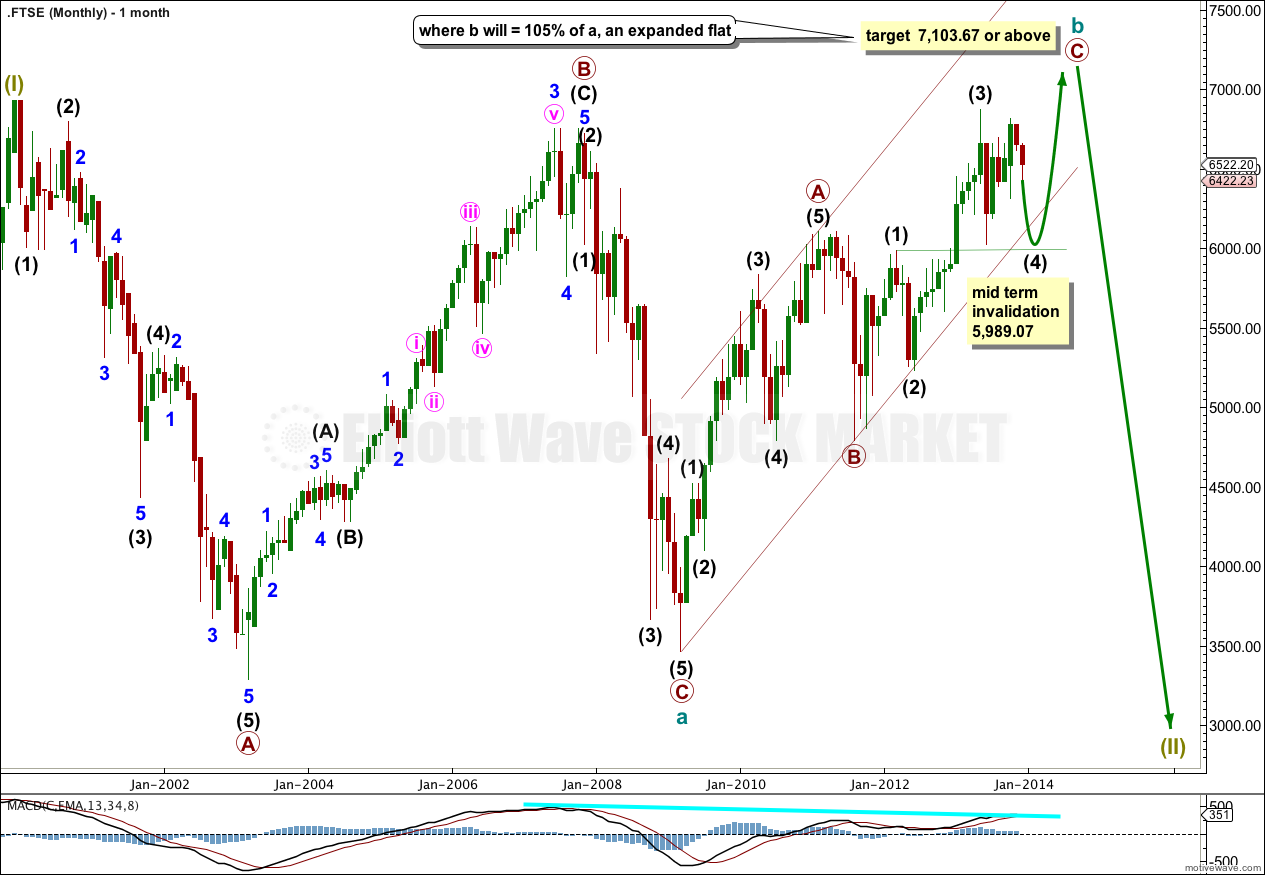
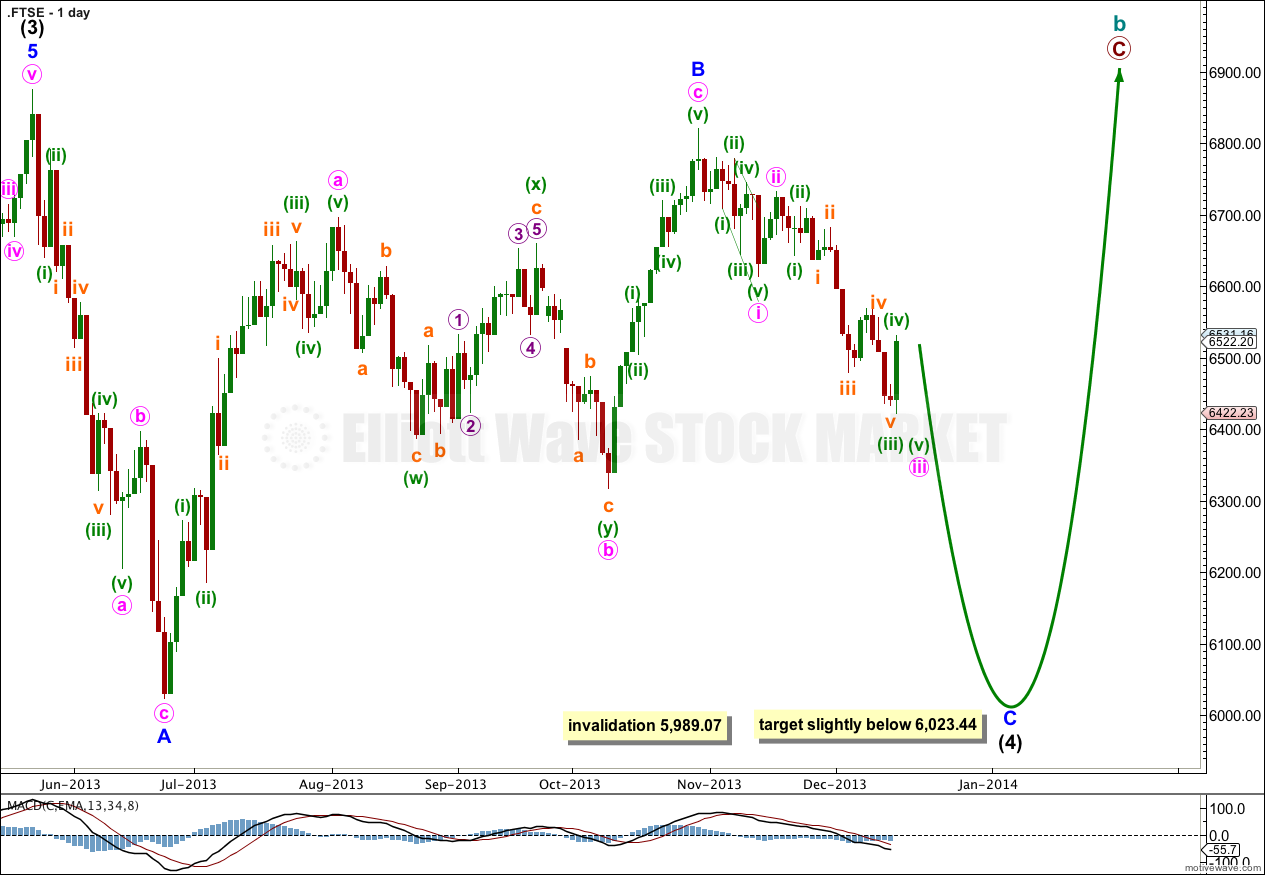
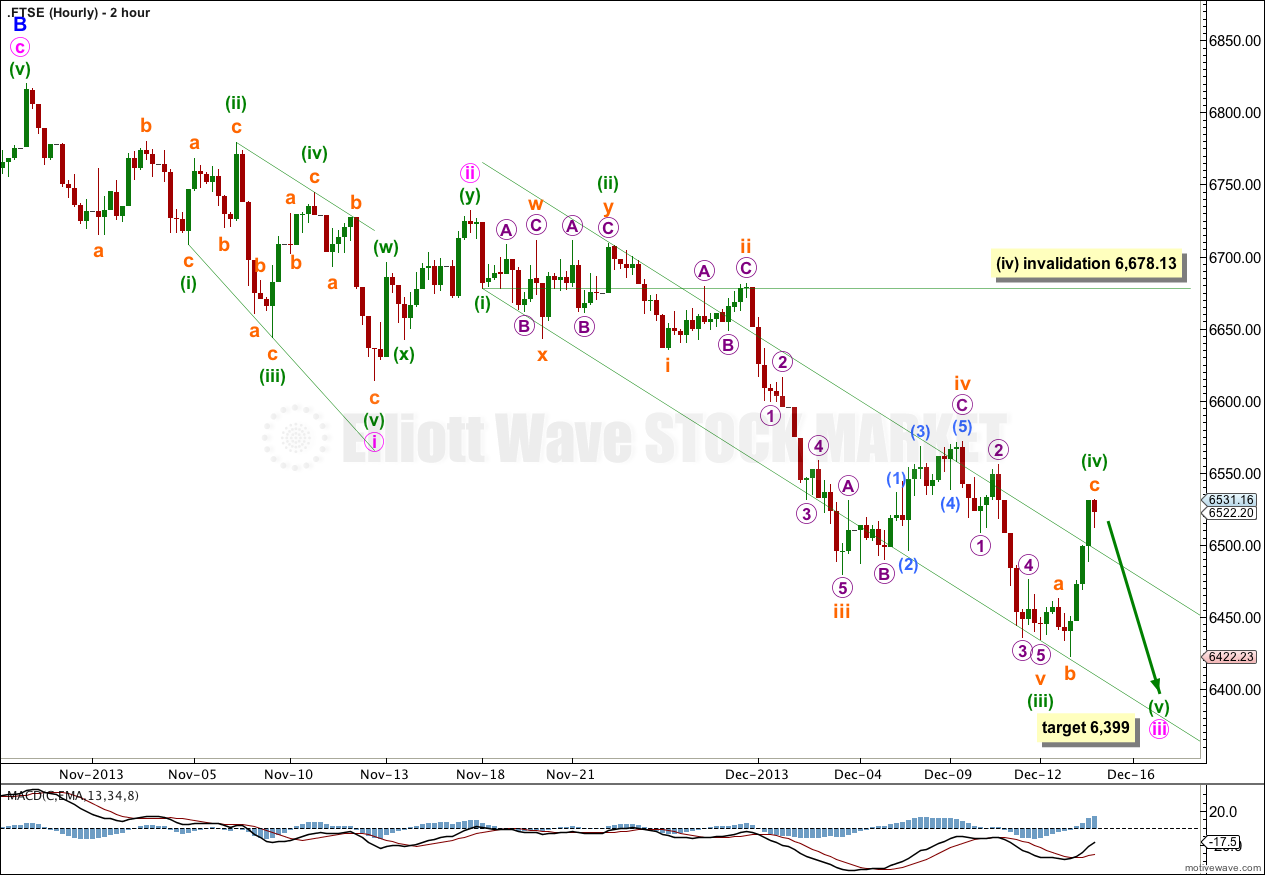
Last analysis expected downwards movement to be a second wave correction. This now looks very unlikely because the second wave would have breached the lower edge of an acceleration channel drawn about the first and second wave of one degree higher. What is now more likely is a continuation of intermediate wave (4) as a regular flat correction.
Click on the charts below to enlarge.