
The main wave count was invalidated with movement below 1,775.22. The first daily alternate, with some small adjustment, remains valid and is now the main wave count.
Yesterday’s second daily alternate actually has the best look, but we should always assume the trend remains the same until proven otherwise. This is now the bearish alternate wave count, and it requires price confirmation in the first instance as well as trend channel confirmation in the final instance.
A five up is now complete on the daily chart. The questions now are: is the downwards movement a second wave correction at minor degree? Or intermediate degree? Or a new downwards trend?
Click on the charts below to enlarge.
Main Wave Count.
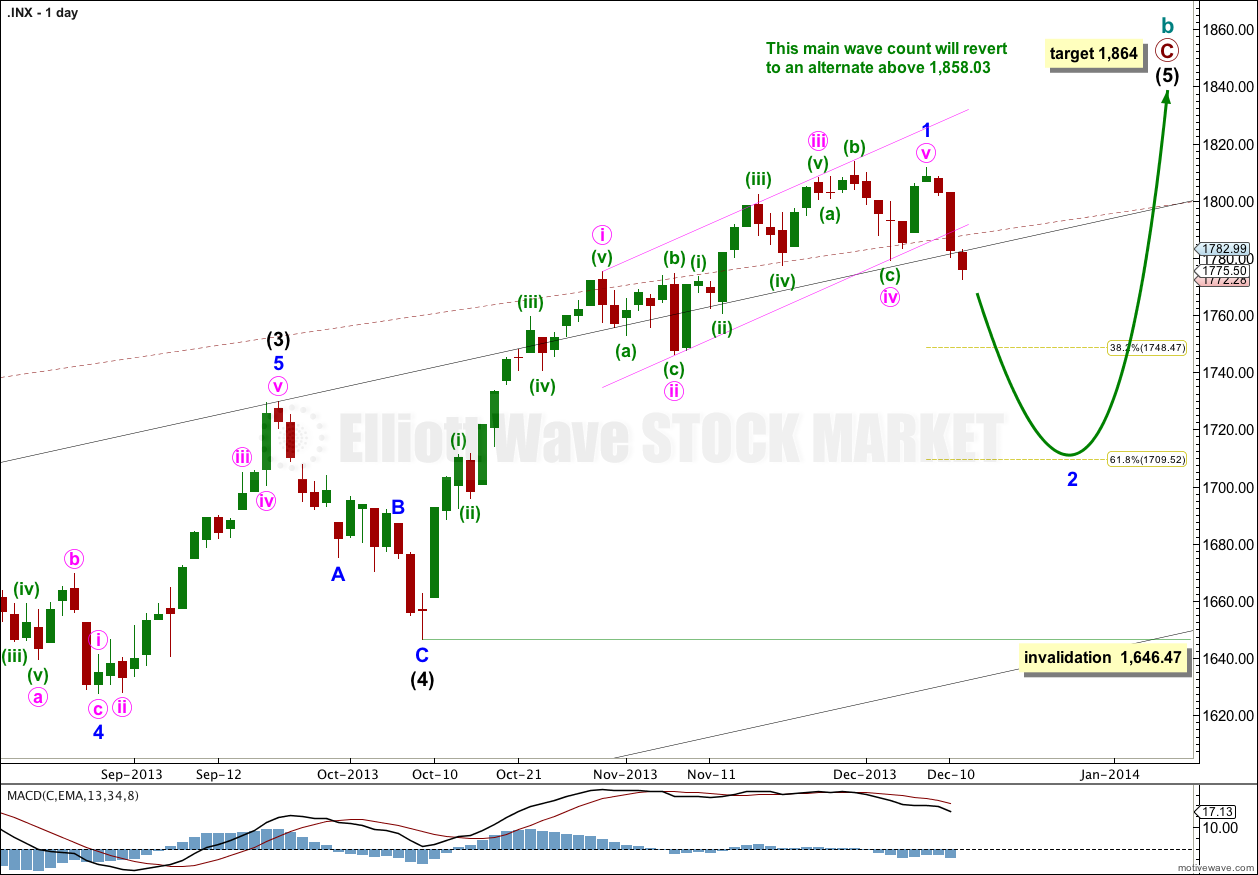
This wave count has a higher probability than the bullish alternate. Upwards movement over the last 4 1/2 years subdivides best as a zigzag. If something is “off” about the supposed recovery then it must be a B wave because there is plenty that is off in this scenario in terms of social mood.
I have adjusted the wave count within intermediate wave (5) today to have the best fit and allow for more upwards movement. We should always assume the trend remains the same, until proven otherwise. This is a huge trend change. I will assume we are yet to see new highs while price remains above 1,646.47.
I am labeling a five wave structure upwards (labeled here minor wave 1) as complete because Thursday’s candlestick clearly breaches the channel drawn about it using Elliott’s technique. That wave is over, and the next wave is underway.
Within intermediate wave (5) minor wave 1 may be complete, fitting perfectly in its Elliott channel, and minor wave 2 may now have just begun.
Minor wave 2 may not move beyond the start of minor wave 1. This wave count is invalidated with movement below 1,646.47.
If downwards movement is a second wave correction then so far within it we have just a five wave impulse, and it cannot be over.
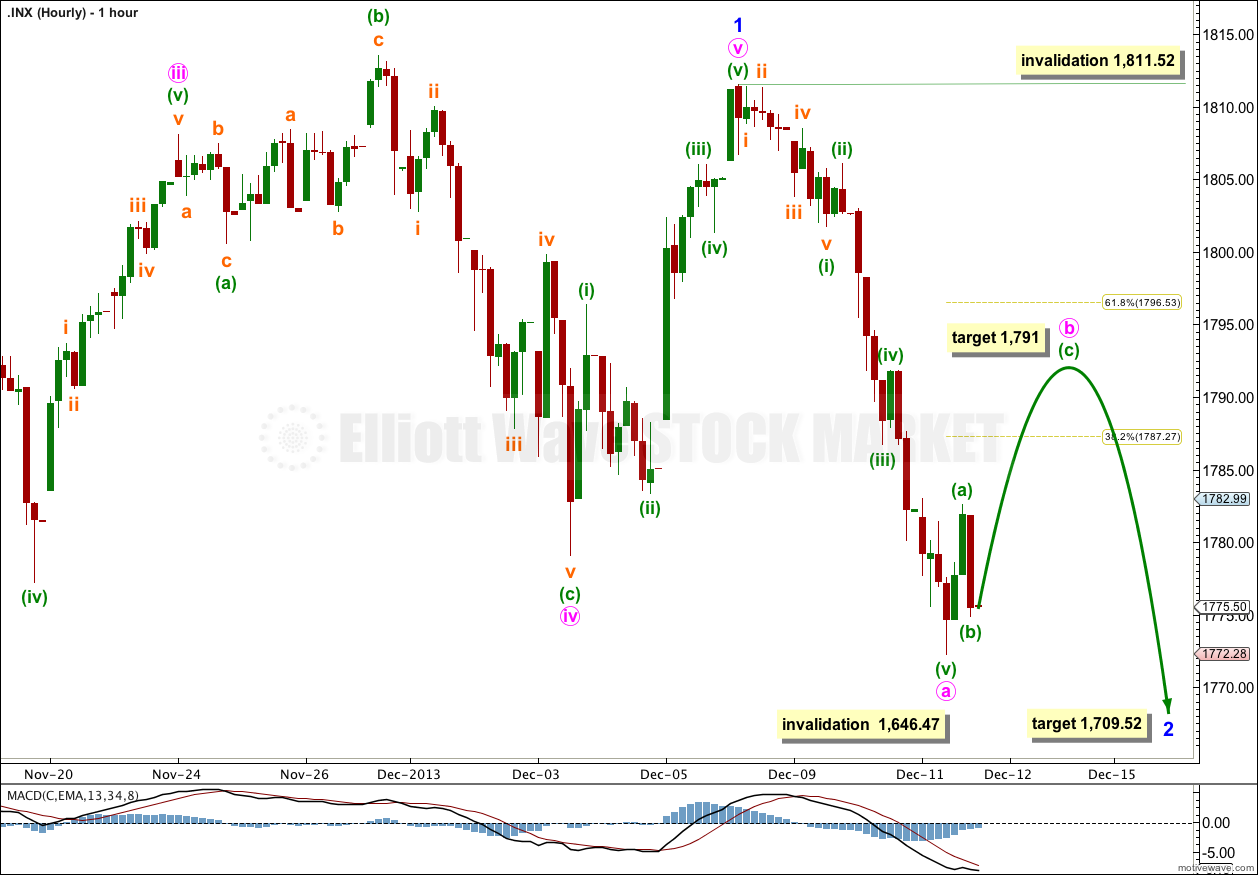
Because the first wave down subdivides as a five this indicates a zigzag may be unfolding. Within a the zigzag minute wave b may not move beyond the start of minute wave a. This wave count is invalidated with movement above 1,811.52.
Within minute wave b minuette wave (c) would reach 1.618 the length of minuette wave (a) at 1,791. At this same price point minute wave b would terminate at the end of the fourth wave of one lesser degree.
When minute wave b is a clearly complete “three” then I would expect another five wave structure downwards to new lows. At 1,709.52 minor wave 2 would reach down to the 0.618 Fibonacci ratio of minor wave 1. This target may be a few days away.
Bearish Alternate Wave Count.
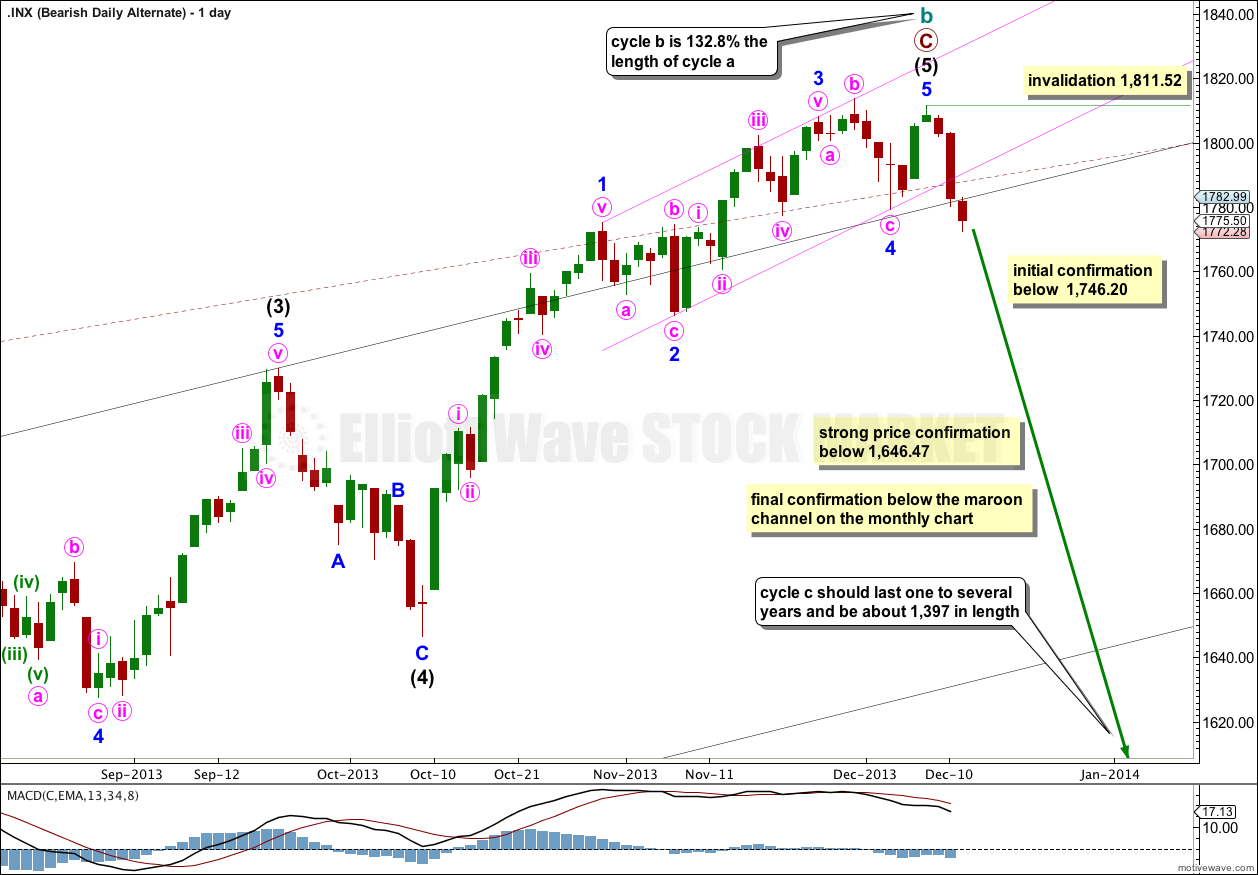
We should always assume the trend remains the same, until proven otherwise. “The trend is your friend”. This wave count is possible but we have absolutely no confirmation of a trend change at cycle degree.
Within cycle wave b primary wave C is 47.06 longer than equality with primary wave A. Upwards movement may have found final resistance at the upper edge of the maroon channel drawn about the whole of cycle wave b from its start at 666.79.
Cycle wave b is 132.8% the length of cycle wave a, within the common length of 100% to 138% for a flat correction. Because cycle wave b is over 105% the length of cycle wave a this would be an expanded flat which normally expects a C wave to move substantially beyond the end of the A wave. Movement well below 666.79 would be expected for this wave count.
Ratios within primary wave C are: intermediate wave (3) is just 0.76 points longer than 2.618 the length of intermediate wave (1), and intermediate wave (5) has no Fibonacci ratio to either of intermediate waves (1) or (3).
Ratios within intermediate wave (5) are: minor wave 3 has no Fibonacci ratio to minor wave 1, and minor wave 5 is just 2.05 points longer than 0.236 the length of minor wave 1.
I will keep charting this possibility as an alternate.
Final price confirmation of a trend change would come with movement below 1,646.47, and with invalidation of the main wave count above. At that stage both this wave count and the bullish alternate would be correct, and this would be my main wave count.
For this bearish wave count the big maroon channel on the monthly chart needs to be breached. If that occurs then the bullish alternate would be discarded, and this would be my only wave count.
Within cycle wave c no second wave correction may move beyond the start of its first wave. This wave count is invalidated with movement above 1,811.52.
Bullish Alternate Wave Count.
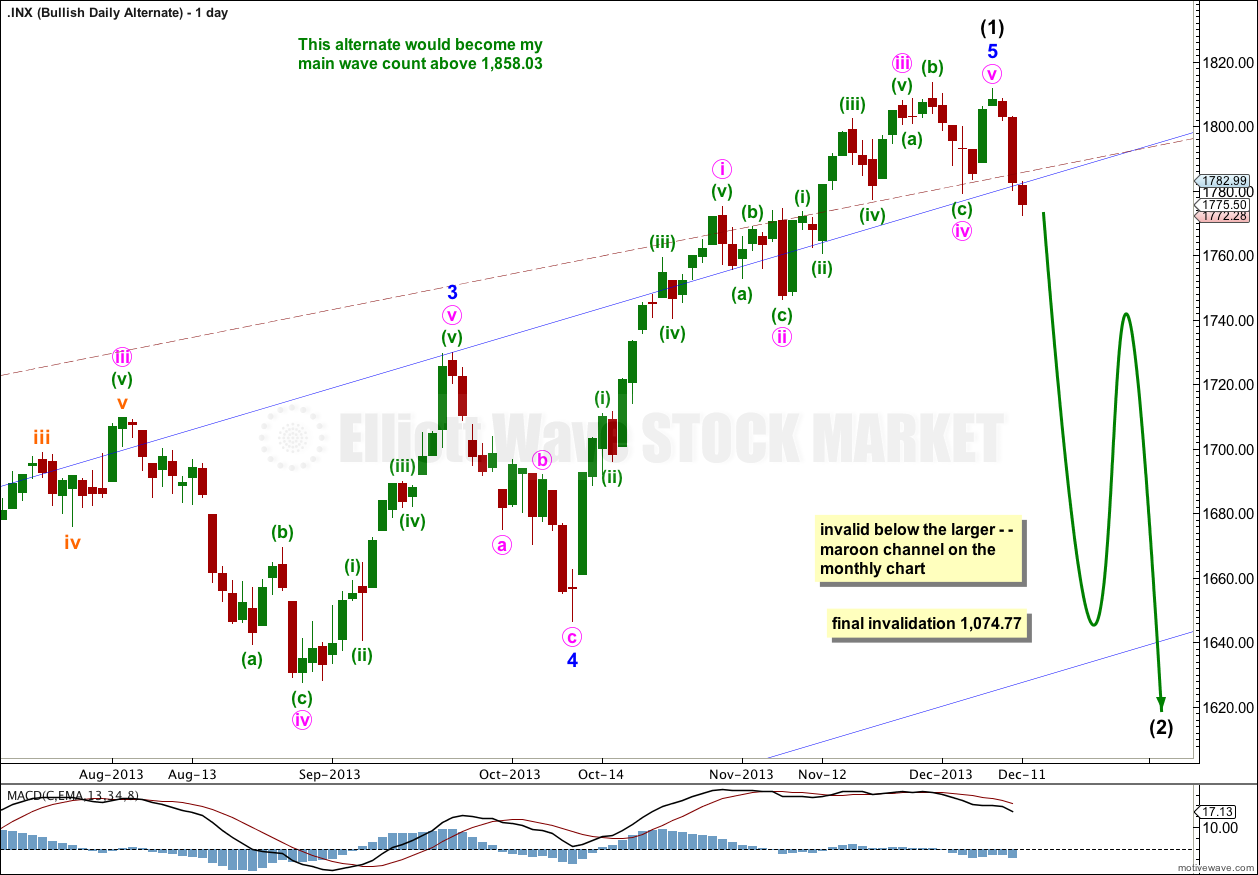
It is possible that a new cycle degree bull market began at 666.79. So far it is not yet halfway through, and I would expect it to last for a few years (at least five more years and probably longer).
The current upwards impulse, labeled intermediate wave (5) for the main wave count and minor wave 5 for this alternate could now be completed. At this stage both wave counts could see a trend change. The bearish wave count expects a huge cycle degree trend change, and this alternate expects an intermediate degree trend change. If the downwards movement subdivides as a three and remains within the maroon channel then this alternate would be preferred. If it breaches the channel this alternate would be discarded.
The maroon – – – channel is an acceleration channel drawn about primary waves 1 and 2 on the monthly chart (it is drawn in exactly the same way on the main wave count, but there it is termed a corrective channel). I would not expect intermediate wave (2) to breach this channel because a lower degree (intermediate) wave should not breach an acceleration channel of a higher degree (primary) first and second wave.