
Yesterday’s analysis expected upwards movement for Thursday which was not what happened. Price moved lower, but has remained above the invalidation point on the hourly chart, and has unfolded as a clear three wave structure.
The wave count remains the same.
Click on the charts below to enlarge.
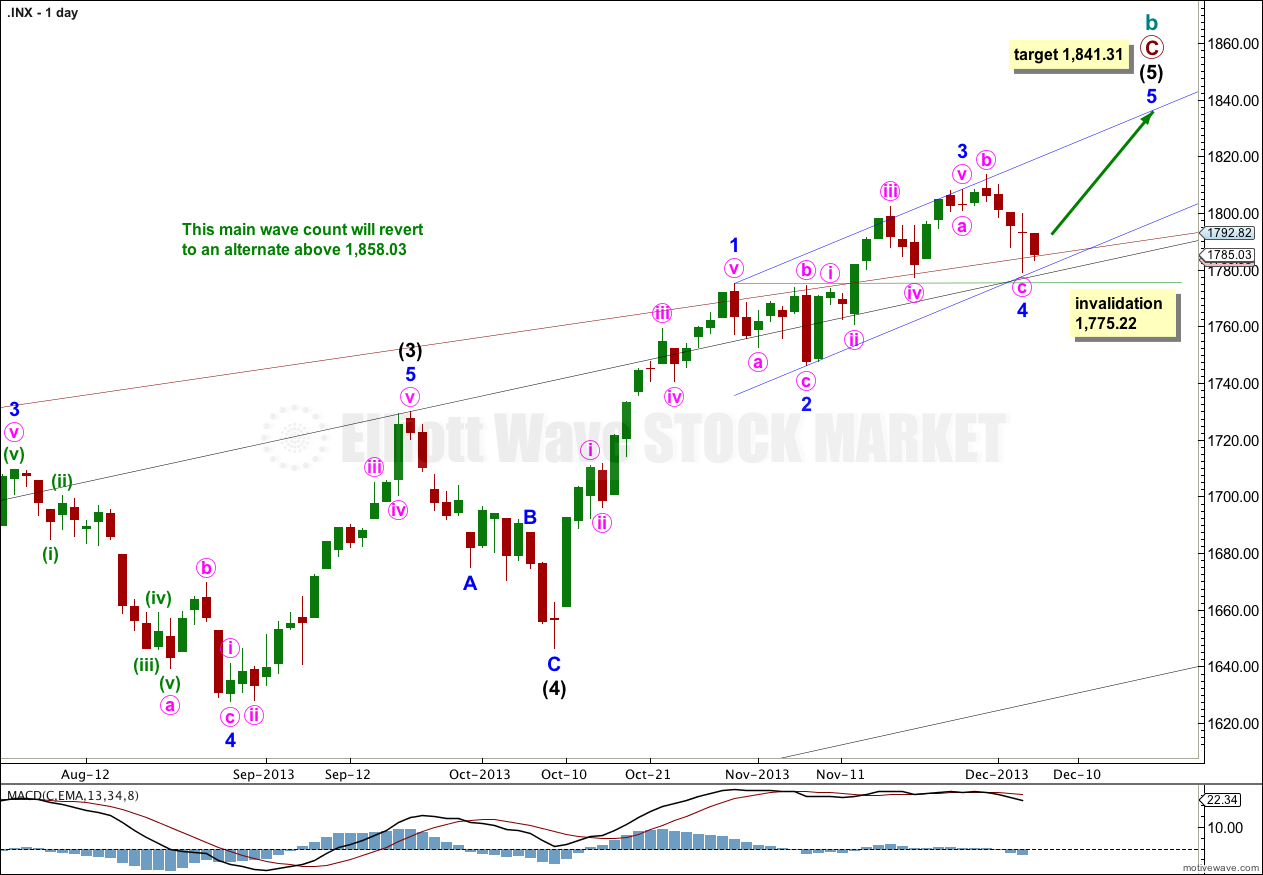
This wave count has a higher probability than the alternate. Upwards movement over the last 4 1/2 years subdivides best as a zigzag. If something is “off” about the supposed recovery then it must be a B wave because there is plenty that is off in this scenario in terms of social mood.
Minor wave 4 may have found support along the upper edge of the big maroon channel from the monthly chart, if the upper trend line is pushed out to encompass all of primary wave A.
Intermediate wave (5) is incomplete, with minor waves 1, 2, 3 and 4 now also complete.
Because minor wave 3 is shorter than minor wave 1 this limits minor wave 5 to no longer than equality with minor wave 3. This would be achieved at 1,841.31, and this price point is a maximum for expected upwards movement. I would expect minor wave 5 to end slightly below this point.
Minor wave 4 may not move into minor wave 1 price territory. This wave count is invalidated with movement below 1,775.22.
Draw a parallel channel about this impulse of intermediate wave (5). Draw the first trend line from the highs labeled minor waves 1 to 3, then place a parallel copy upon the low labeled minor wave 2. This channel now perfectly shows where minor wave 4 has ended. Minor wave 5 may end either midway within this channel, or it should find resistance at the upper edge.
Minor wave 1 lasted 15 days and is extended. Minor wave 3 lasted a Fibonacci 13 days and is not extended. I would expect minor wave 5 to most likely last either 8 or 13 days, and so end on either the 16th or 23rd of December, 2013.
At 1,858.03 cycle wave b would reach 138% the length of cycle wave a. At super cycle degree this wave count sees a large expanded flat unfolding. Within the expanded flat the maximum common length of cycle wave b is up to 138% the length of cycle wave a. When cycle wave b becomes longer than this then the probability that an expanded flat is unfolding decreases. At that stage I would swap over the main and alternate daily wave counts.
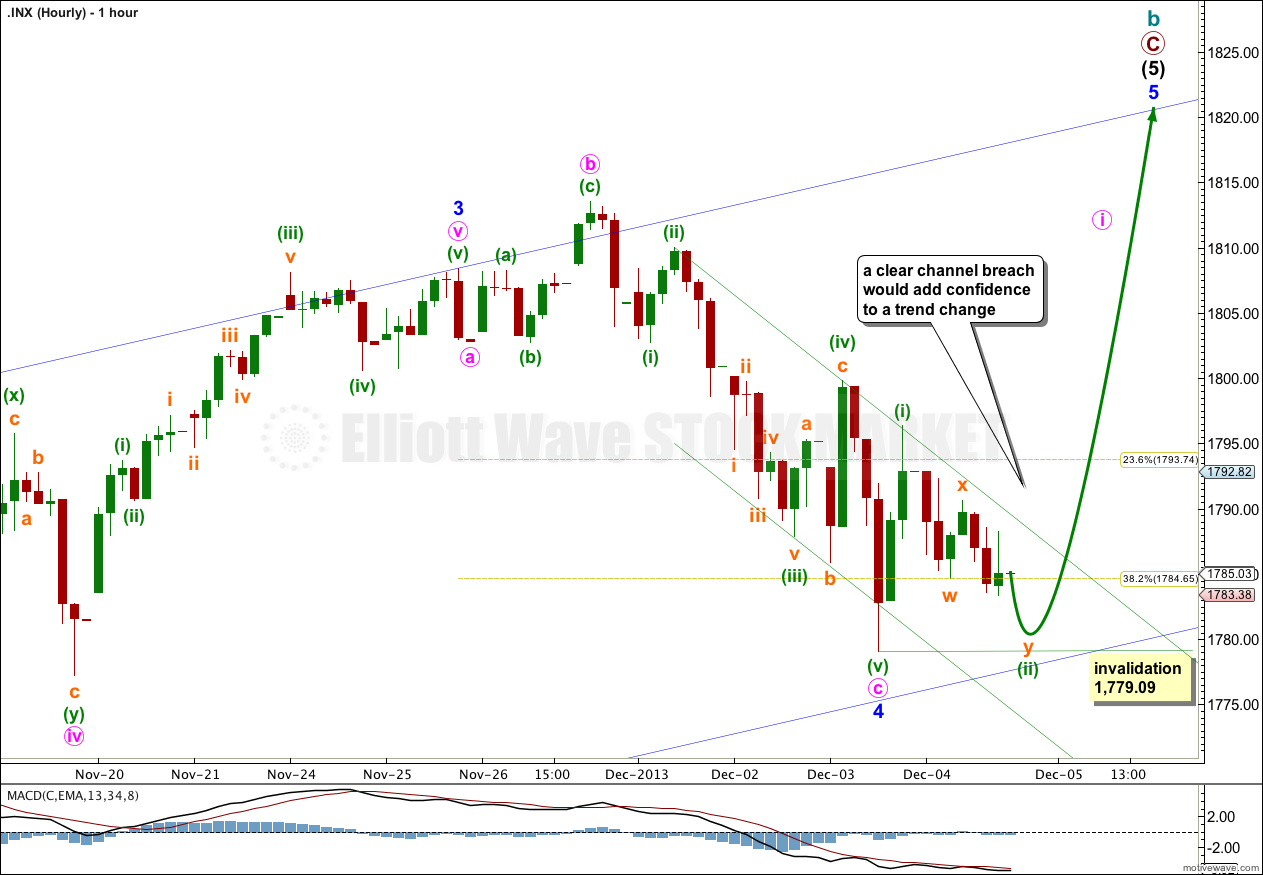
On the five minute chart minuette wave (i) upwards has an impulsive count of 13. Minuette wave (ii) downwards is a clear three wave structure, and subdivides as a double zigzag on the five minute chart. It is incomplete.
I would expect a little downwards movement when markets open tomorrow, to be followed quickly by upwards movement.
When there is a clear trend channel breach of the channel containing minute wave c downwards then I would have more confidence in this trend change.
Minor wave 5 should show divergence in momentum with minor wave 3.
Minuette wave (ii) may not move beyond the start of minuette wave (i). This wave count is invalidated with movement below 1,779.09.
Alternate Bullish Daily Wave Count.
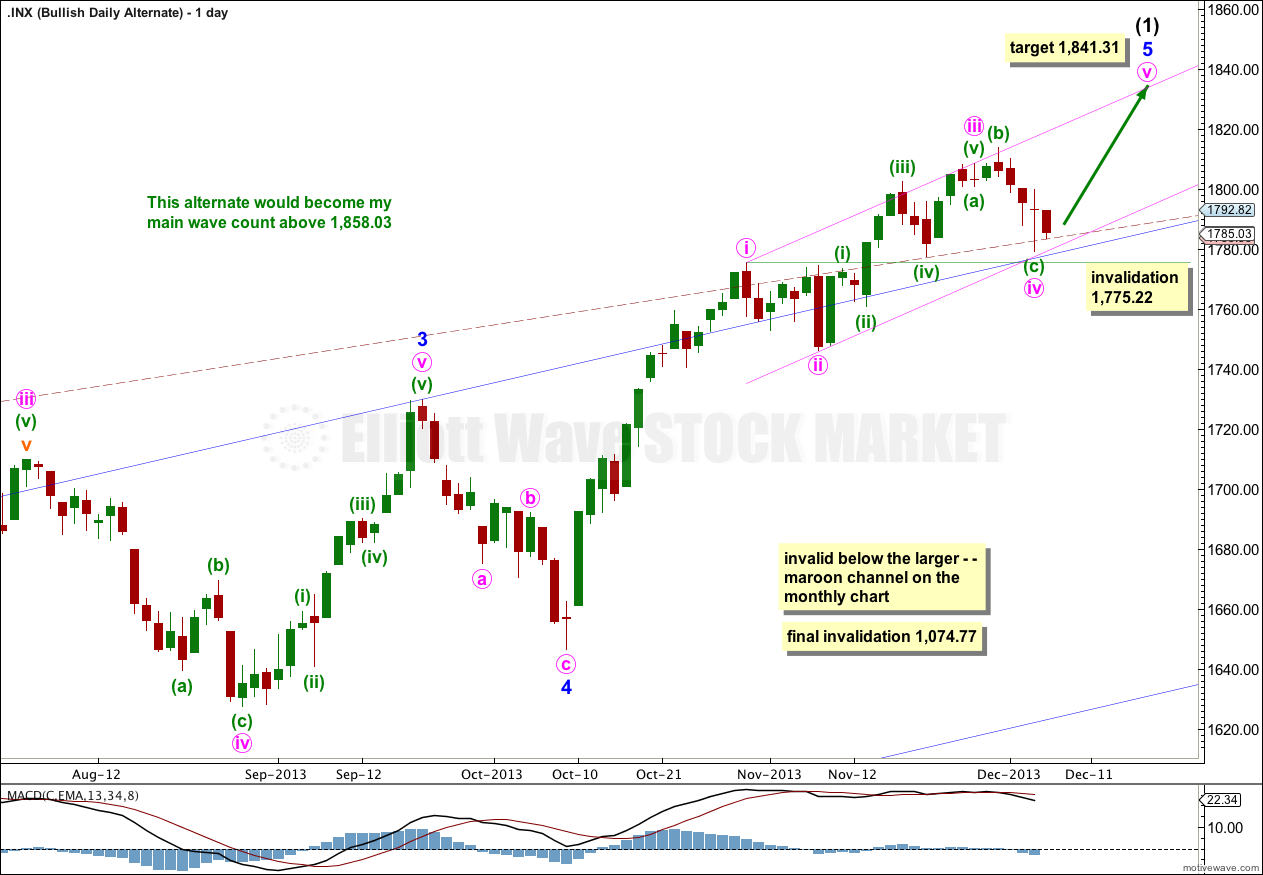
It is possible that a new cycle degree bull market began at 666.79. So far it is not yet halfway through, and I would expect it to last for a few years (at least five more years and probably longer).
At some stage then the current upwards impulse, labeled intermediate wave (5) for the main wave count and minor wave 5 for this alternate, will be completed. At that stage both wave counts would expect a trend change. The main wave count would expect a huge cycle degree trend change, and this alternate would expect an intermediate degree trend change. If the downwards movement subdivides as a three and remains within the maroon channel then this alternate would be preferred. If it breaches the channel this alternate would be discarded.
The maroon – – – channel is an acceleration channel drawn about primary waves 1 and 2 on the monthly chart (it is drawn in exactly the same way on the main wave count, but there it is termed a corrective channel). I would not expect intermediate wave (2) to breach this channel because a lower degree (intermediate) wave should not breach an acceleration channel of a higher degree (primary) first and second wave.
The daily chart shows the structure of minor wave 5. It is incomplete. Targets are the same because they are calculated using the same wave lengths as the main wave count. This bullish alternate does not diverge from the main wave count at this stage, and it will not for some weeks (or months) to come.