
Last analysis expected downwards movement to be choppy and overlapping for Monday which is exactly what has happened.
The wave count remains the same except the downwards target has been recalculated.
Click on the charts below to enlarge.
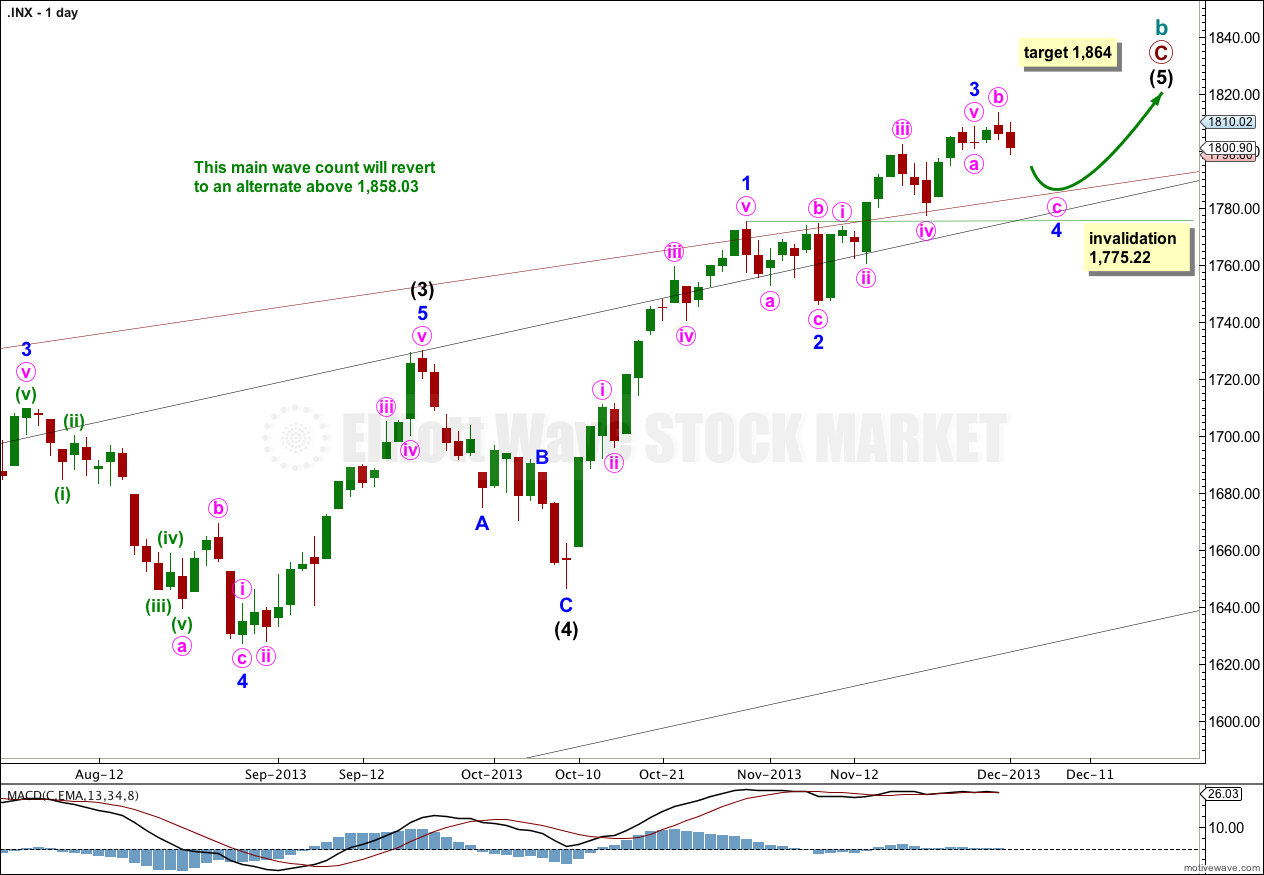
This wave count has a higher probability than the alternate. Upwards movement over the last 4 1/2 years subdivides best as a zigzag. If something is “off” about the supposed recovery then it must be a B wave because there is plenty that is off in this scenario in terms of social mood.
Downwards corrections may now find support along the upper edge of the big maroon channel from the monthly chart, if the upper trend line is pushed out to encompass all of primary wave A.
Intermediate wave (5) is incomplete, with minor waves 1 and 2 and now most likely 3 completed.
At 1,864 intermediate wave (5) would reach equality in length with intermediate wave (1). This is the most common ratio between first and fifth waves so this target has a good probability. When minor wave 4 within intermediate wave (5) is complete I will add to this calculation at a second wave degree, so it may change or widen to a small zone.
Minor wave 4 may not move into minor wave 1 price territory. This wave count is invalidated with movement below 1,775.22.
I would expect minor wave 4 to find support at the upper edge of the big maroon channel copied over from the monthly chart.
At 1,858.03 cycle wave b would reach 138% the length of cycle wave a. At super cycle degree this wave count sees a large expanded flat unfolding. Within the expanded flat the maximum common length of cycle wave b is up to 138% the length of cycle wave a. When cycle wave b becomes longer than this then the probability that an expanded flat is unfolding decreases. At that stage I would swap over the main and alternate daily wave counts.
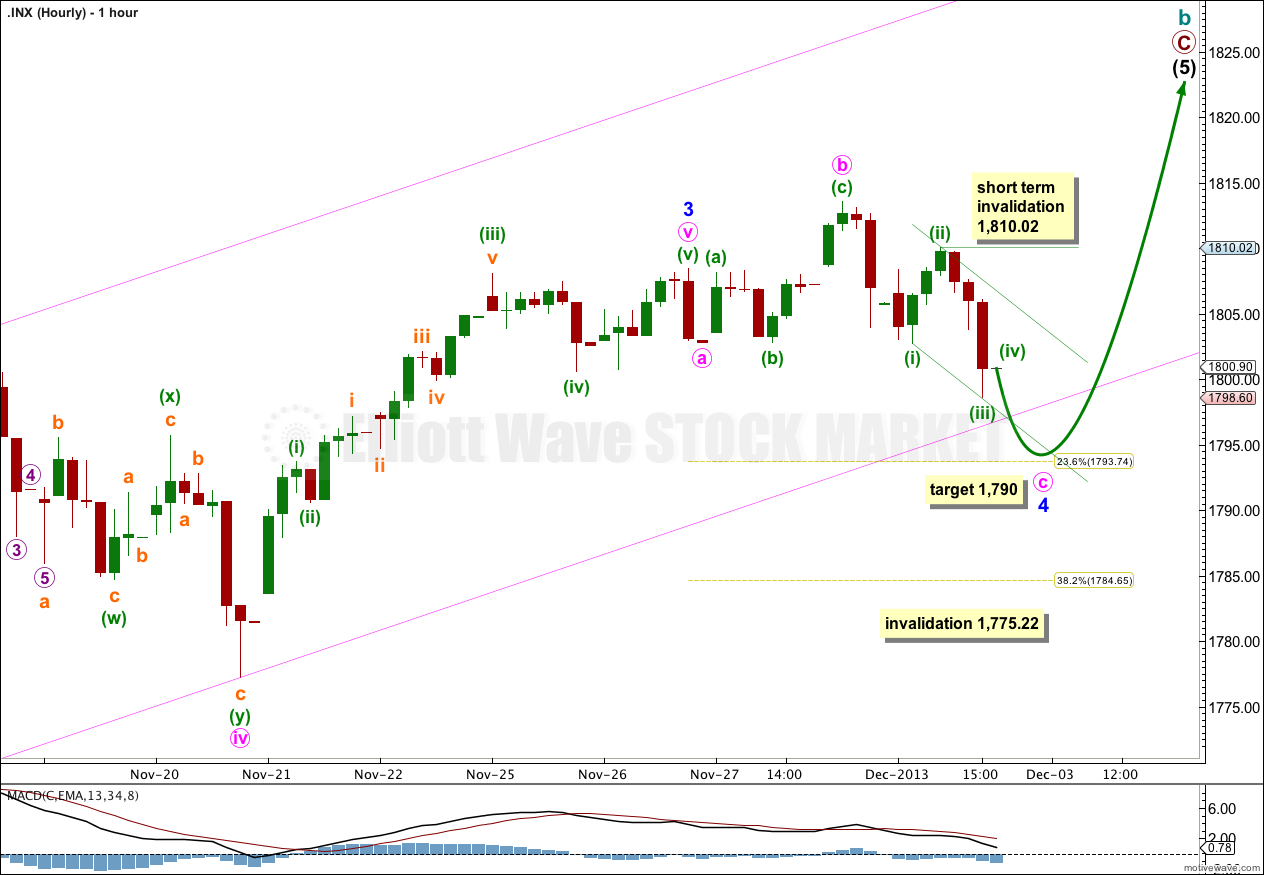
So far the structure for minor wave 4 is most likely incomplete. It looks like it may be unfolding as a flat correction. It may also be a double flat or double combination, and the first structure as a flat would be incomplete.
Minor wave 2 lasted six days (or sessions). I would expect minor wave 4 to be reasonably in proportion to minor wave 2 so that the wave count has the “right look”. I would expect more choppy, overlapping and downwards movement for minor wave 4 for another two to four days yet.
Within minor wave 4 so far minute waves a and b subdivide as three wave structures. Minute wave b is a 190% correction of minute wave a. Minute wave c is an incomplete five wave structure. It may be an impulse or an ending diagonal.
Within minute wave c if it unfolds as an impulse then minuette wave (iv) may not move into minuette wave (i) price territory above 1,802.76. If minute wave c is an ending diagonal then minuette wave (iv) should overlap into minuette wave (i) price territory but it may not move beyond the end of minuette wave (ii) above 1,810.02.
On the five minute chart it is not possible to say with certainty whether downwards movements labeled minuette waves (i) and (iii) are three or five wave structures. Minuette wave (iii) looks most likely to be incomplete. Tomorrow’s session may begin with more downwards movement before minuette wave (iv) begins.
It would be very likely now that minor wave 4 may breach support at the lower edge of the pink parallel channel.
At 1,790 minute wave c would reach 4.236 the length of minute wave a. When I know where minuette waves (iii) and (iv) within minute wave c have ended then I will add to this target calculation at minute wave degree, so it may change or widen to a small zone.
Minor wave 4 may not move into minor wave 1 price territory. This wave count is invalidated with movement below 1,775.22.
Bullish Alternate Wave Count.
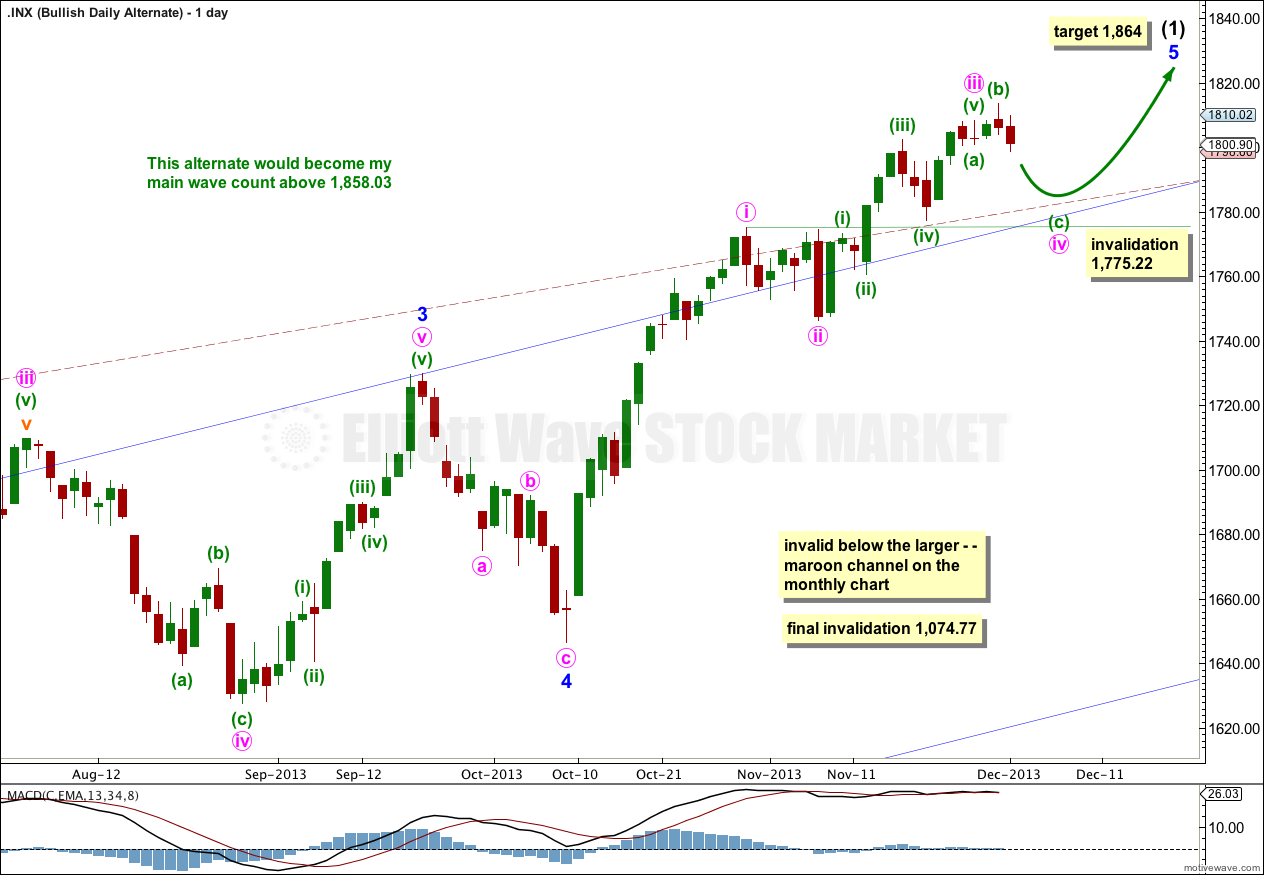
It is possible that a new cycle degree bull market began at 666.79. So far it is not yet halfway through, and I would expect it to last for a few years (at least five more years and maybe longer).
At some stage then the current upwards impulse, labeled intermediate wave (5) for the main wave count and minor wave 5 for this alternate, will be completed. At that stage both wave counts would expect a trend change. The main wave count would expect a huge cycle degree trend change, and this alternate would expect an intermediate degree trend change. If the downwards movement subdivides as a three and remains within the maroon channel then this alternate would be preferred. If it breaches the channel this alternate would be discarded.
The maroon – – – channel is an acceleration channel drawn about primary waves 1 and 2 on the monthly chart (it is drawn in exactly the same way on the main wave count, but there it is termed a corrective channel). I would not expect intermediate wave (2) to breach this channel because a lower degree (intermediate) wave should not breach an acceleration channel of a higher degree (primary) first and second wave.
The daily chart shows the structure of minor wave 5. It is incomplete. Targets are the same because they are calculated using the same wave lengths as the main wave count. This bullish alternate does not diverge from the main wave count at this stage, and it will not for some weeks (or months) to come.