
Last analysis expected more upwards movement towards short term targets at 1,804 and 1,807. Upwards movement reached 1,802.33, 1.67 points short of the first target, before turning lower.
The wave counts remain the same.
Click on the charts below to enlarge.
Main Wave Count.
This wave count has a higher probability than the alternate. Upwards movement over the last 4 1/2 years subdivides best as a zigzag. If something is “off” about the supposed recovery then it must be a B wave because there is plenty that is off in this scenario in terms of social mood.
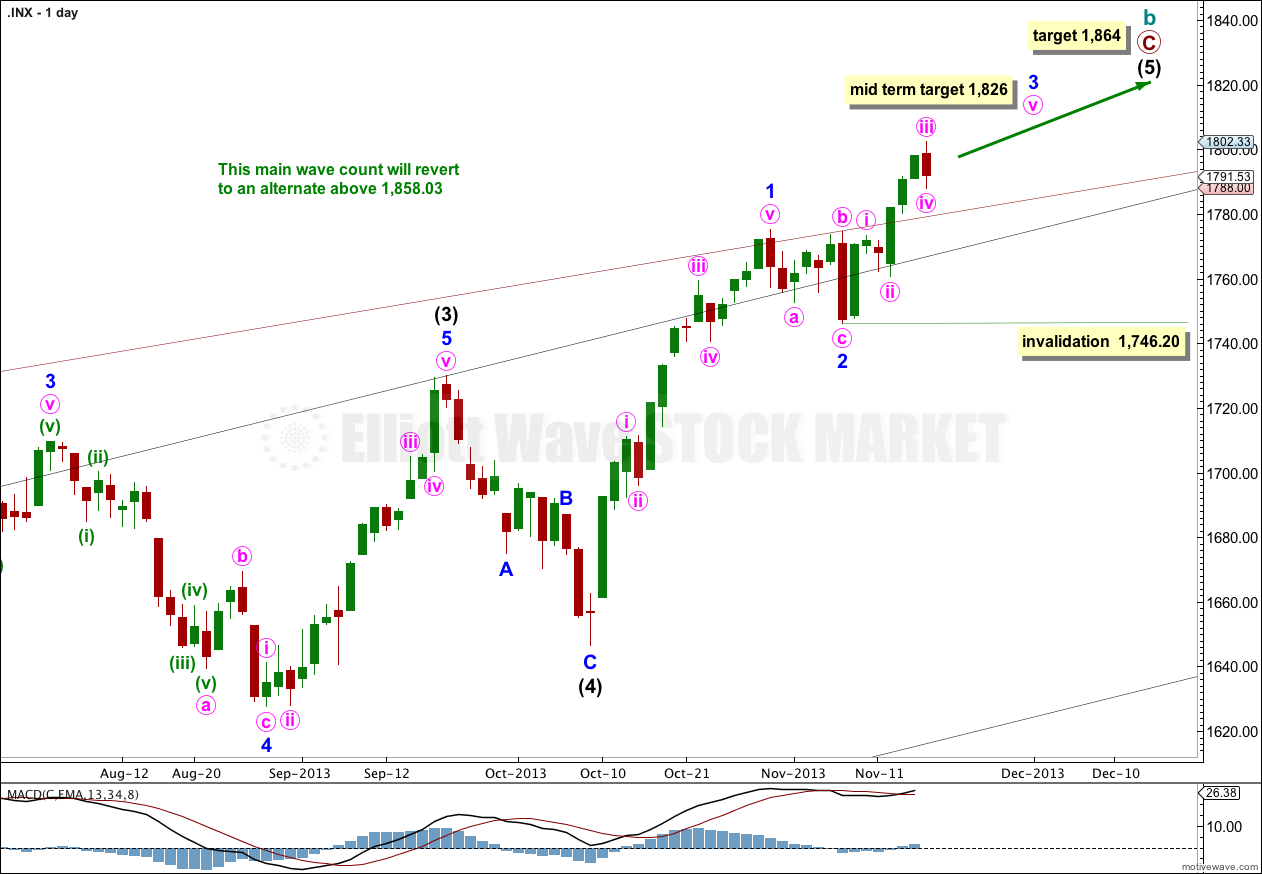
Downwards corrections may now find support along the upper edge of the big maroon channel from the monthly chart, if the upper trend line is pushed out to encompass all of primary wave A.
Intermediate wave (5) is incomplete with just minor waves 1 and now probably 2 within it completed.
At 1,826 minor wave 3 would reach 0.618 the length of minor wave 1. Minor wave 1 is extended, so minor waves 3 and 5 may not be.
At 1,864 intermediate wave (5) would reach equality in length with intermediate wave (1). This is the most common ratio between first and fifth waves so this target has a good probability.
Within minor wave 3 minute wave ii may not move beyond the start of minute wave i. This wave count is invalidated with movement below 1,746.20.
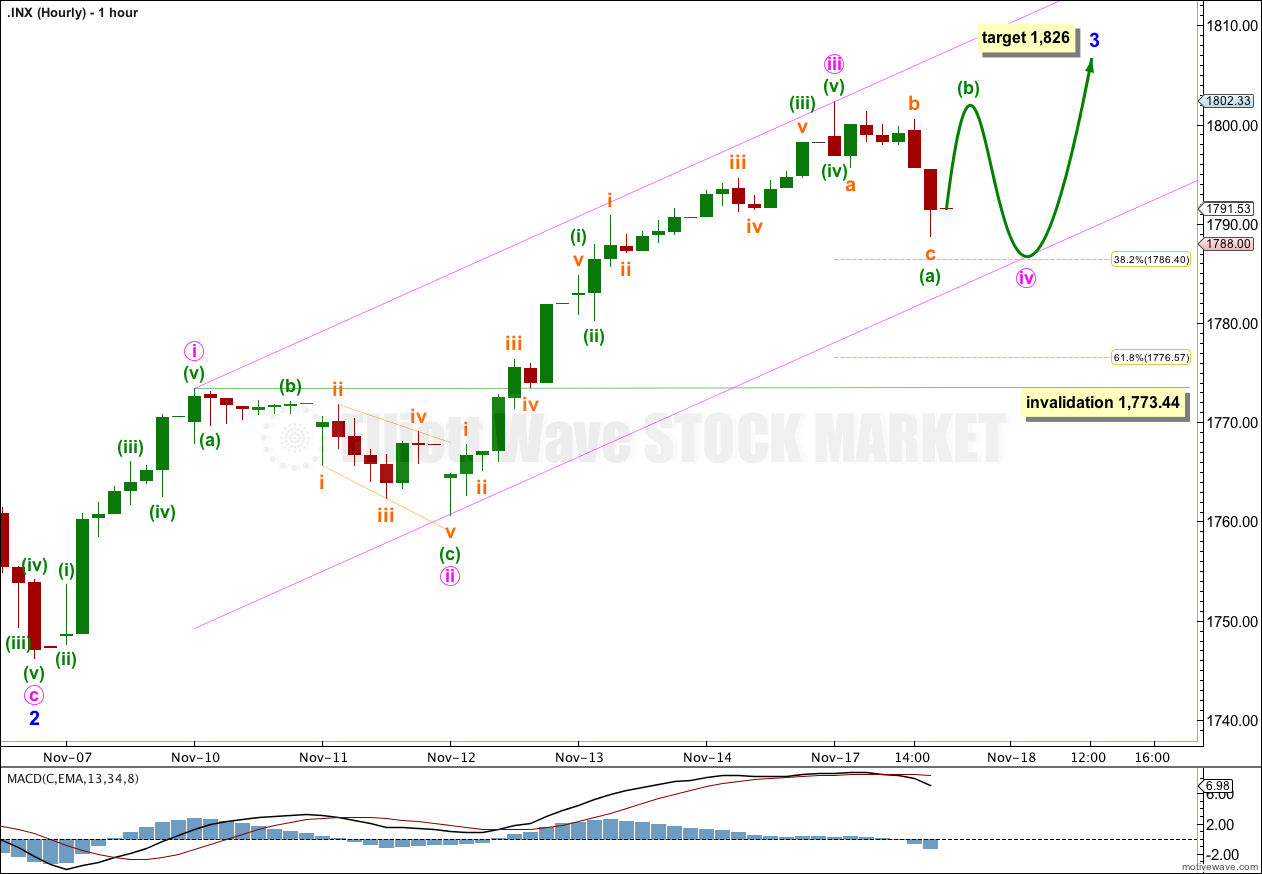
Upwards movement for the start of Monday’s session may have ended minute wave iii. Downwards movement which ended Monday’s session appears as a red candle on the daily chart, and so it is most likely minute wave iv.
Minute wave iii is 2.38 points short of 1.618 the length of minute wave i.
Ratios within minute wave iii are: there is no Fibonacci ratio between minuette waves (iii) and (i), and minuette wave (v) is 0.17 points short of 0.236 the length of minuette wave (i).
Ratios within minuette wave (iii) are: subminuette wave iii has no Fibonacci ratio to subminuette wave i, and subminuette wave v is 0.22 points longer than 0.618 the length of subminuette wave i.
Minute wave ii was a relatively shallow 47% zigzag correction. Minute wave iv should show some alternation; it may be shallower or deeper, and it may be a flat, combination or triangle.
Minute wave ii lasted 16 hours. I would expect minute wave iv to be close to this duration. So far it has lasted only 6 hours. It may continue for one more session, possibly to end at the end of tomorrow’s session.
So far within minute wave iv there is a three wave structure complete to the downside. This could be minute wave iv in its entirety over here, or more likely it is just minuette wave (a) (or (w) ) within a flat correction (or combination).
If minute wave iv is unfolding as a flat correction then within it minuette wave (b) must reach at least 90% the length of minuette wave (a) at 1,800.97. Minuette wave (b) must unfold as a three wave structure (or as a triangle).
If upwards movement subdivides as a three but fails to reach 1,800.97 then I would relabel minute wave iv as W-X-Y double combination.
Minute wave iv may also be a sideways moving triangle. If that is the case then it may last another two or even three sessions.
I would expect minute wave iv to find support at the lower edge of this parallel channel drawn using Elliott’s first technique. Draw the first trend line from the highs labeled minute waves i to iii, then place a parallel copy upon the low labeled minute wave ii. If minute wave iv ends there it may end about the 0.382 Fibonacci ratio at 1,786.40.
Minute wave iv may not move into minute wave i price territory. This wave count is invalidated with movement below 1,773.44.
Alternate Wave Count.
It is possible that a new cycle degree bull market began at 666.79. So far it is not yet halfway through, and I would expect it to last for a few years (at least five more years and maybe longer).
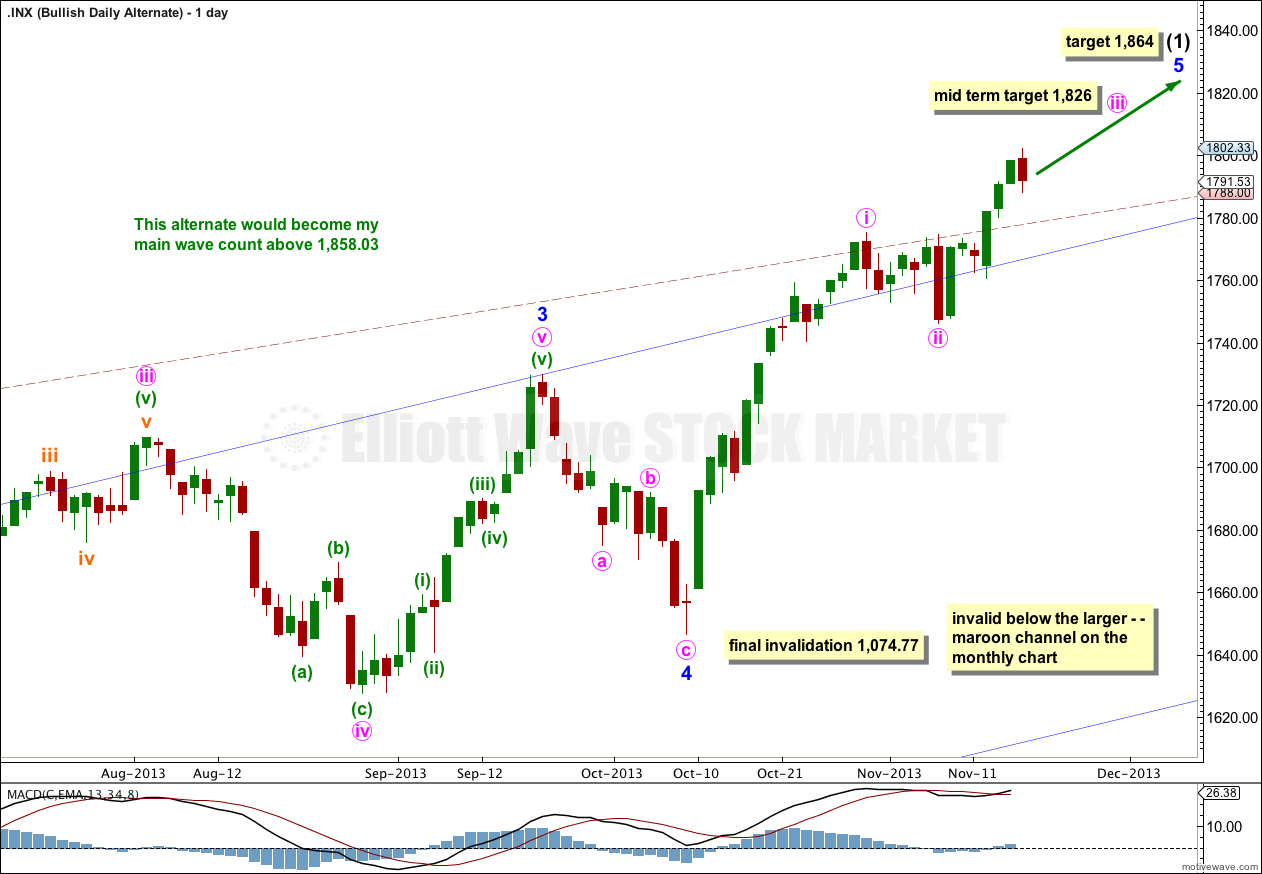
At some stage then the current upwards impulse, labeled intermediate wave (5) for the main wave count and minor wave 5 for this alternate, will be completed. At that stage both wave counts would expect a trend change. The main wave count would expect a huge cycle degree trend change, and this alternate would expect an intermediate degree trend change. If the downwards movement subdivides as a three and remains within the maroon channel then this alternate would be preferred. If it breaches the channel this alternate would be discarded.
The maroon – – – channel is an acceleration channel drawn about primary waves 1 and 2 on the monthly chart. I would not expect intermediate wave (2) to breach this channel. If downwards movement breaches the channel I would discard this wave count.
The daily chart shows the structure of minor wave 5. It is incomplete. Targets are the same because they are calculated using the same wave lengths as the main wave count. This bullish alternate does not diverge from the main wave count at this stage, and it will not for some weeks to come.