
Last analysis expected upwards movement for Monday’s session which is what has happened.
The structure on the hourly chart indicates an adjustment in the wave count, but the mid term and long term targets remain the same.
Click on the charts below to enlarge.
Main Wave Count.
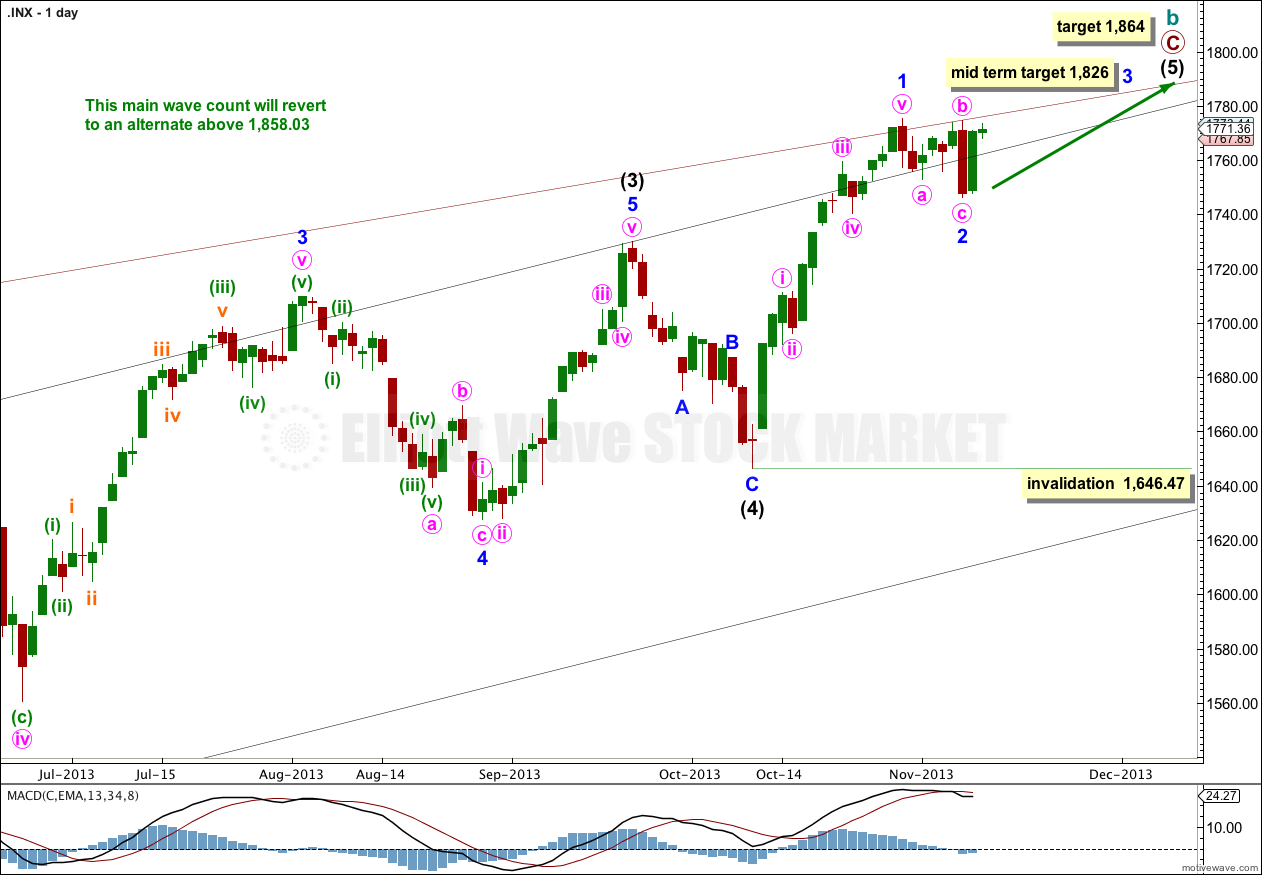
This wave count has a higher probability than the alternate. Upwards movement over the last 4 1/2 years subdivides best as a zigzag. If something is “off” about the supposed recovery then it must be a B wave because there is plenty that is off in this scenario in terms of social mood.
Price may continue to find resistance along the upper edge of the big maroon channel from the monthly chart, if the upper trend line is pushed out to encompass all of primary wave A.
At 1,858.03 cycle wave b would reach 138% the length of cycle wave a. This wave count sees a super cycle expanded flat unfolding, and the maximum common length for a B wave within a flat is 138% the length of the A wave. Above this point this wave count would reduce in probability and it would be more likely that a longer term bull market is underway.
Intermediate wave (5) is incomplete with just minor waves 1 and now probably 2 within it completed. Today I have two hourly charts for you. The first expects minor wave 2 is over, and the second looks at the possibility it may only be halfway through.
At 1,826 minor wave 3 would reach 0.618 the length of minor wave 1. Minor wave 1 is extended, so minor waves 3 and 5 may not be.
At 1,864 intermediate wave (5) would reach equality in length with intermediate wave (1). This is the most common ratio between first and fifth waves so this target has a good probability.
Within intermediate wave (5) minor wave 2 may move beyond the start of minor wave 1. This wave count is invalidated with movement below 1,646.47.
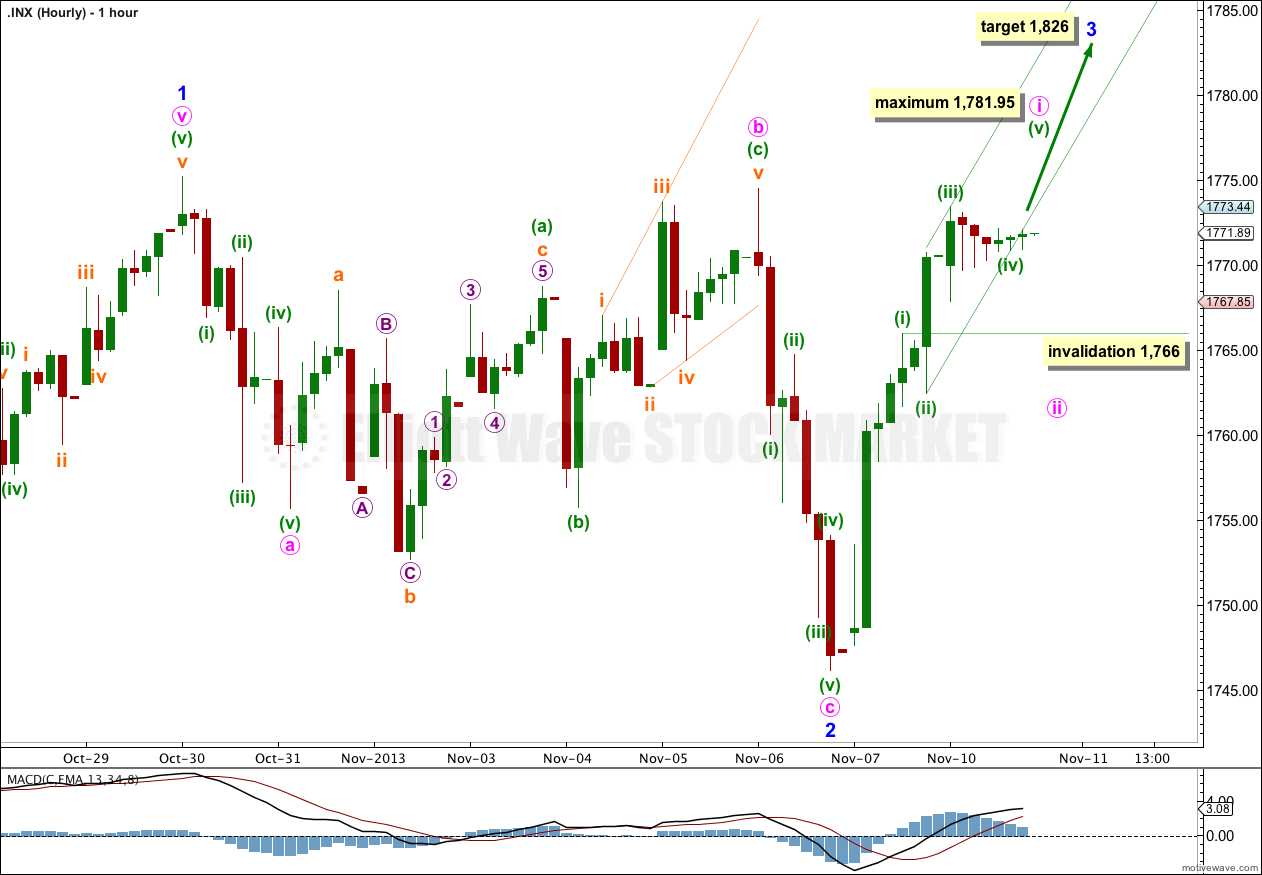
Upwards movement to begin Monday’s session was less than expected; the short term target was at 1,782. Minute wave iii is probably not over, and is probably extending.
I have moved the degree of labeling within minute wave iii down one degree. Sideways movement at the end of Monday’s session is a clear contracting regular triangle, so this must be a fourth wave. This cannot be minute wave iv because that would not allow minor wave 3 to move far enough above the end of minor wave 1 to allow for enough room for minor wave 4 to unfold. It must be a fourth wave triangle one degree lower.
Minute wave i must end at or before 1,781.95 because within minuette wave (iii) may not the the shortest wave.
On the five minute chart it looks most like the triangle is completed. However, if my analysis of this is wrong (the triangle could be subminuette wave b within minuette wave (iv) ) then any further movement for minuette wave (iv) may not move into minuette wave (i) price territory. This wave count is invalidated with movement below 1,766.
When minuette wave (v) upwards completes minute wave i then I would expect minute wave ii to last one or two days. At that stage the invalidation point must move down to 1,746.20.
Bullish Alternate Wave Count.
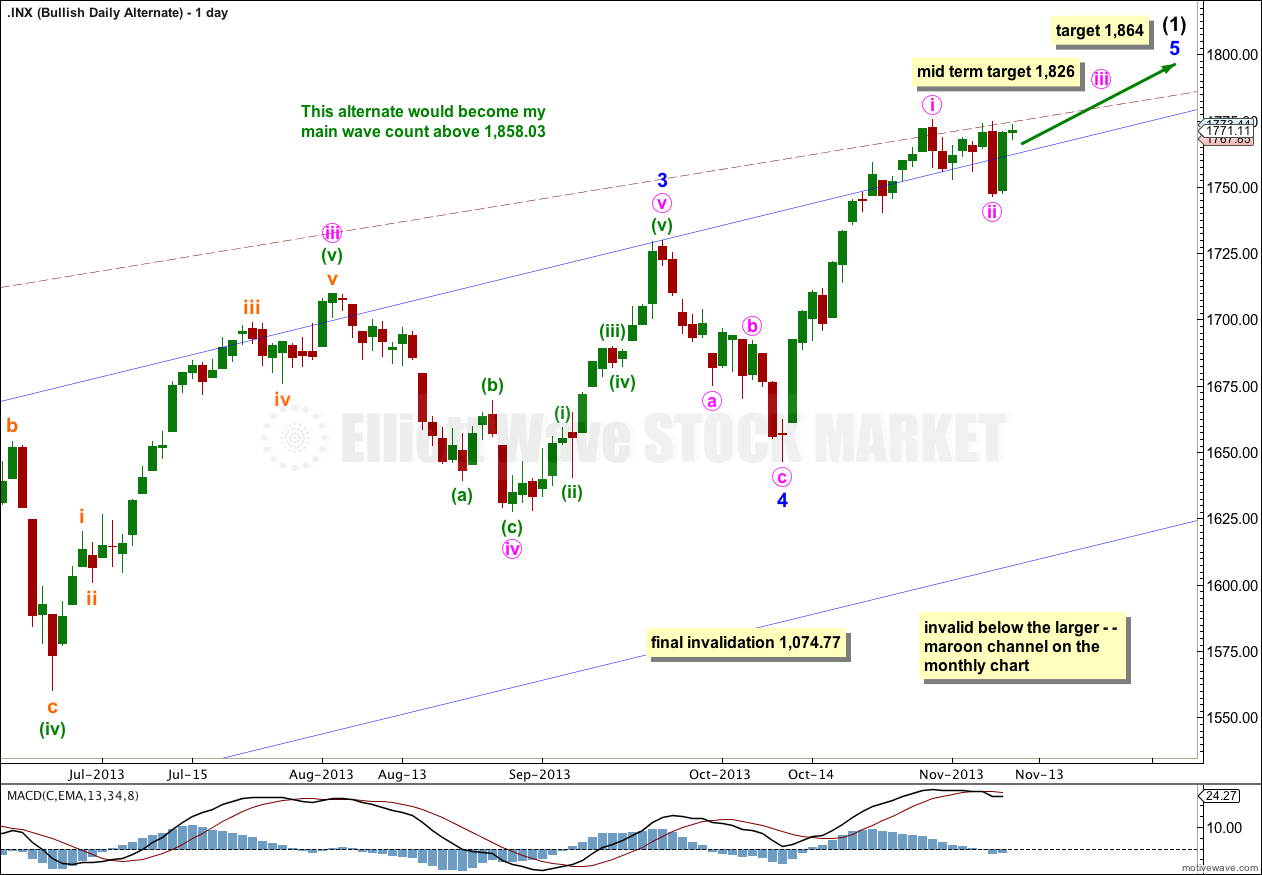
It is possible that we are and have been in a new bull market for a cycle degree fifth wave. Cycle waves should last from one to several years (as a rough guideline).
At this stage this bullish alternate does not diverge from the main wave count. The end of intermediate wave (1) is calculated using the same wave lengths and ratios.
When intermediate wave (1) could again be considered complete then this alternate would also expect downwards movement. At that stage the direction expected would be the same as the main wave count, but this alternate would expect a corrective structure downwards where the main wave count would expect an impulse downwards.