
Price moved sideways for Friday’s session. Downwards movement at the beginning of the session was expected.
So far the first and second hourly wave counts do not diverge. They both expect the same direction next.
Click on the charts below to enlarge.
Main Wave Count.
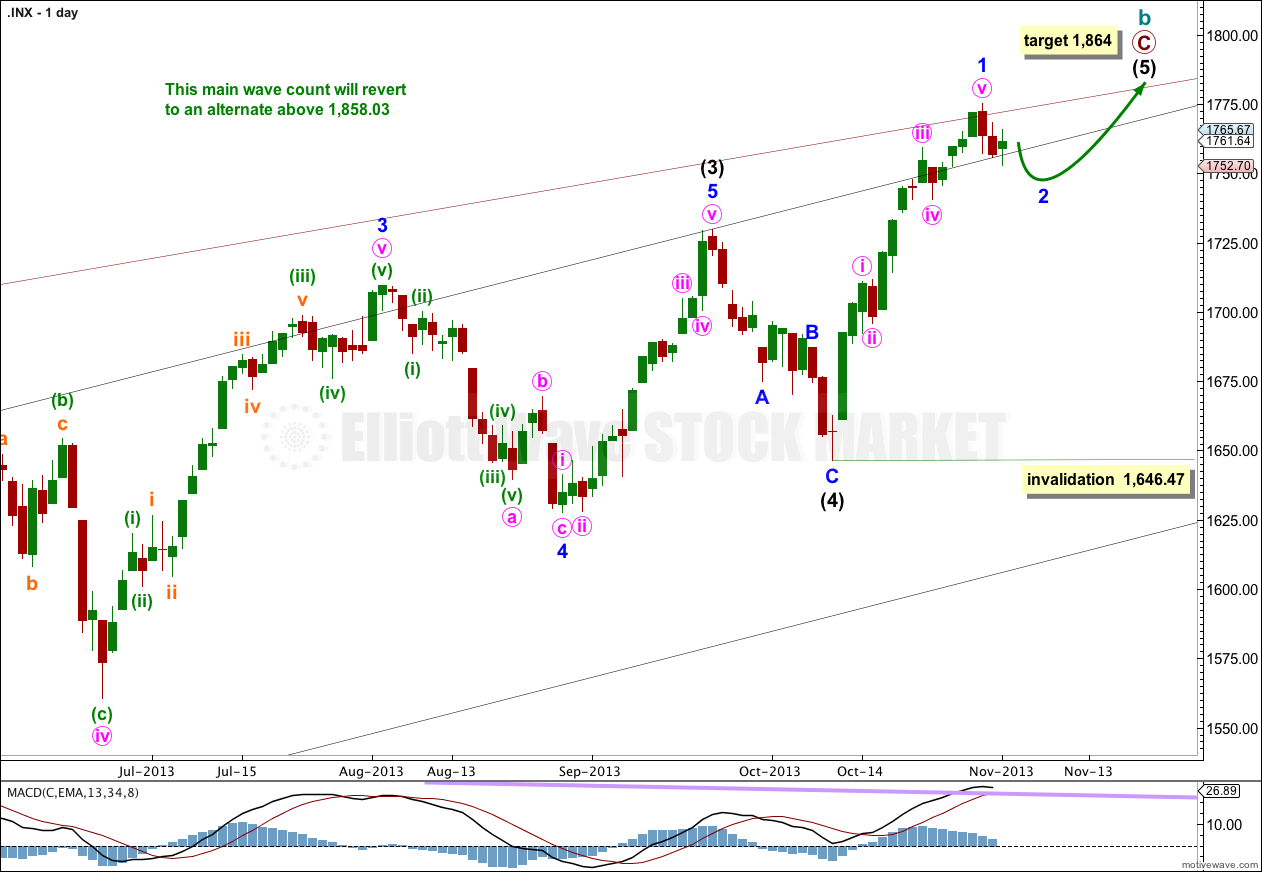
This wave count has a higher probability than the alternate. Upwards movement over the last 4 1/2 years subdivides best as a zigzag. Importantly, it does not show typical features of a third wave having just passed the strongest middle portion (which the alternate says must have recently happened). If something is “off” about the supposed recovery then it must be a B wave because there is plenty that is off in this scenario in terms of social mood.
Price may have found resistance along the upper edge of the big maroon channel from the monthly chart, if the upper trend line is pushed out to encompass all of primary wave A.
At 1,858.03 cycle wave b would reach 138% the length of cycle wave a. This wave count sees a super cycle expanded flat unfolding, and the maximum common length for a B wave within a flat is 138% the length of the A wave. Above this point this wave count would reduce in probability and it would be more likely that a longer term bull market is underway.
Intermediate wave (5) is either incomplete with just minor wave 1 within it completed (as per the first hourly chart below) or, if we move the degree of labeling within it up one degree, intermediate wave (5) and in turn cycle wave b may now be completed.
However, we should always assume the trend remains the same until proven otherwise. I now have four conditions to be satisfied in looking for a trend change. As each condition is satisfied my confidence in this trend change would increase.
At 1,864 intermediate wave (5) would reach equality in length with intermediate wave (1). This is the most common ratio between first and fifth waves so this target has a good probability.
Within intermediate wave (5) no second wave correction may move beyond the start of the first wave. This wave count is invalidated with movement below 1,646.47.
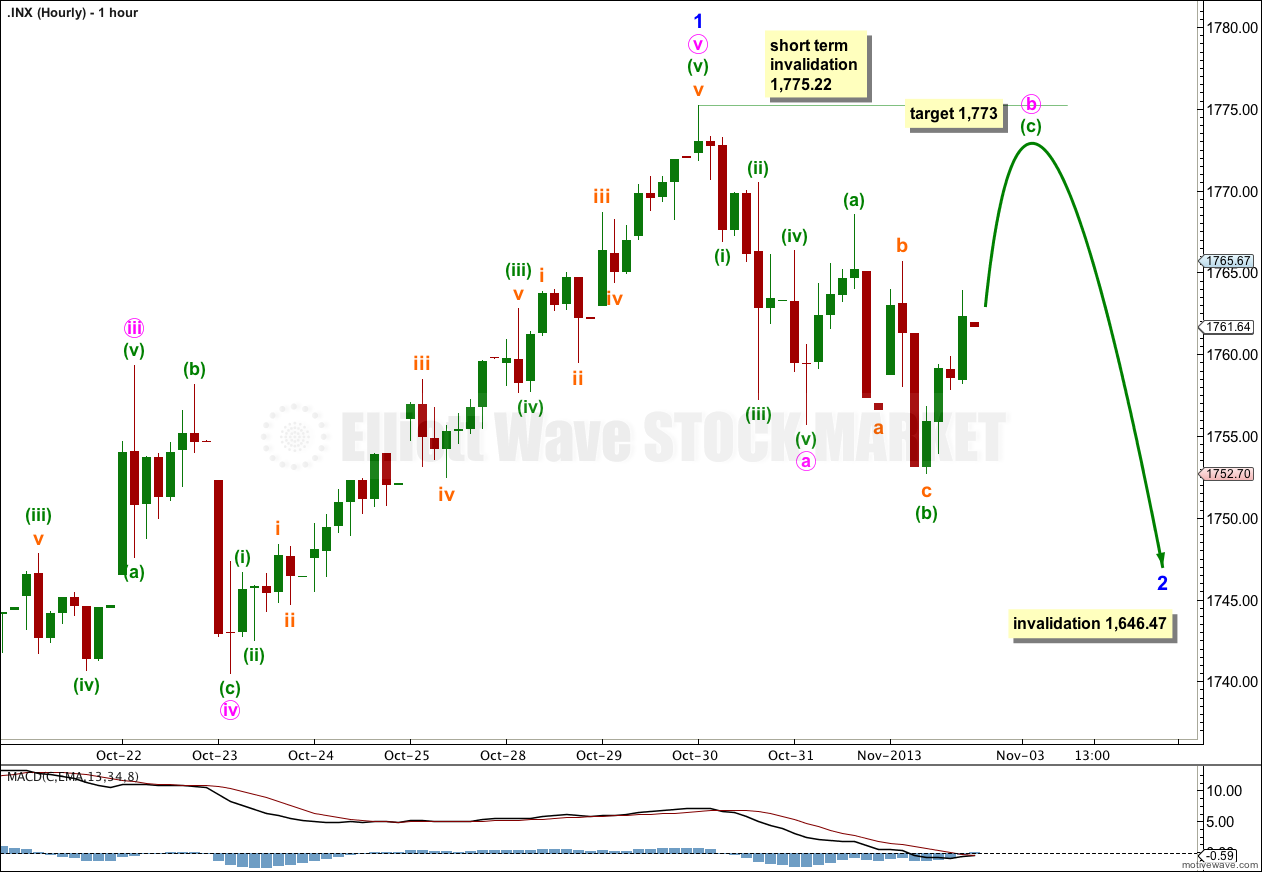
This main wave count assumes the trend remains the same. Within intermediate wave (5) minor wave 1 only may be completed.
At this stage minor wave 2 would most likely be an incomplete zigzag.
If minor wave 2 is a zigzag then within it minute wave b may not move beyond the start of minute wave a at 1,775.22.
At 1,773 minuette wave (c) would reach 1.618 the length of minuette wave (a).
Thereafter, minute wave c should unfold downwards as a five wave structure. When I know where minuette wave b has ended then I will calculate a target for minuette wave c downwards for you. I cannot do that today.
Minor wave 2 may not move beyond the start of minor wave 1. This wave count is invalidated with movement below 1,646.47.
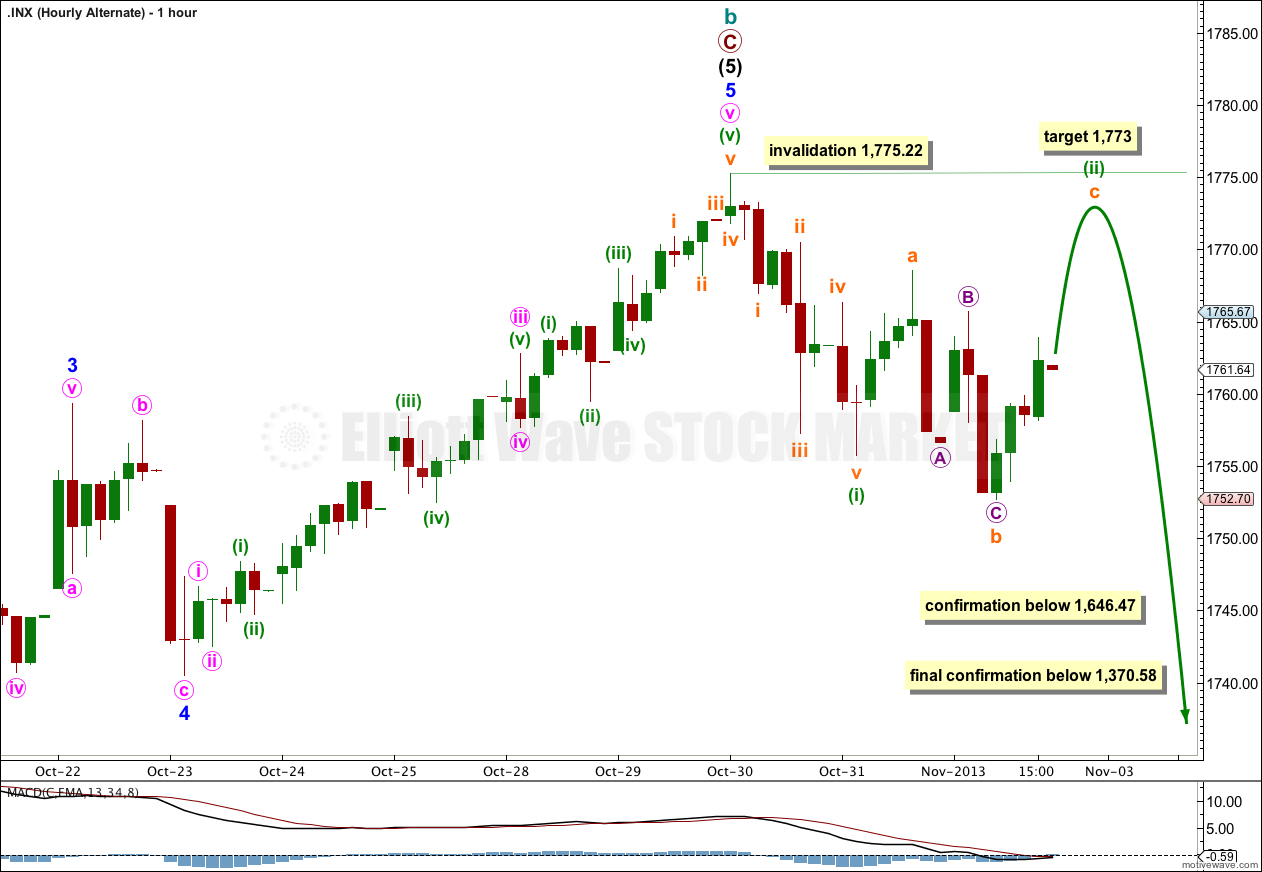
If we simply move the degree of labeling within intermediate wave (5) all up one degree it is possible that this entire wave of cycle wave b is completed. This is an enormous trend change. This wave count has an excellent fit, excellent Fibonacci ratios and a very good look overall. But at this early stage we do not have confirmation of a trend change of this magnitude. The next downwards trend for cycle wave c should last from one to several years and take price substantially below 666.79.
In looking for confirmation and confidence in this wave count I will look for the following (in order):
1. Movement below 1,646.47.
2. A clear breach of the black channel on the daily chart containing primary wave C.
3. A clear breach of the larger maroon channel on the monthly chart containing cycle wave b.
4. Final price confirmation with movement below 1,370.58.
As each condition is satisfied my confidence in this trend change would increase. Below 1,370.58 this would be my only wave count at cycle degree.
Alternate – Bullish Wave Count.
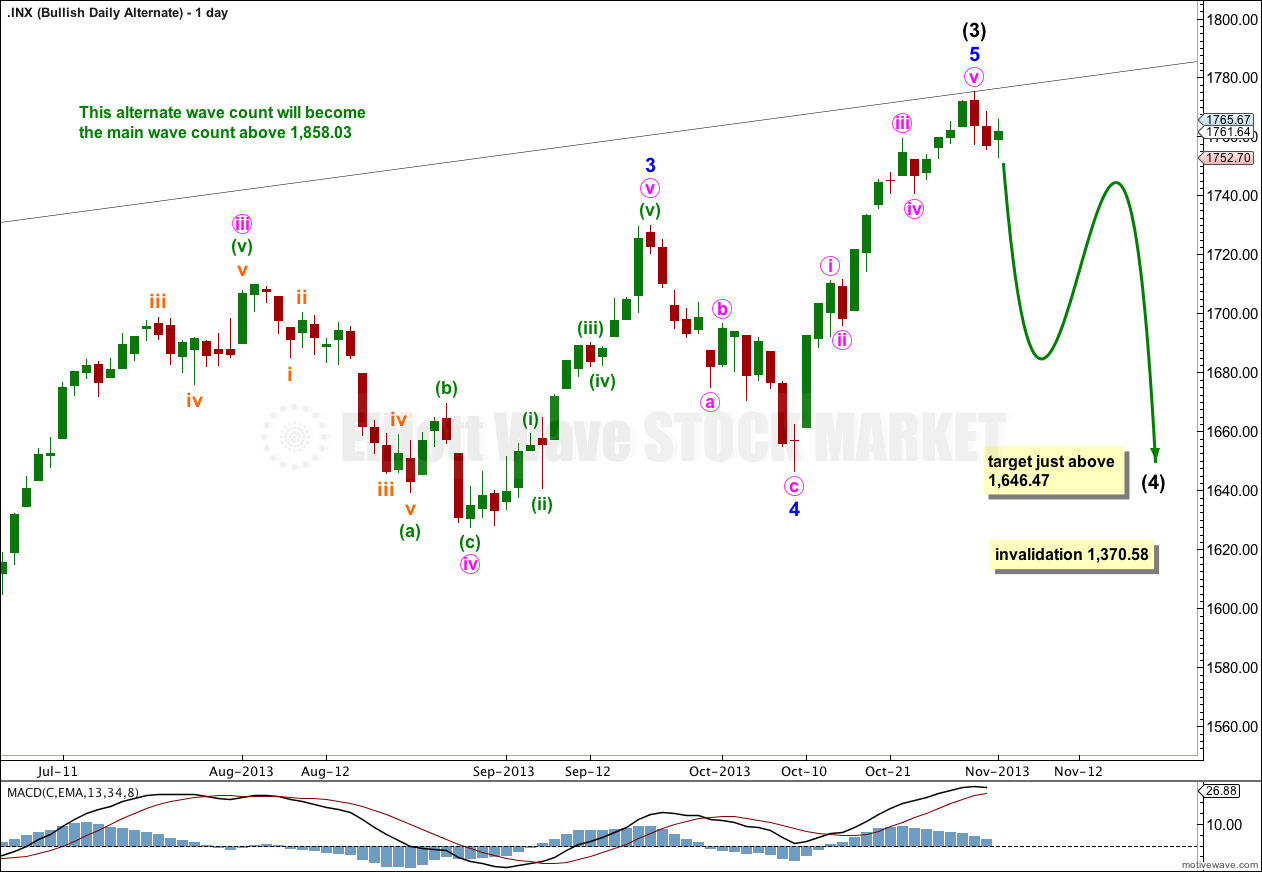
It is possible that we are and have been in a new bull market for a cycle degree fifth wave. Cycle waves should last from one to several years (as a rough guideline).
For this alternate downwards movement may have now begun for intermediate wave (4). This downwards movement must subdivide as a corrective structure, most likely a flat, combination or a triangle.
Intermediate wave (4) may not move into intermediate wave (1) price territory. This wave count would be invalidated with movement below 1,370.58.