The short term target from last analysis, at 1,713, was almost reached, but price moved lower before turning upwards.
Because the alternate wave count now does not work for the Dow I will discard it for the S&P also. I have just the one wave count for you today.
Click on the charts below to enlarge.
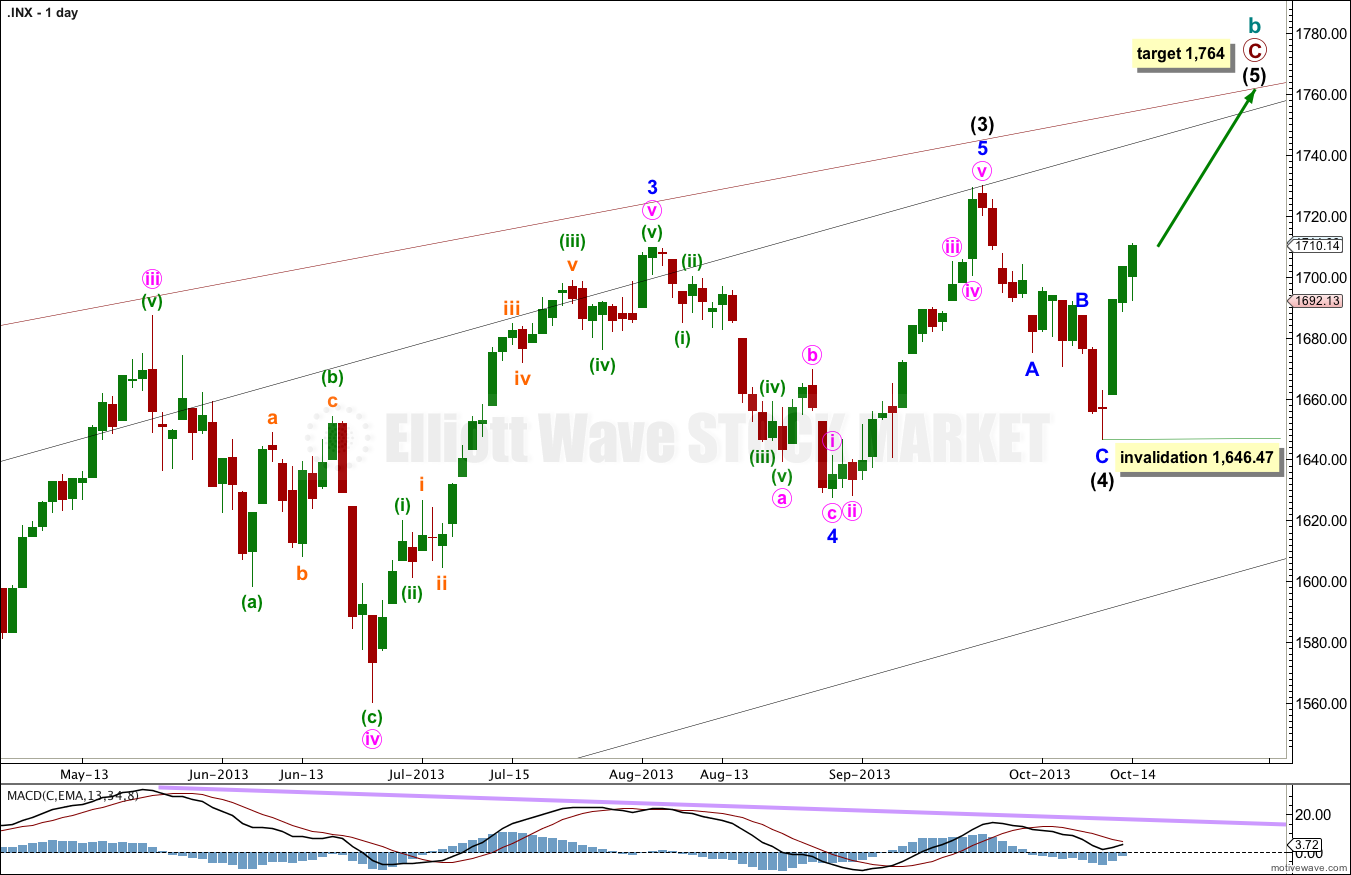
Intermediate wave (4) is now over, it lasted 14 days, just one more than a Fibonacci 13.
If intermediate wave (5) exhibits a Fibonacci time relationship it may end in a Fibonacci 13 days (or sessions) on 28th October.
At 1,764 primary wave C would reach equality with primary wave A.
Within intermediate wave (5) no second wave correction may move beyond the start of the first wave. This wave count is invalidated with movement below 1,646.47.
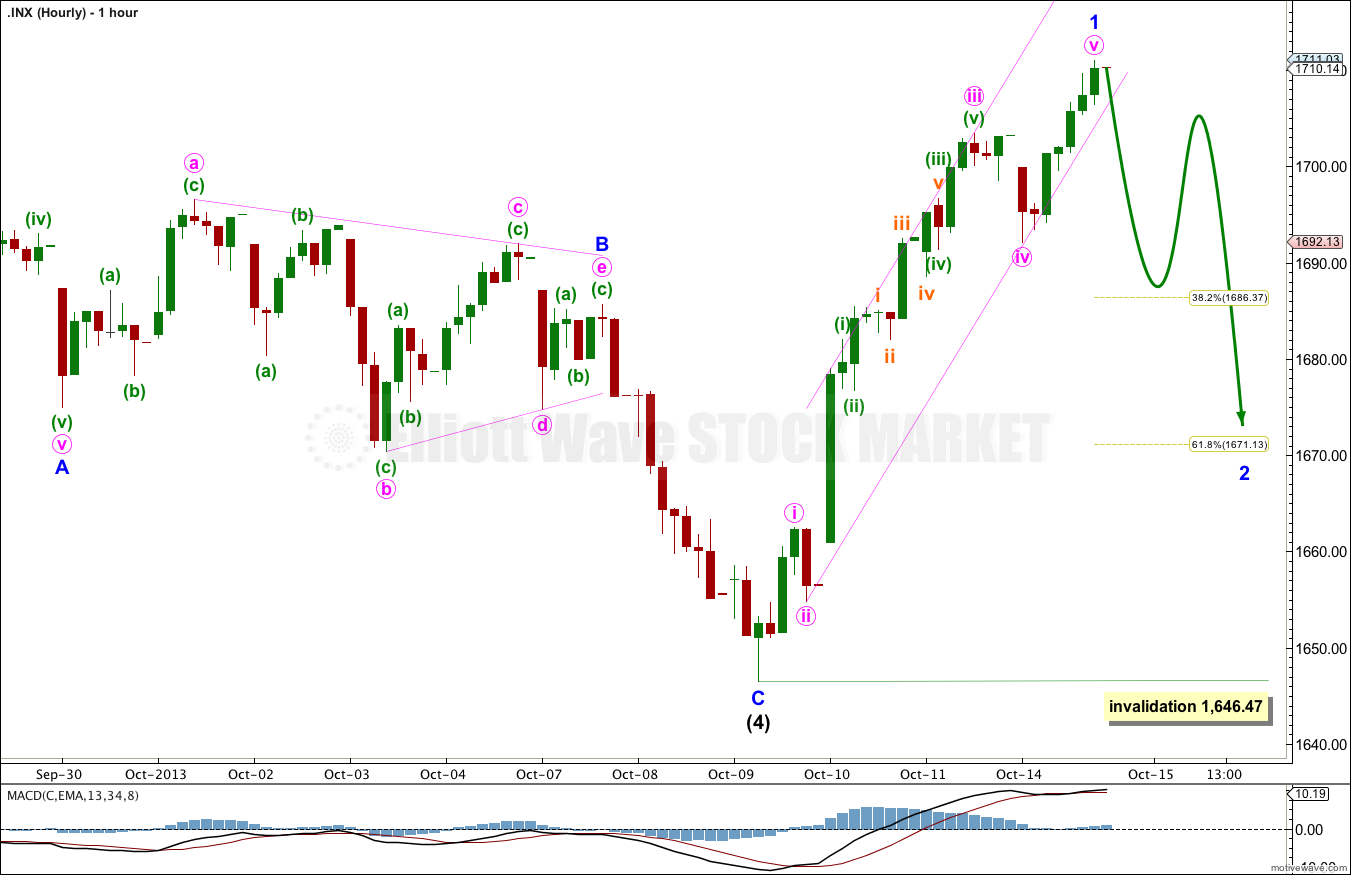
Downwards movement which began Monday’s session was most likely a fourth wave correction within minor wave 1.
Ratios within minor wave 1 are: minute wave iii has no Fibonacci ratio to minute wave i, and minute wave v is is just 0.32 longer than 1.618 the length of minute wave i.
Minor wave 1 may have completed in a Fiboancci three days. If minor waves 2 and 4 both last two days each, and minor waves 3 and 5 both last three days each, then intermediate wave (5) would end in a Fibonacci 13 sessions on 28th October.
I would expect choppy downwards overlapping movement for one or more likely two days for a second wave correction. It may end about either the 0.382 or 0.618 Fibonacci ratios of minor wave 1.
Draw a channel about minor wave 1 using Elliott’s second technique. Draw the first trend line from the lows of minute waves ii to iv, then place a parallel copy upon the high of minute wave iii. When this channel is very clearly breached by downwards movement then I would have some confidence that minor wave 1 is over and minor wave 2 is underway.
Minor wave 2 may not move beyond the start of minor wave 1. This wave count is invalidated with movement below 1,646.47.


