
Yesterday’s analysis expected the completion of a triangle before downwards movement. The triangle had already completed and Tuesday’s session began with downwards movement.
Click on the charts below to enlarge.
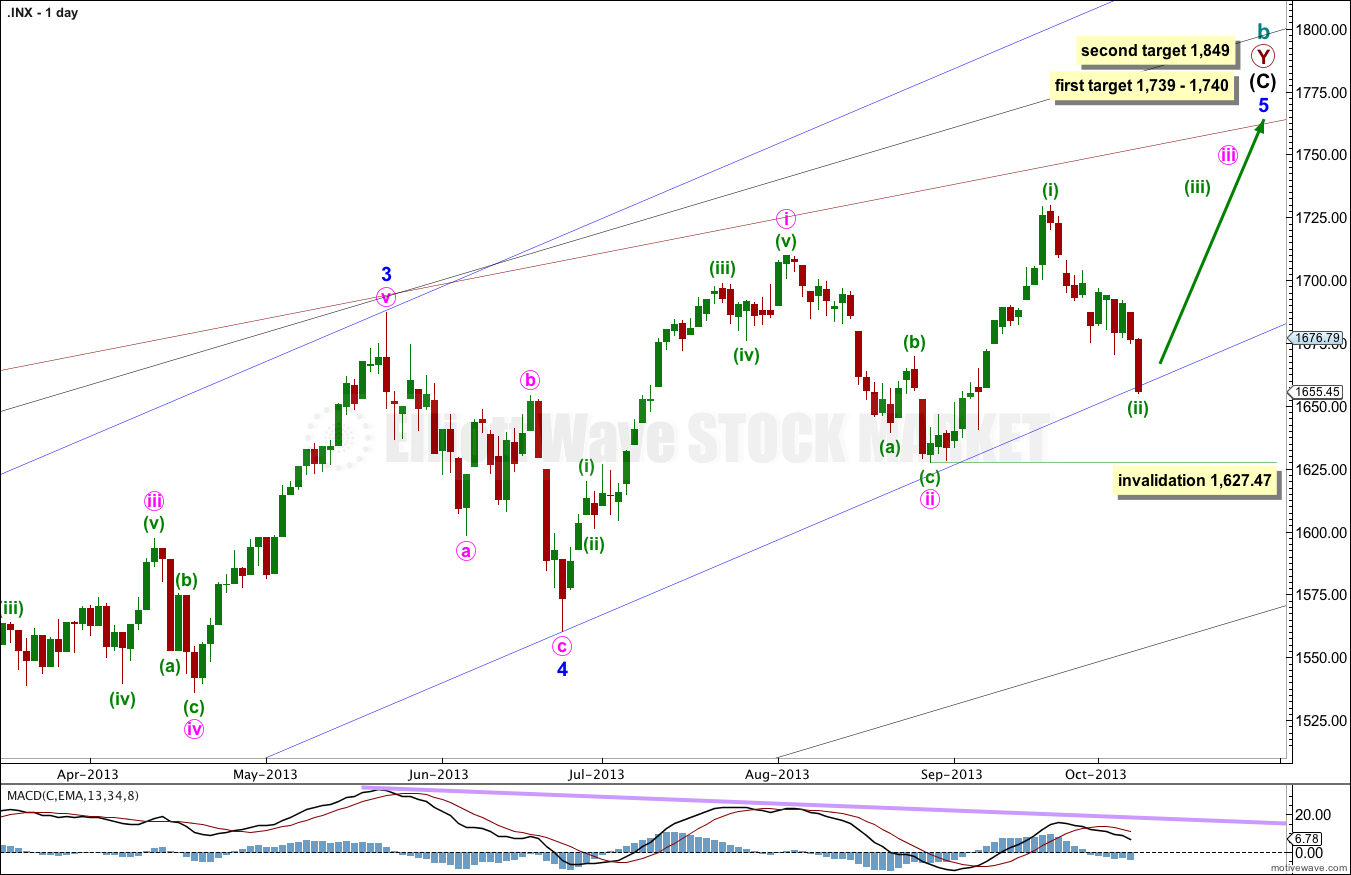
At 1,740 intermediate wave (C) would reach equality with intermediate wave (A). At 1,739 minor wave 5 would reach 0.618 the length of minor wave 3.
If price rises through this first target the next target will be used. At 1,849 minor wave 5 would reach equality with minor wave 3.
When minute waves iii and iv within minor wave 5 are complete I will add to the target calculation at minute wave degree, so at that stage it may change.
Minor wave 1 lasted a Fibonacci 21 days, minor wave 2 lasted a Fibonacci 8 days, minor wave 3 has no Fibonacci duration at 98 days, and minor wave 4 lasted 22 days, just one day longer than a Fibonacci 21.
Minor wave 5 may not exhibit a Fibonacci time relationship. The next possibility may be the 29th of October (give or take two days either side of this date) where minor wave 5 would have lasted a Fibonacci 89 days. This is a date to look out for, but cannot be relied upon because Fibonacci time relationships do not occur often enough to be reliable.
Keep drawing the wider parallel channels from the monthly chart and copy them over to the daily chart.
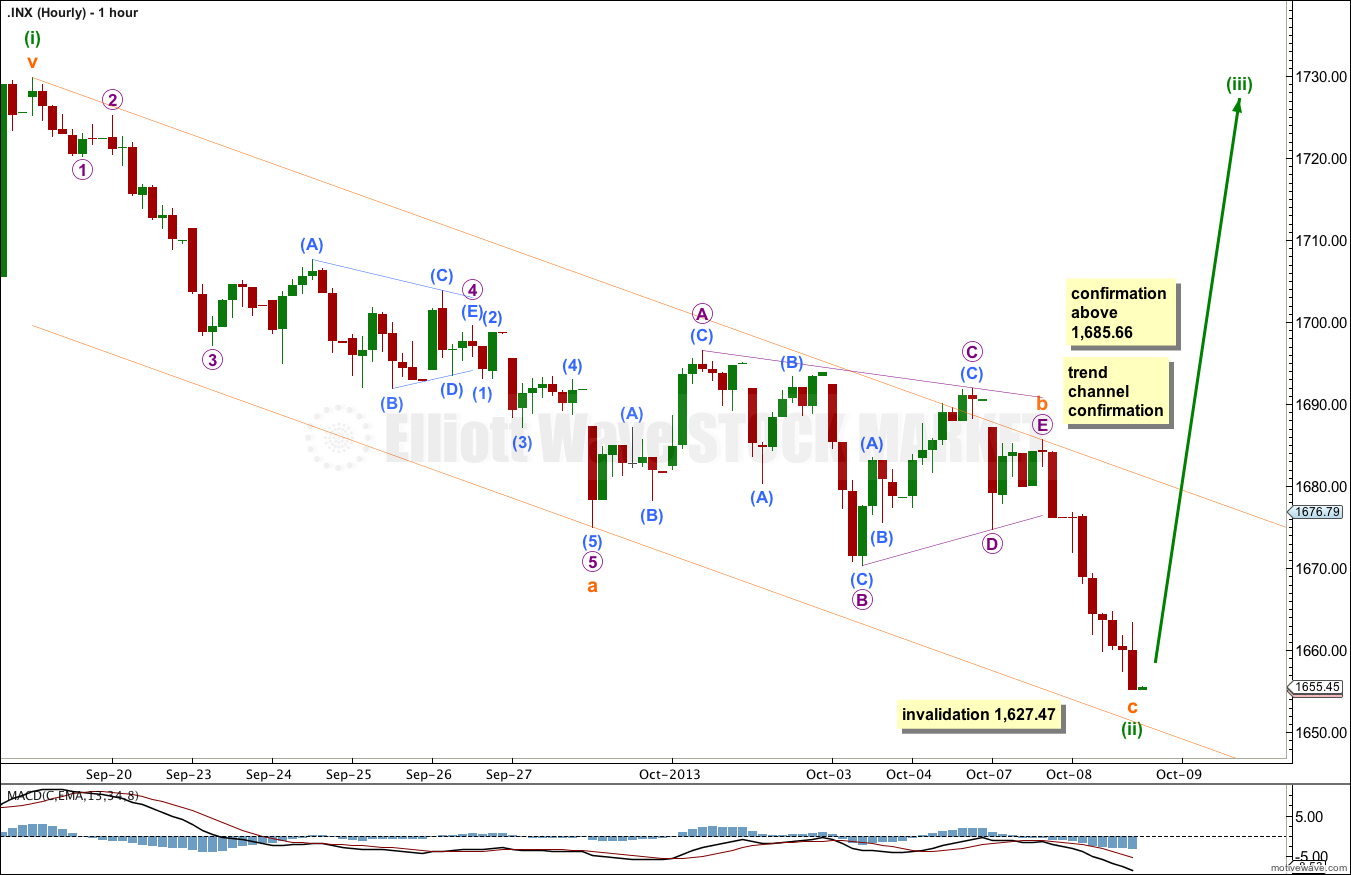
The triangle for subminuette wave b was already completed yesterday. Downwards movement may have been subminuette wave c which may be over, or could continue further. There is not enough upwards movement at the end of Tuesday’s session on the five minute chart to indicate that this downwards wave is completed.
Movement above the parallel channel drawn here about minuette wave (ii) would indicate a trend change. Movement above 1,685.66 would be price indication of a trend change.
At that stage I would expect this wave count should be within a third wave upwards. The middle of a third wave, as this would be, should see a strong increase in momentum. If momentum does not show a strong increase, but shows a decrease, then the alternate wave count below would have a much higher probability.
I will not calculate a target for minuette wave (iii) until I have some confirmation that it is underway.
Minuette wave (ii) may not move beyond the start of minuette wave (i). This wave count is invalidated with movement below 1,627.47.
Alternate Wave Count.
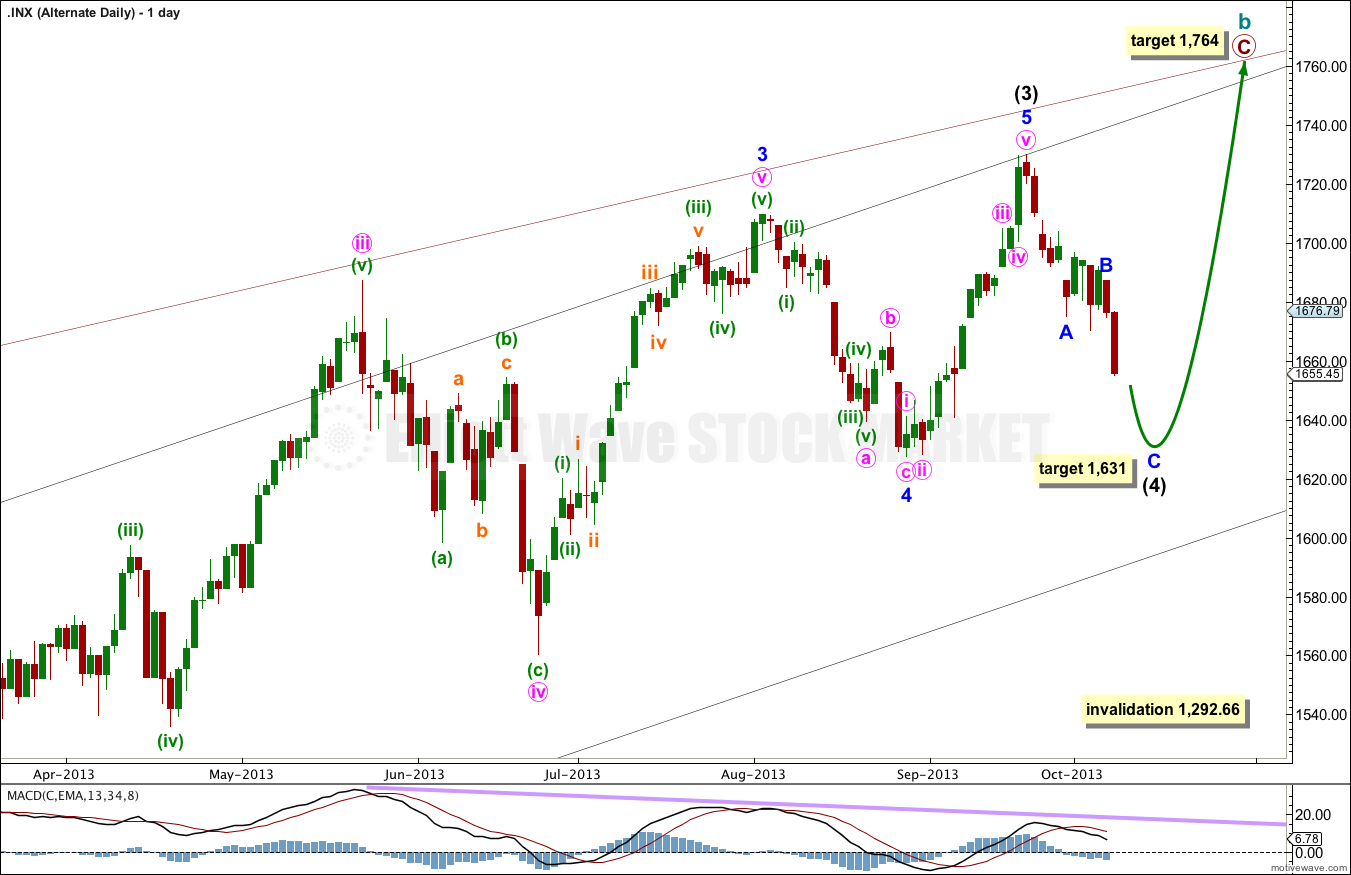
This wave count was first presented yesterday, and in weekly charts as well.
Recent movement on the S&P for the last few weeks looks like a series of fourth and fifth waves, not first and second waves.
At 1,764 primary wave C would reach equality with primary wave A.
At this stage for this alternate wave count I would expect more downwards movement for minor wave C so that intermediate wave (4) is better in proportion to intermediate wave (2) which lasted 20 days. So far intermediate wave (4) has lasted only 13 days. I would also expect intermediate wave (4) to be deeper, ending closer to the end of minor wave 4 at 1,627.47.
At 1,631 minor wave C would reach equality in length with minor wave A.
Intermediate wave (4) may not move into intermediate wave (1) price territory. This wave count is invalidated with movement below 1,292.66.
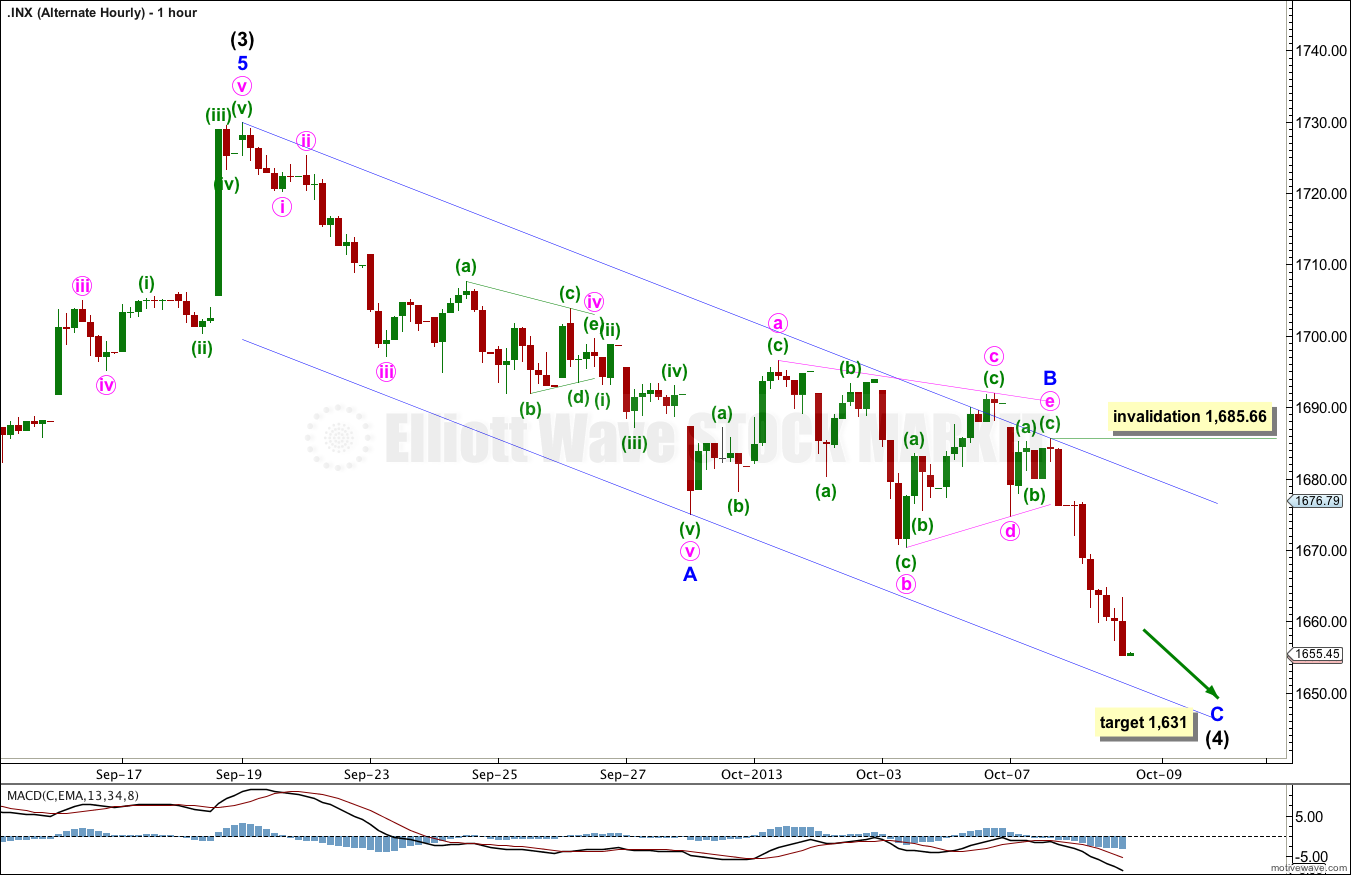
The subdivisions for this alternate are exactly the same as the main wave count. The degree of labeling differs.
Minor wave C may be incomplete. Within it no second wave correction may move beyond the start of the first wave. This wave count is invalidated in the short term with movement above 1,685.66.
If this wave count is invalidated with upwards movement then it would be likely that intermediate wave (4) is over and intermediate wave (5) should be underway.