
Yesterday’s analysis expected a little more upwards movement towards a target at 1,731 before price turned downwards for a fourth wave correction. Price did move very slightly higher, falling just 1.14 points short of the target before turning lower as expected.
The wave count remains the same. I still have just the one daily and one hourly wave count for you.
Click on the charts below to enlarge.
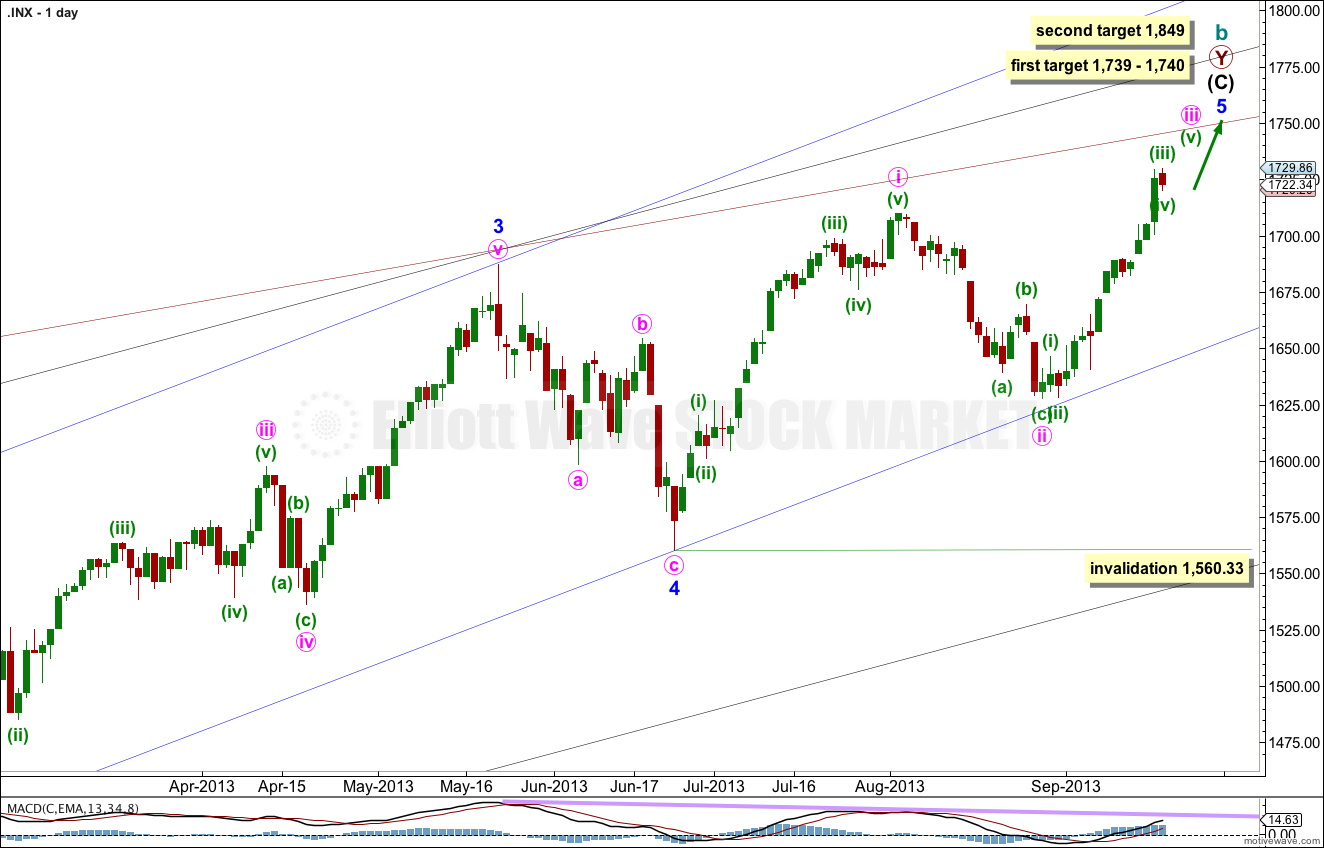
At 1,740 intermediate wave (C) would reach equality with intermediate wave (A). At 1,739 minor wave 5 would reach 0.618 the length of minor wave 3.
If price rises through this first target the next target will be used. At 1,849 minor wave 5 would reach equality with minor wave 3.
When minute waves iii and iv within minor wave 5 are complete I will add to the target calculation at minute wave degree, so at that stage it may change.
Within minor wave 5 minute wave ii may not move beyond the start of minute wave i. This wave count is invalidated with movement below 1,560.33.
Minor wave 1 lasted a Fibonacci 21 days, minor wave 2 lasted a Fibonacci 8 days, minor wave 3 has no Fibonacci duration at 98 days, and minor wave 4 lasted 22 days, just one day longer than a Fibonacci 21.
Minor wave 5 may not exhibit a Fibonacci time relationship. The next possibility may be the 29th of October (give or take two days either side of this date) where minor wave 5 would have lasted a Fibonacci 89 days. This is a date to look out for, but cannot be relied upon because Fibonacci time relationships do not occur often enough to be reliable.
Keep drawing the wider parallel channels from the monthly chart and copy them over to the daily chart.
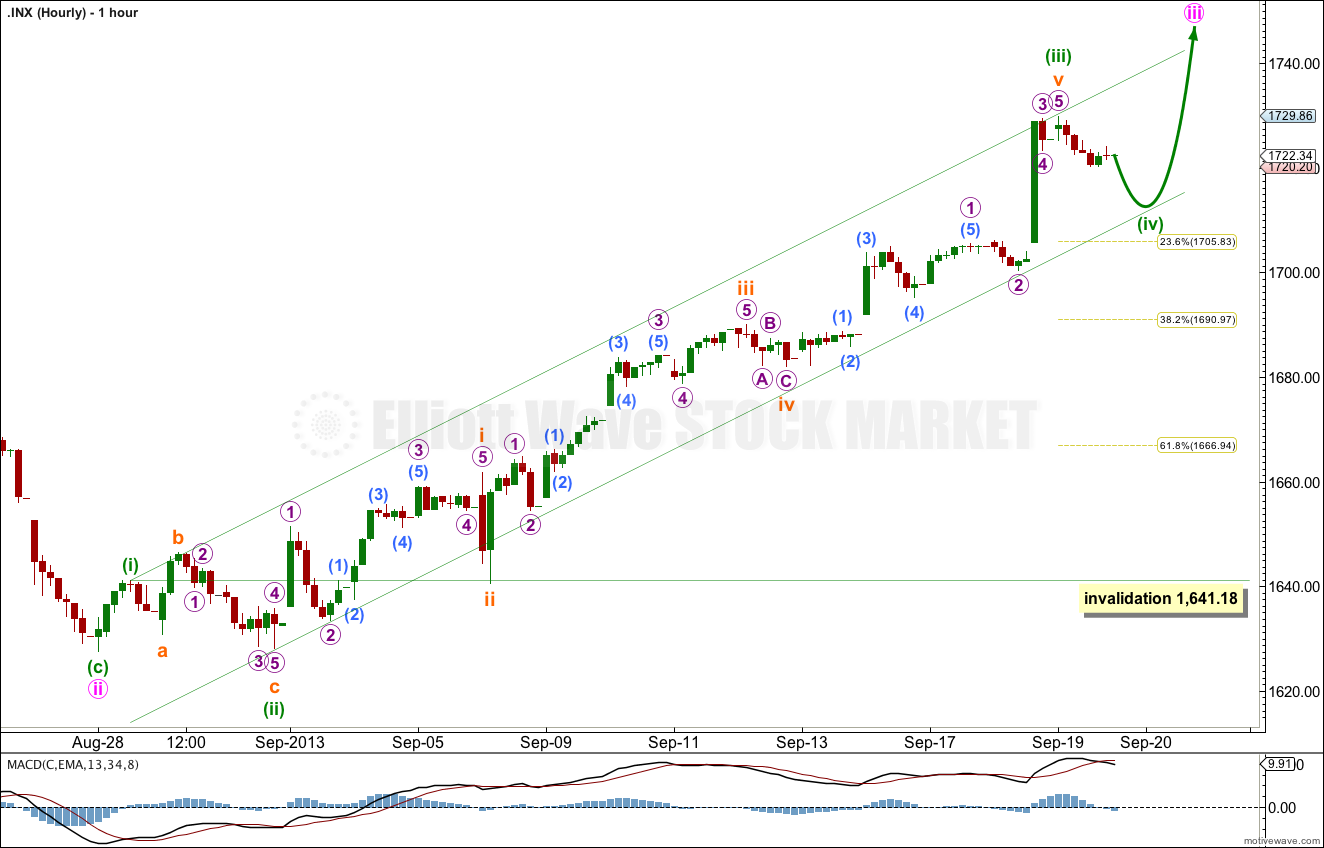
Minuette wave (iii) is now completed and is 7.84 points longer than 6.854 times the length of minuette wave (i). This is a 7.7% variation; I consider less than 10% to be acceptable.
Ratios within minuette wave (iii) are: subminuette wave iii has no Fibonacci ratio to subminuette wave i, and subminuette wave v is just 1.45 points short of equality with subminuette wave iii.
Minuette wave (ii) was a very deep 96% expanded flat correction. I will expect minuette wave iv to show alternation with minuette wave (ii).
Minuette wave (iv) is most likely to be a zigzag, double, combination or triangle. It is most likely to be shallow, reaching down to the 0.236 or 0.382 Fibonacci ratios. I will use the Fibonacci ratios as targets.
If price keeps falling through the 0.382 Fibonacci ratio at 1,690.97 then the next expectation for minuette wave (iv) to end would be within the price range of the fourth wave of one lesser degree between 1,689.97 and 1,681.96.
So far minuette wave (iv) is showing on the daily chart as a single red candlestick. It is just possible it is over here, but more likely it is not. We may see it continue lower to close the gap left within submicro wave (3) of micro wave 4 of subminuette wave v.
Minuette wave (iv) may not move into minuette wave (i) price territory. This wave count is invalidated with movement below 1,641.18.