
Price moved very slightly higher, but failed to reach the target. The short term structure is now complete and a small fourth wave correction is expected.
Click on the charts below to enlarge.
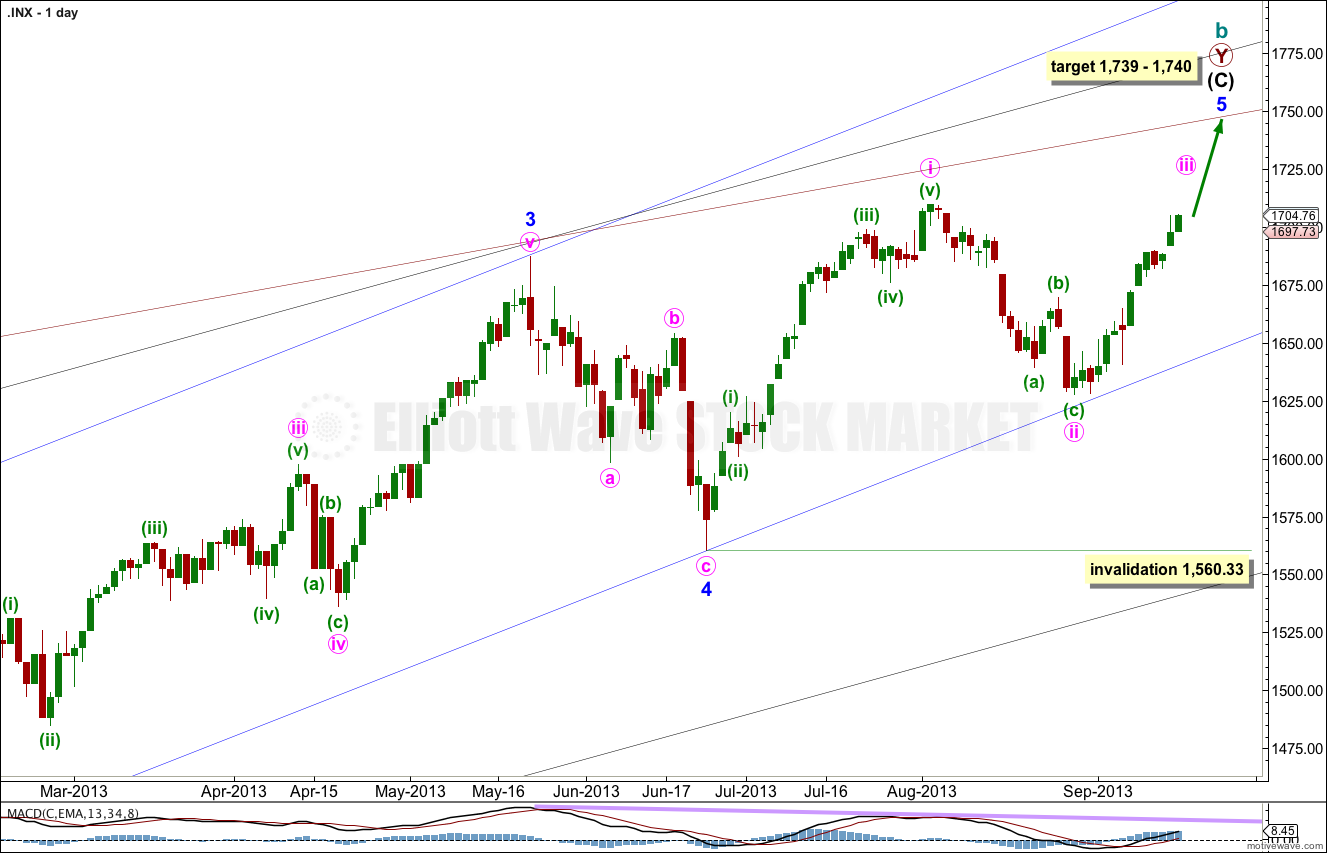
This wave count agrees with MACD and has some nice Fibonacci ratios in price and Fibonacci relationships in time.
Minor wave 3 is 15.1 points longer than 2.618 the length of minor wave 1.
Ratios within minor wave 3 are: there is no Fibonacci ratio between minute waves iii and i, and minute wave v is 5.44 points longer than equality with minute wave iii.
At 1,740 intermediate wave (C) would reach equality with intermediate wave (A). At 1,739 minor wave 5 would reach 0.618 the length of minor wave 3.
Within minor wave 5 minute wave ii may not move beyond the start of minute wave i. This wave count is invalidated with movement below 1,560.33.
Minor wave 1 lasted a Fibonacci 21 days, minor wave 2 lasted a Fibonacci 8 days, minor wave 3 has no Fibonacci duration at 98 days, and minor wave 4 lasted 22 days, just one day longer than a Fibonacci 21.
Minor wave 5 may not exhibit a Fibonacci time relationship. The next possibility may be the 29th of October (give or take two days either side of this date) where minor wave 5 would have lasted a Fibonacci 89 days. This is a date to look out for, but cannot be relied upon because Fibonacci time relationships do not occur often enough to be reliable.
Keep drawing the wider parallel channels from the monthly chart and copy them over to the daily chart.
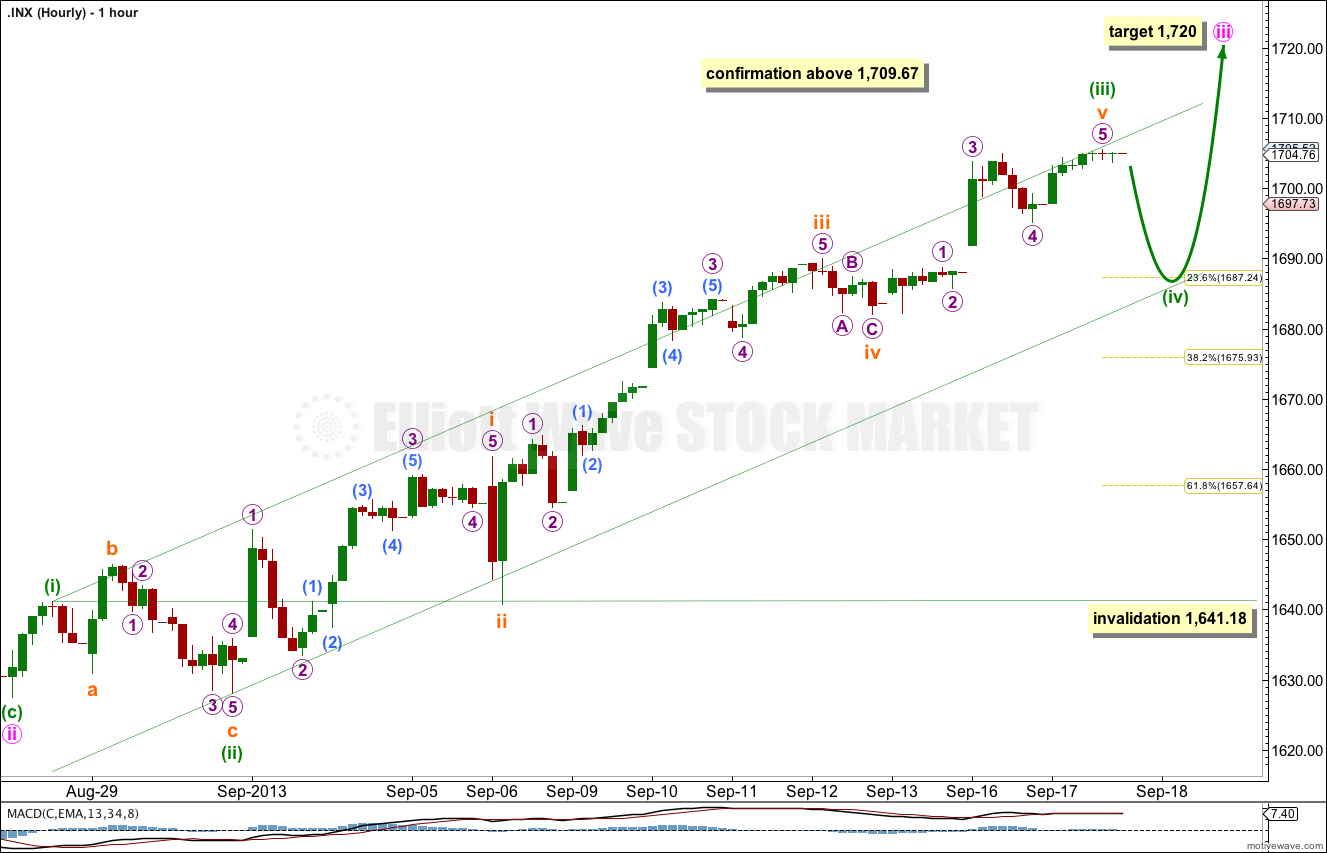
We did not see the upwards movement I was expecting to the short term target at 1,712. The target was calculated at subminuette wave degree. There are no adequate Fibonacci ratios between subminuette waves i, iii, and v.
On the five and one minute charts the structure within micro wave 5 is now completed.
There is no Fibonacci ratio between minuette waves (i) and (iii) (but this was expected). This makes it more likely we should see a Fibonacci ratio between minuette wave (v) and either of minuette waves (i) or (iii).
Ratios within subminuette wave v are: micro wave 3 is 0.24 points longer than 2.618 the length of micro wave 1, and micro wave 5 is 0.58 points short of 1.618 the length of micro wave 1.
Minuette wave (ii) was a deep 96% expanded flat correction. Given the guideline of alternation I would expect minuette wave (iv) to be relatively shallow. I favour the 0.236 Fibonacci ratio at 1,687.24 as a target for minuette wave (iv) to end. The most likely structure would be a zigzag, combination or triangle.
Minuette wave (iv) is likely to end within the price territory of the fourth wave of one lesser degree between 1,689.67 and 1,681.96. The 0.236 Fibonacci ratio is nicely within this range.
Minuette wave (iv) may not move into minuette wave (i) price territory. This wave count is invalidated with movement below 1,641.18.
Alternate Wave Count.
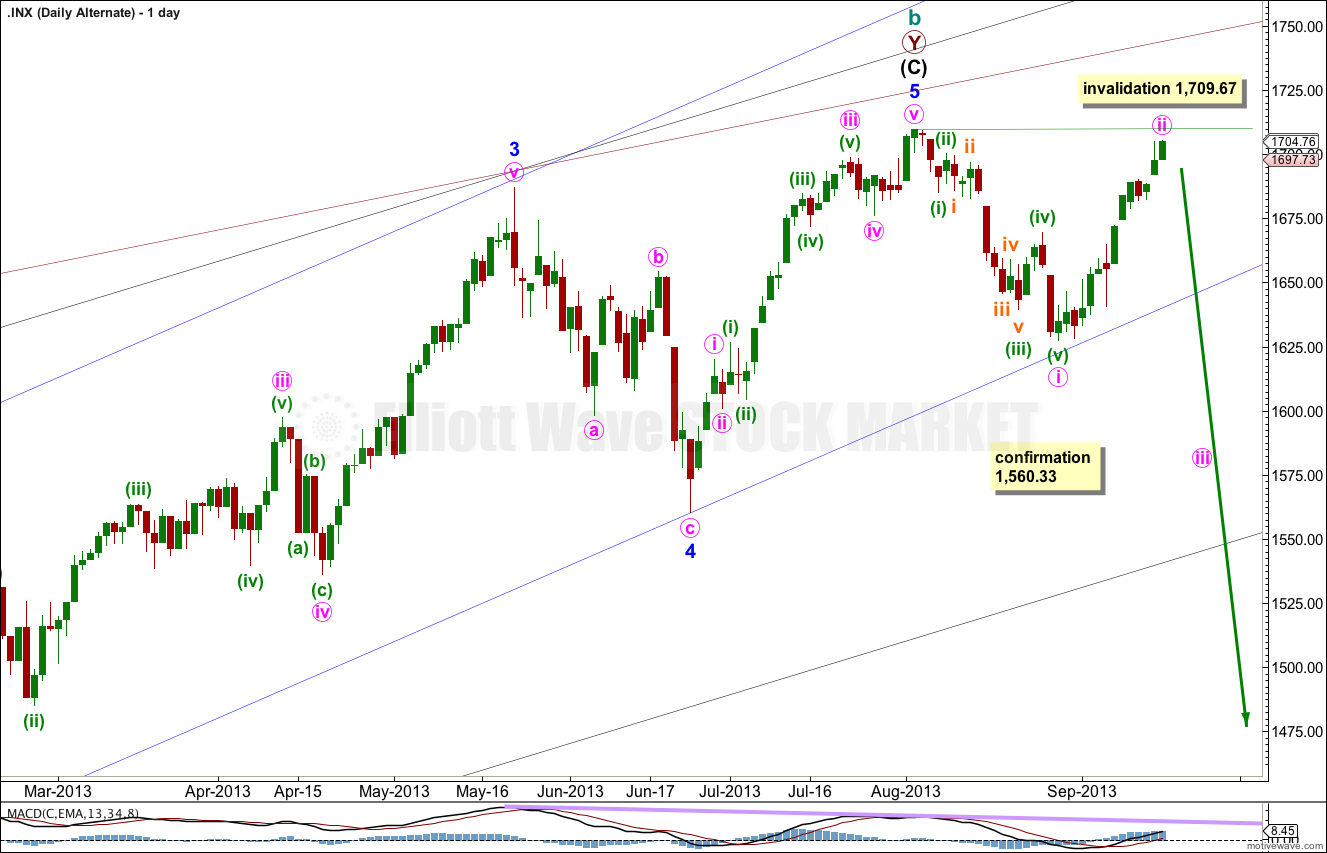
While price remains below 1,709.67 it will remain possible that we have recently seen a trend change at cycle degree. However, I will always assume the trend remains the same until proven otherwise. If the main wave count is correct then this alternate may be invalidated this week.
This is a huge trend change. The new downwards trend should last from one to several years and take price substantially below 666.76. I want to see some confirmation before having any confidence in this wave count.
I will assume the trend is upwards until this wave count is confirmed with movement below 1,560.33, and then with a breach of the black parallel channel on the daily chart.
This wave count is the same as the main wave count, except the degree of labeling in the final upwards wave of minor wave 5 is moved up one degree.
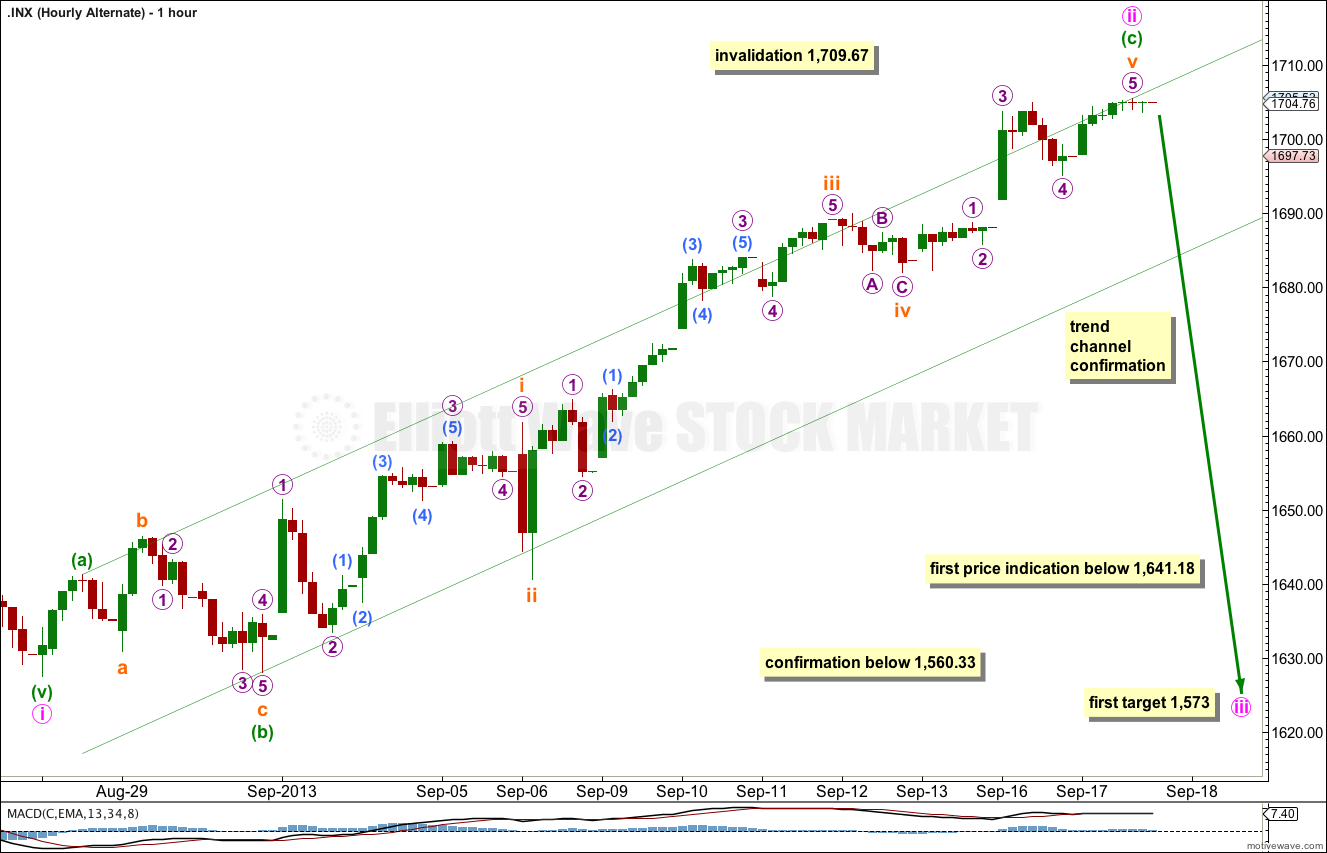
At this stage if this upwards movement is a deep second wave correction then the structure is complete. There is no Fibonacci ratio between minuette waves (a) and (c), which although quite common the length of minuette wave (c) in relation to minuette wave (a) does look unusual.
The next wave should be a strong third wave down. At 1,573 minute wave iii would reach 1.618 the length of minute wave i.
Clear downwards movement below the channel drawn about minute wave ii would provide an indication this wave count may be correct. Movement below 1,641.18 would provide some price indication this wave count may be correct.
If this wave count is confirmed with movement below 1,560.33 then I would consider moving the labeling all up one degree. The size of these movement look more like minor degree waves than minute.
Minute wave ii may not move beyond the start of minute wave i. This wave count is invalidated with movement above 1,709.67.