
Yesterday’s analysis expected more upwards movement towards a short term target zone at 1,690 to 1,694, favouring the lower end of the target zone. Price has moved higher to reach 1,689.10, just below the target.
The wave counts remain mostly the same, except I have a much better interpretation for the main wave count for you today.
Click on the charts below to enlarge.
Main Wave Count.
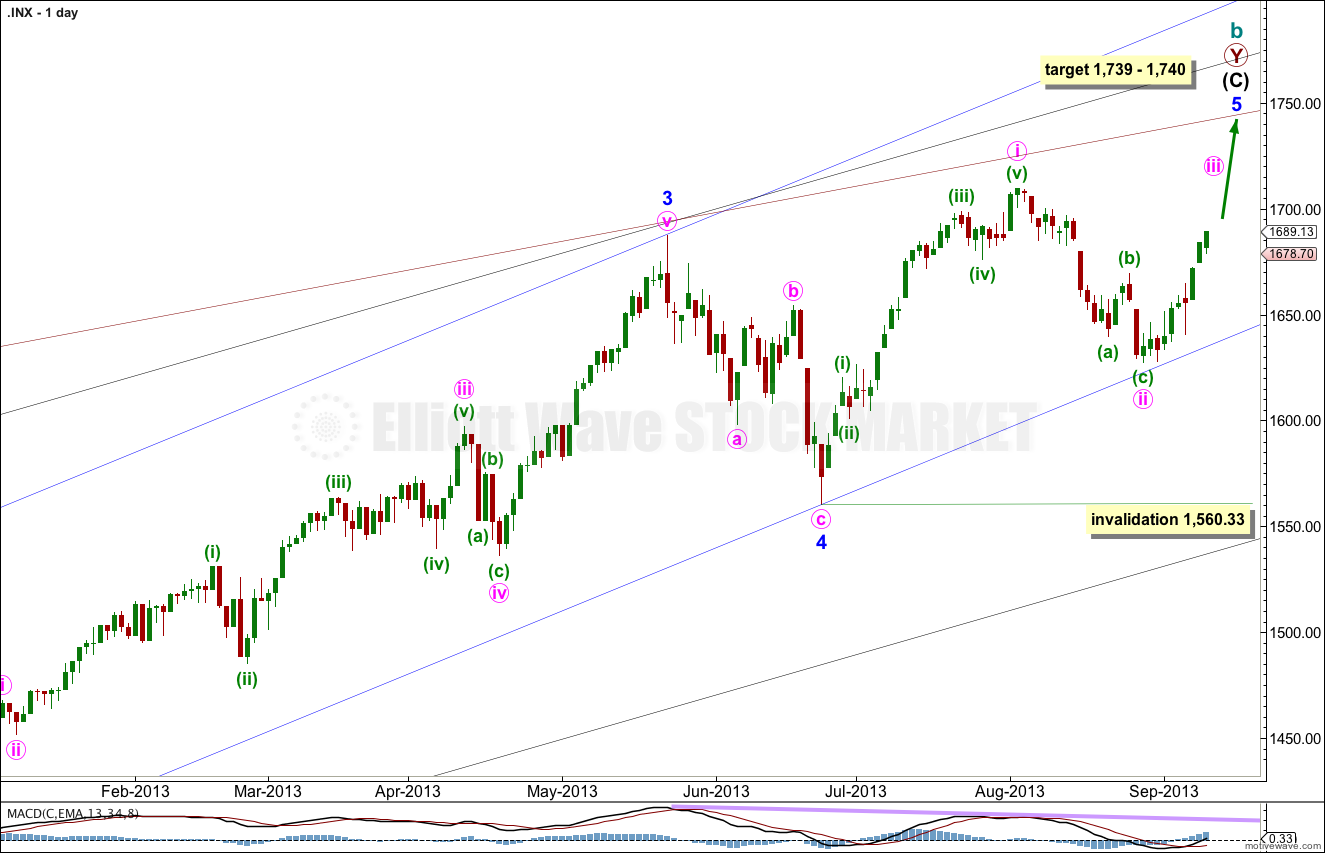
This wave count agrees with MACD and has some nice Fibonacci ratios in price and Fibonacci relationships in time.
Minor wave 3 is 15.1 points longer than 2.618 the length of minor wave 1.
Ratios within minor wave 3 are: there is no Fibonacci ratio between minute waves iii and i, and minute wave v is 5.44 points longer than equality with minute wave iii.
At 1,740 intermediate wave (C) would reach equality with intermediate wave (A). At 1,739 minor wave 5 would reach 0.618 the length of minor wave 3.
Within minor wave 5 minute wave ii may not move beyond the start of minute wave i. This wave count is invalidated with movement below 1,560.33.
Minor wave 1 lasted a Fibonacci 21 days, minor wave 2 lasted a Fibonacci 8 days, minor wave 3 has no Fibonacci duration at 98 days, and minor wave 4 lasted 22 days, just one day longer than a Fibonacci 21.
Minor wave 5 may not exhibit a Fibonacci time relationship. The next possibility may be the 29th of October (give or take two days either side of this date) where minor wave 5 would have lasted a Fibonacci 89 days.
Keep drawing the wider parallel channels from the monthly chart and copy them over to the daily chart.
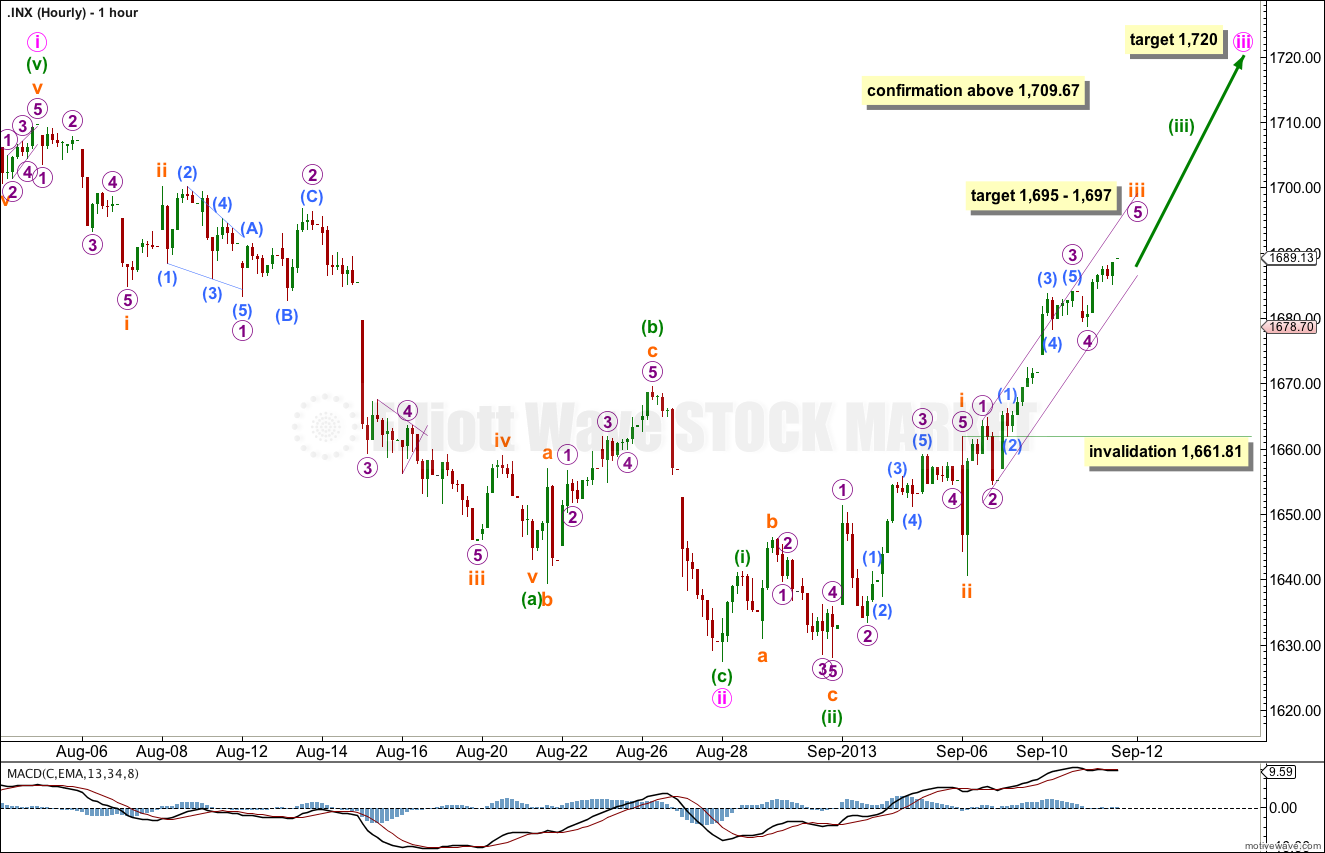
I have taken some time to try to see a better interpretation than the previous double zigzag for minute wave ii. This wave count has much better fit, more typical structures, and a higher probability. I do still think that the downwards movement labeled now as minute wave ii zigzag does fit a little better as a five wave impulse, but this movement is ambiguous. It can be seen either way.
Minute wave ii fits better as a single zigzag ending at the price low of 1,627.47. Within the zigzag minuette wave (c) is just 0.83 longer than 0.618 the length of minuette wave (a).
Ratios within minuette wave (a) are: subminuette wave iii has no Fibonacci ratio to subminuette wave i, and subminuette wave v is 0.63 longer than 0.618 the length of submiuette wave i.
Within the new upwards trend of minute wave iii minuette wave (i) may be complete and very short. There may not be a Fibonacci ratio exhibited between minuette waves (iii) and (i).
Within minuette wave (iii) the subdivisions here are exactly the same as yesterday except it is all moved down one degree.
The middle of this third wave may now be over. Within micro wave 3 there are no adequate Fibonacci ratios between submicro waves (1), (3) and (5).
There is no Fibonacci ratio between micro waves 3 and 1. This makes it more likely we should see a Fibonacci ratio between micro wave 5 and either of 3 or 1. At 1,697 micro wave 5 would reach 0.618 the length of micro wave 3.
At 1,695 subminuette wave iii would reach 1.618 the length of subminuette wave i.
Draw a small channel about the middle of this third wave using Elliott’s technique. Draw the first trend line from the highs of micro waves 1 to 3, then place a parallel copy upon the low of micro wave 2. Expect micro wave 5 to find resistance at the upper edge of this channel. When this channel is clearly breached by downwards movement then subminuette wave iii should be over and subminuette wave iv should be underway.
When subminuette wave iii is completed we should see a fourth wave correction for subminuette wave iv which may not move back into subminuette wave i price territory. This wave count is invalidated with movement below 1,661.81. Subminuette wave iv should not be too long lasting; it is most likely to be over within a session.
When subminuette wave iv is completed I will use subminuette wave degree to calculate a target for minuette wave (iii).
Alternate Wave Count.
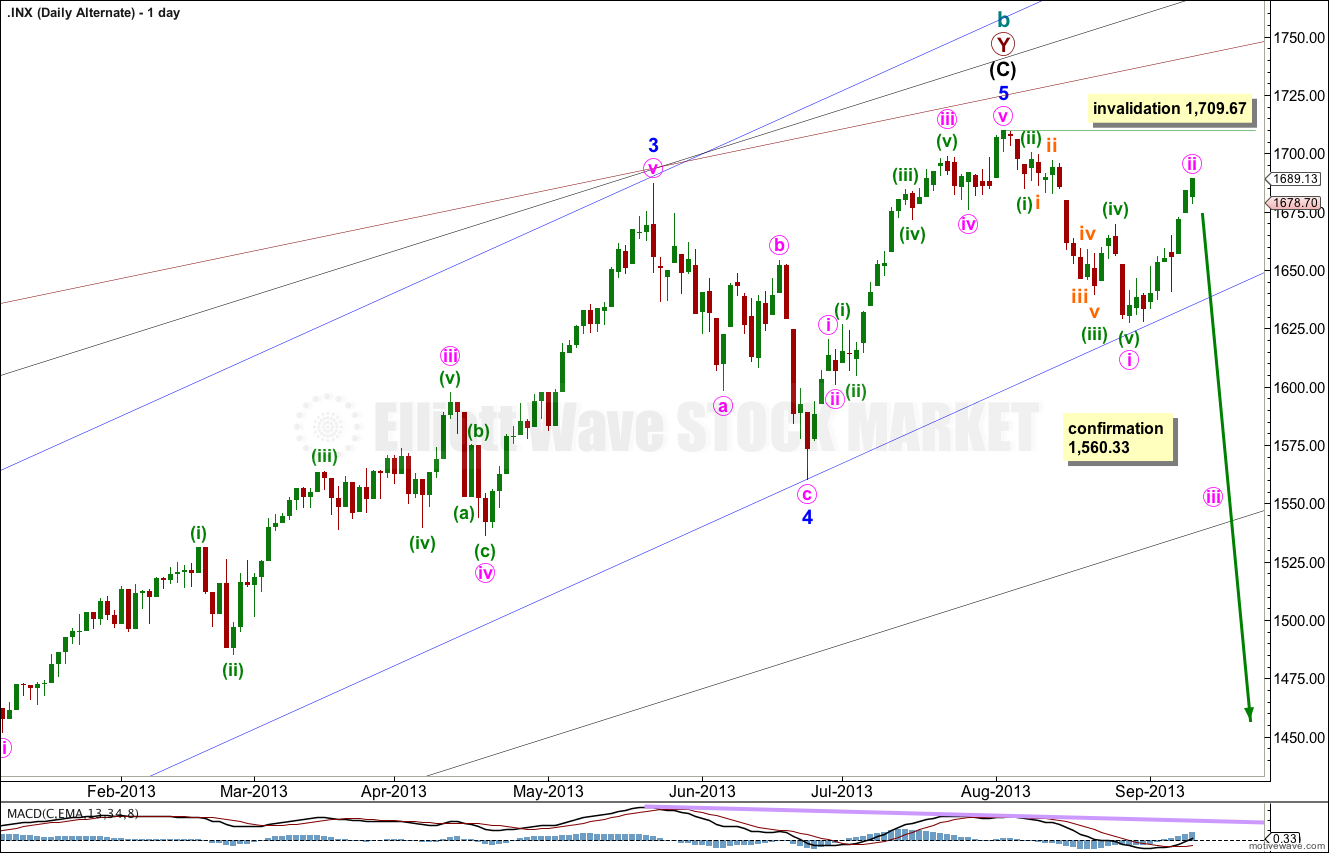
While price remains below 1,709.67 it will remain possible that we have recently seen a trend change at cycle degree. However, we should always assume the trend remains the same until proven otherwise.
This is a huge trend change. The new downwards trend should last from one to several years and take price substantially below 666.76. We need some confirmation before having confidence in this wave count.
We should assume the trend is upwards until this wave count is confirmed with movement below 1,560.33, and then with a breach of the black parallel channel on the daily chart.
This wave count is the same as the main wave count, except the degree of labeling in the final upwards wave of minor wave 5 is moved up one degree.
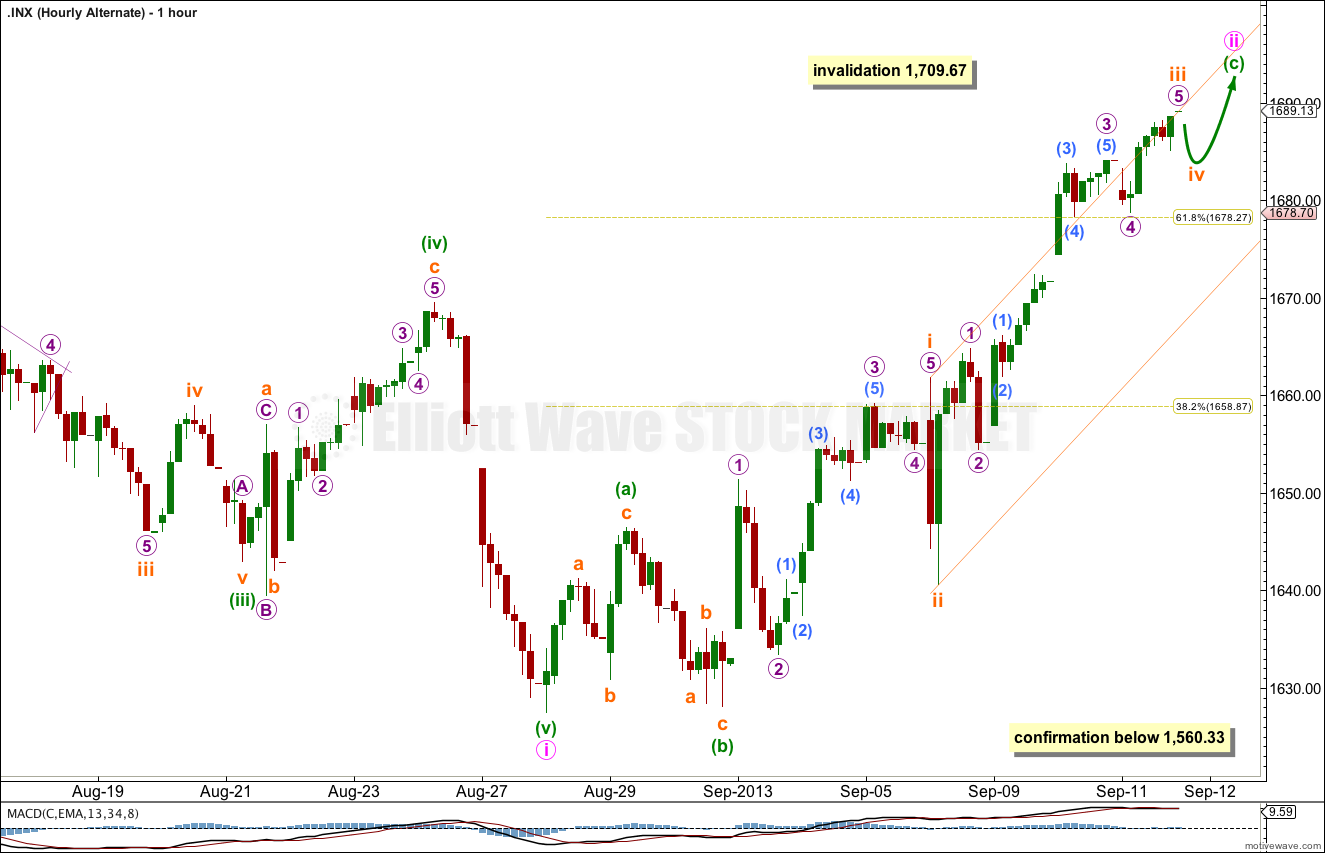
This alternate expects one brief fourth wave correction for subminuette wave iv before a final fifth wave upwards to complete the rather strange looking regular flat of minute wave ii.
Today, there is no divergence in the expectation of upwards movement tomorrow. Whether this upwards wave is an impulse (as per the main wave count) or a correction (as per this alternate) the structure is incomplete. It needs more upwards movement.
Minute wave ii may not move beyond the start of minute wave i. This wave count is invalidated with movement above 1,709.67.