
Last week I expected downwards movement from the FTSE. This is not what happened. Price moved higher and sideways, but remained comfortably below the invalidation points on the hourly and daily charts.
Click on the charts below to enlarge.
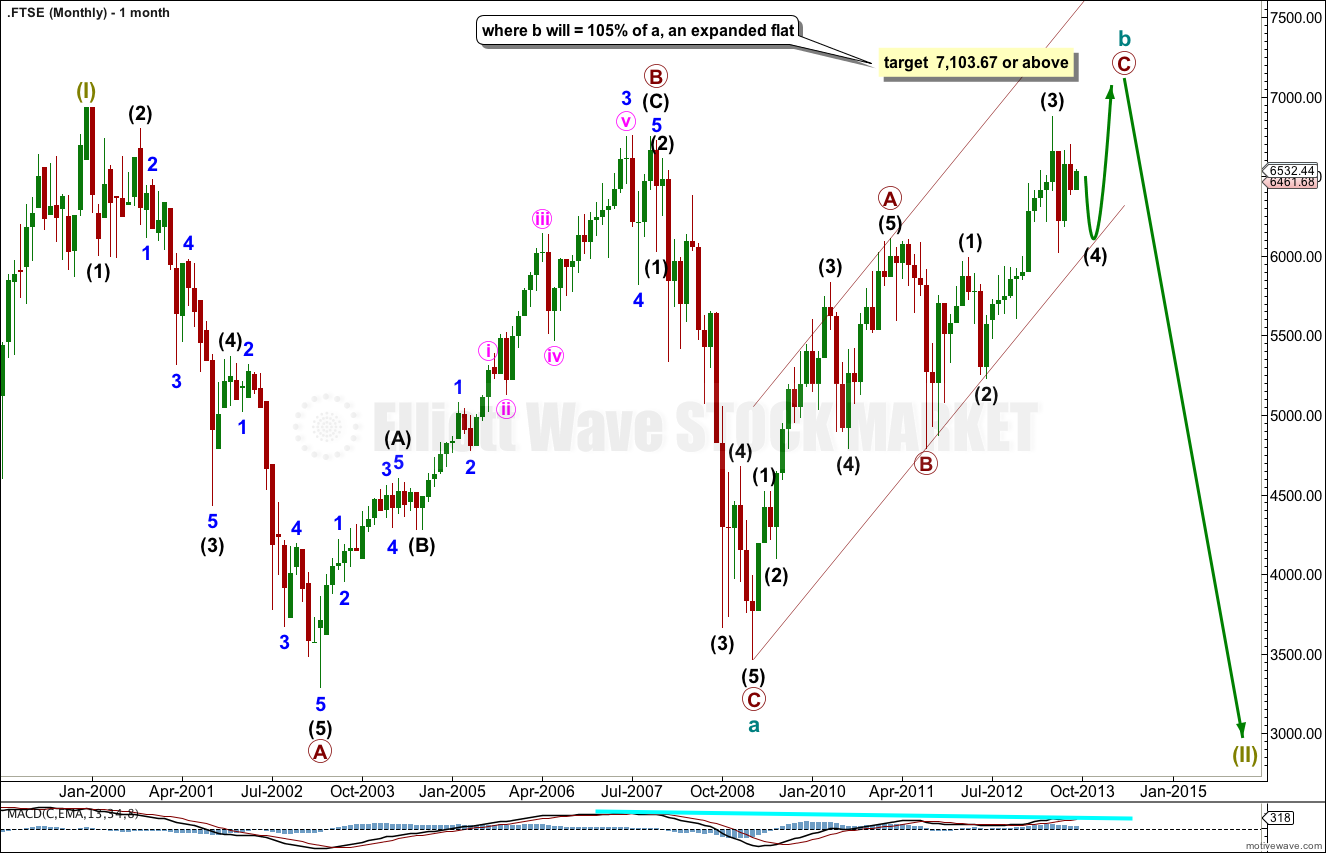
At super cycle degree this structure may be an expanded flat: cycle wave a subdivides into a three wave zigzag (with a slightly truncated C wave), and cycle wave b subdivides into a corrective structure and has passed the minimum of 90% the length of wave a.
The most common type of flat is an expanded flat. This requires cycle wave b to reach up to 105% the length of cycle wave a at 7,103.67 or above. The last upwards wave is likely to reach this point.
When primary wave C is a completed five wave structure we may expect a trend change at cycle wave degree.
If cycle wave b reaches 105% the length of cycle wave a at 7,103.67 or above then we may expect cycle wave c to move substantially below cycle wave a at 3,460.71.
If cycle wave b ends before 7,103.67 then we may expect cycle wave c to end just slightly below 3,460.71 as the structure at super cycle wave degree would then be a regular flat correction.
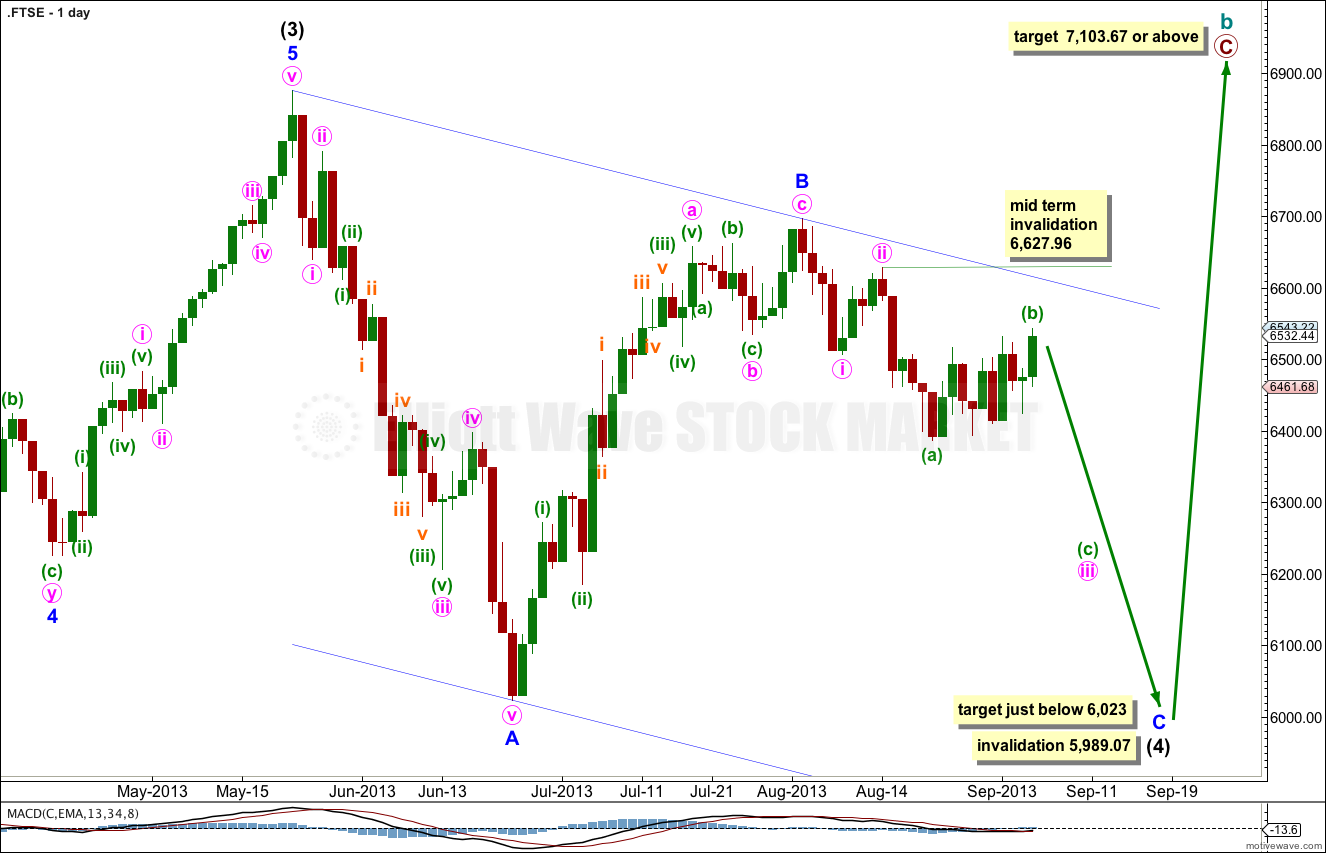
This daily chart focusses on intermediate wave (4) within primary wave C upwards.
Downwards movement labeled minor wave A is a completed five wave structure. It is very difficult to see this as a zigzag, so it is extremely unlikely that intermediate wave (4) is over here.
Upwards movement labeled minor wave B is a clear three wave structure. Minor wave B is now most likely over. Minor wave C downwards must unfold either as an impulse or an ending diagonal. Because the first wave downwards of minor wave C unfolds only as a zigzag on the hourly chart, it is most likely that minor wave C is unfolding as an ending expanding diagonal.
Within an ending diagonal all the subwaves must subdivide into zigzags, including the third wave. The fourth wave should overlap first wave price territory but may not move beyond the end of the second wave.
Within the diagonal minute waves i and ii are most likely complete. Minute wave iii is unfolding as a larger more exaggerated zigzag.
Within minute wave iii minuette wave (b) may not move beyond the start of minuette wave (a). This wave count is invalidated in the mid term with movement above 6,627.96.
We may expect minor wave C to most likely make a new low below the end of minor wave A at 6,023 to avoid a truncation. Intermediate wave (4) may not move into intermediate wave (1) price territory. This wave count is invalidated with movement below 5,989.07.
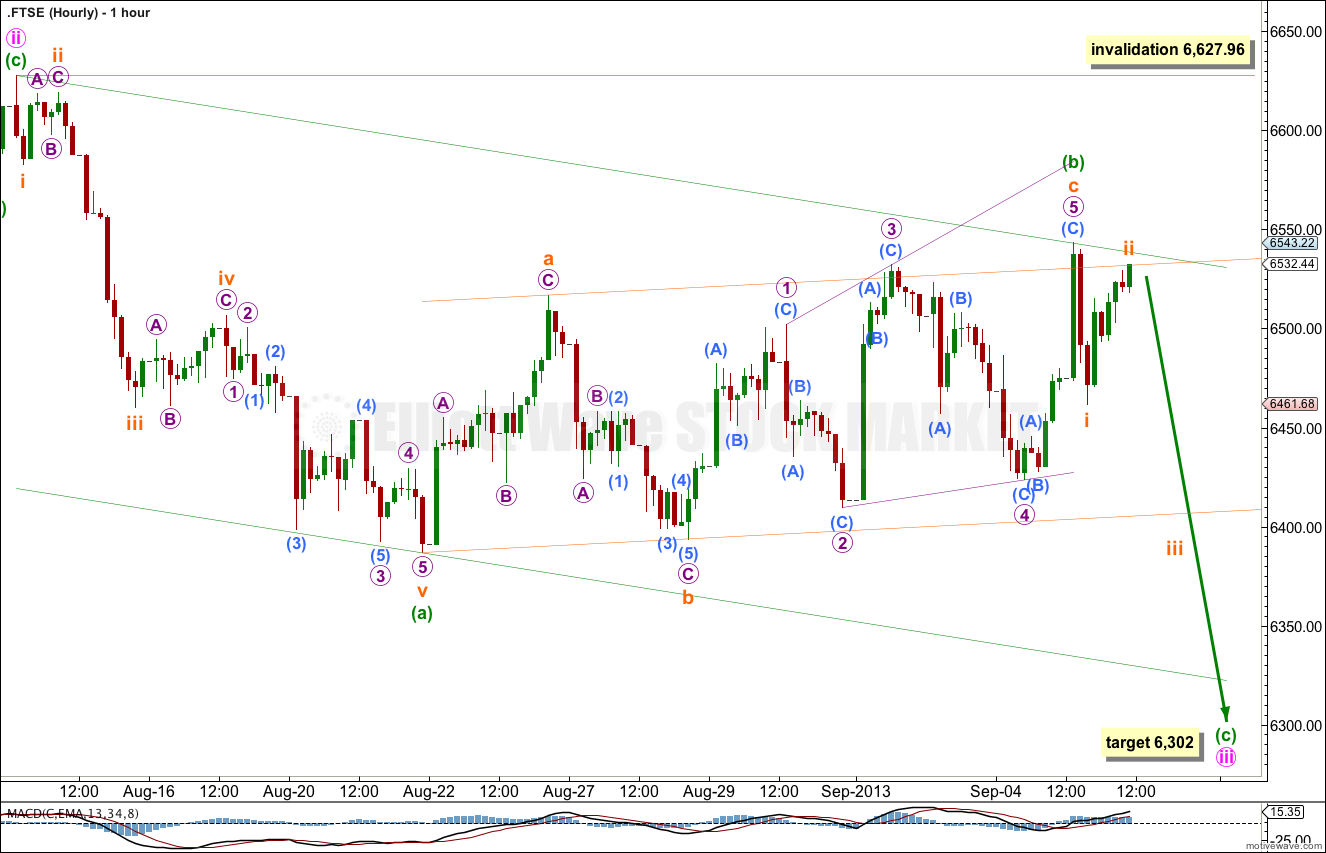
Last week’s analysis expected more downwards movement, which is not what happened. Upwards and sideways movement was a continuation of minuette wave (b) within the zigzag of minute wave iii. Price remained below the invalidation point.
Minuette wave (b) is now a 65% correction of minuette wave (a), just above the 0.618 Fibonacci ratio.
Minuette wave (c) must unfold as a five wave motive structure, either an impulse or an ending diagonal. At this stage it is too early to know which of these two structural possibilities it will be.
Minuette wave (c) would reach equality with minuette wave (a) at 6,302. This target may be met in about a week.
Draw a parallel channel about this zigzag from the start of minuette wave (a), to the end of minuette wave (b) with a parallel copy upon the end of minuette wave (a). Expect minuette wave (c) to end about the lower edge of the channel.
Minuette wave (b) may not move beyond the start of minuette wave (a). This wave count is invalidated with movement above 6,627.96.