
Last analysis main wave count expected a little downwards movement to begin the session which did not happen. Movement above 1,646.61 confirmed the trend change.
Click on the charts below to enlarge.
Main Wave Count.
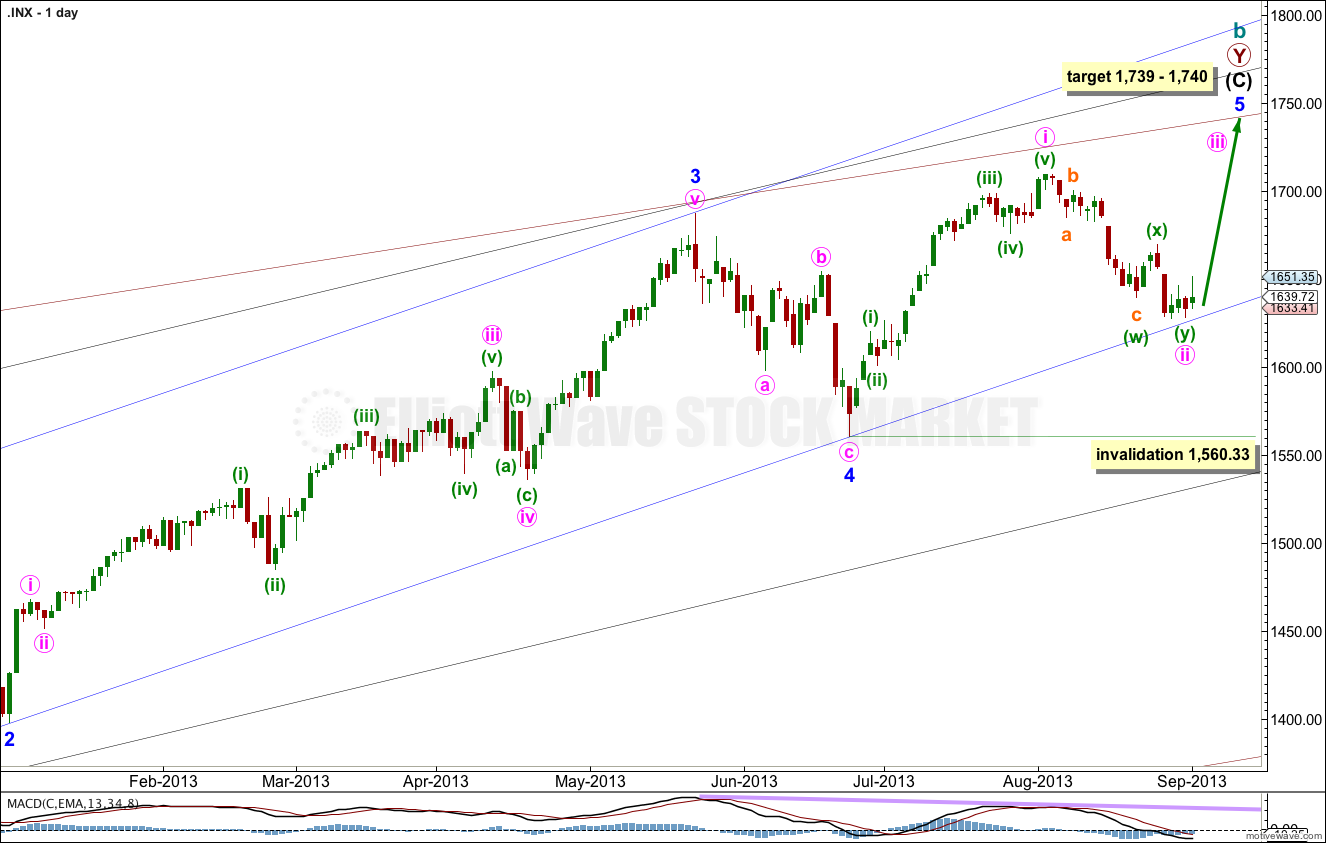
This wave count agrees with MACD and has some nice Fibonacci ratios in price and Fibonacci relationships in time.
Minor wave 3 is 15.1 points longer than 2.618 the length of minor wave 1.
Ratios within minor wave 3 are: there is no Fibonacci ratio between minute waves iii and i, and minute wave v is 5.44 points longer than equality with minute wave iii.
At 1,740 intermediate wave (C) would reach equality with intermediate wave (A). At 1,739 minor wave 5 would reach 0.618 the length of minor wave 3.
Within minor wave 5 minute wave ii may not move beyond the start of minute wave i. This wave count is invalidated with movement below 1,560.33.
Minor wave 1 lasted a Fibonacci 21 days, minor wave 2 lasted a Fibonacci 8 days, minor wave 3 has no Fibonacci duration at 98 days, and minor wave 4 lasted 22 days, just one day longer than a Fibonacci 21.
Minor wave 5 may not exhibit a Fibonacci time relationship. However, the next Fibonacci number in the sequence is 55 which could see minor wave 5 ending on 10th September (give or take a day or two either side). At this stage it does not look like the structure can complete in so little time.
Keep drawing the wider parallel channels from the monthly chart and copy them over to the daily chart.
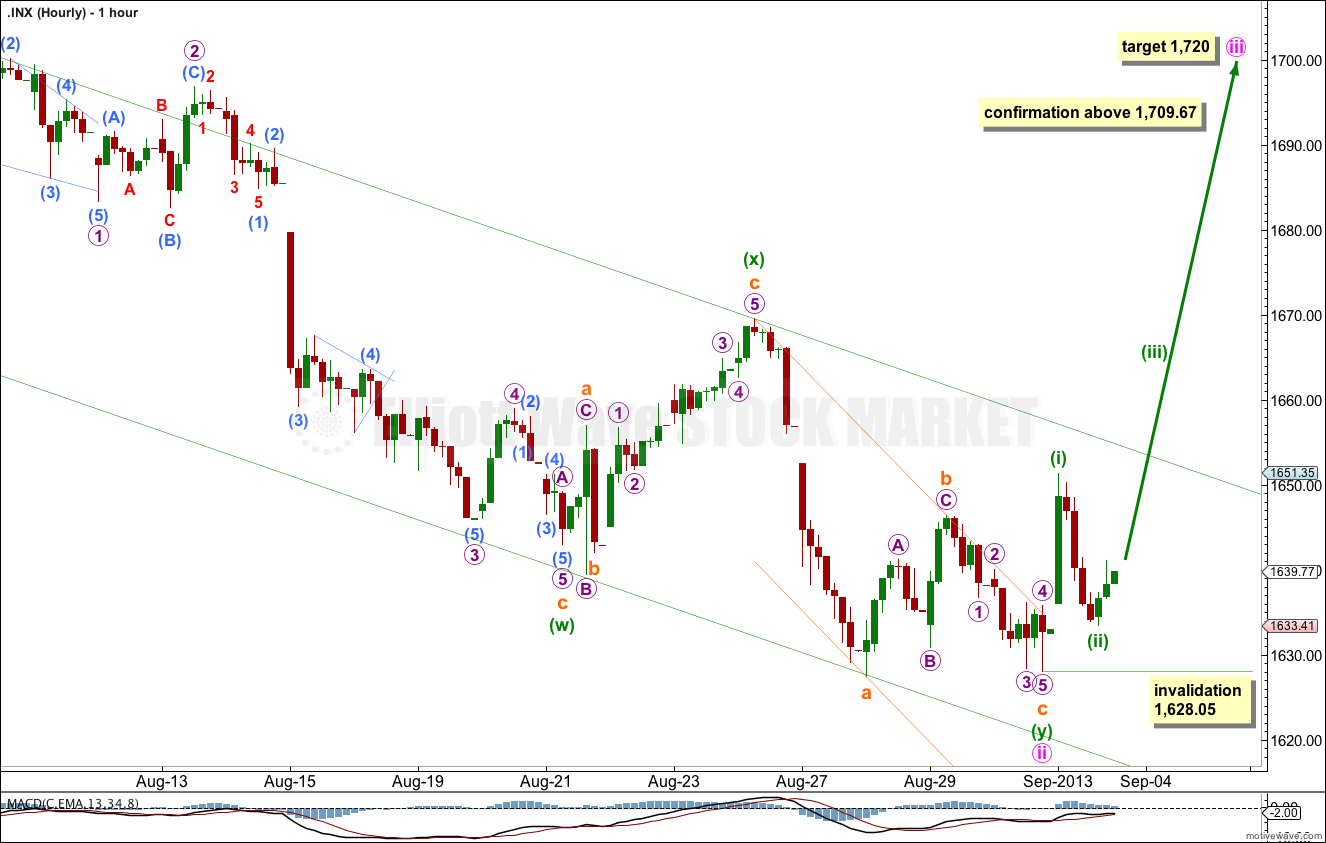
Minuette wave (y) may have ended with a slightly truncated subminuette wave c. There is no Fibonacci ratio between subminuette waves a and c within the zigzag of minuette wave (y).
On the five minute chart the upwards movement labeled minuette wave (i) of minute wave iii is a sheer rise, and is most likely an impulse. Downwards movement labeled minuette wave (ii) has a count of 19 on the five minute chart which is corrective, so far.
This main wave count expects an increase in upwards momentum this week as the middle of a third wave unfolds.
Movement above 1,709.67 would provide full confirmation of this main wave count.
At 1,720 minute wave iii would reach 0.618 the length of minute wave i.
Within minute wave iii minuette wave (ii) may not move beyond the start of minuette wave (i). This wave count is invalidated with movement below 1,628.05.
Alternate Wave Count.
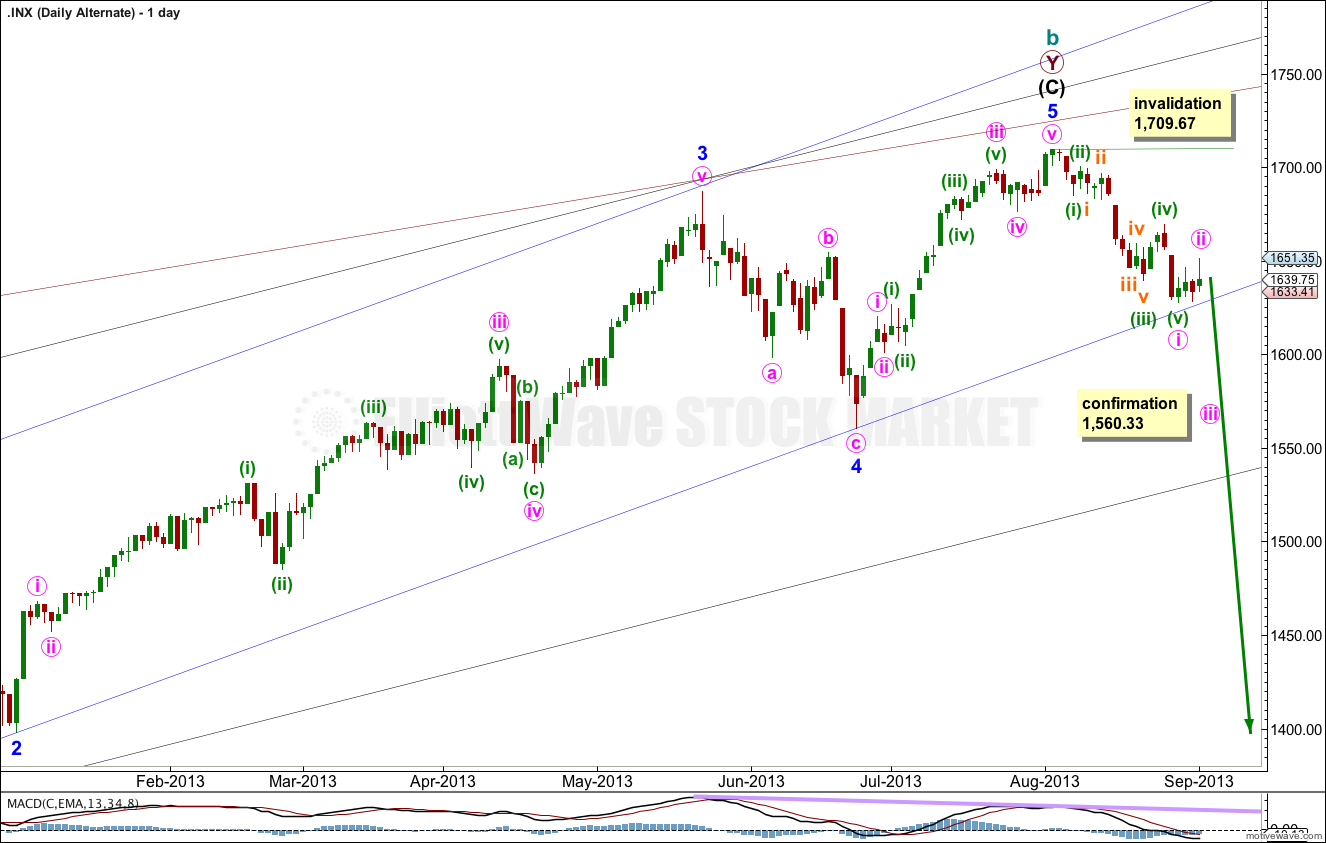
While price remains below 1,709.67 it will remain possible that we have recently seen a trend change at cycle degree. However, we should always assume the trend remains the same until proven otherwise.
This is a huge trend change. The new downwards trend should last from one to several years and take price substantially below 666.76. We need some confirmation before having confidence in this wave count.
We should assume the trend is upwards until this wave count is confirmed with movement below 1,560.33, and then with a breach of the black parallel channel on the daily chart.
This wave count is the same as the main wave count, except the degree of labeling in the final upwards wave of minor wave 5 is moved up one degree.
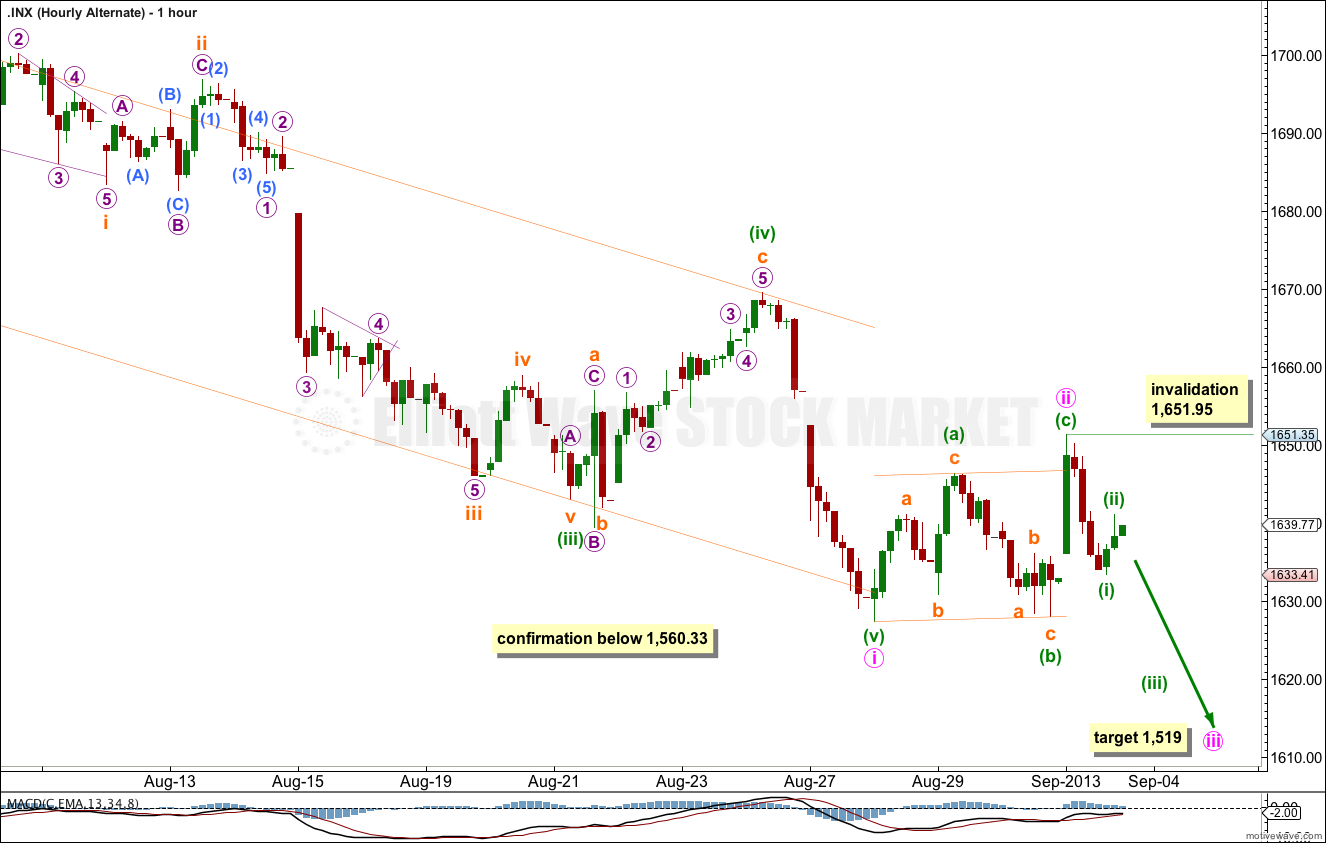
Minute wave ii may be over as a shallow regular flat correction. Alternatively, if we move the degree of labeling within minute wave ii down one degree, this may be just minuette wave (a) or (w) of a larger flat or a double flat or a double combination. I will not chart these other possibilities in the interests of keeping the number of charts to a manageable level. These alternate possibilities have reasonable probability, because if minute wave ii is over here it is very shallow and brief.
If minute wave iii has begun then at 1,519 it would reach 1.618 the length of minute wave i.
Within minute wave iii minuette wave (ii) may not move beyond the start of minuette wave (i). This wave count is invalidated with movement above 1,651.95.
If price does move above 1,651.95 then minute wave ii would be continuing further.