
Yesterday’s analysis expected some upwards movement to be followed by more downwards movement, for the main hourly wave count. We did get a little upwards movement.
Click on the charts below to enlarge.
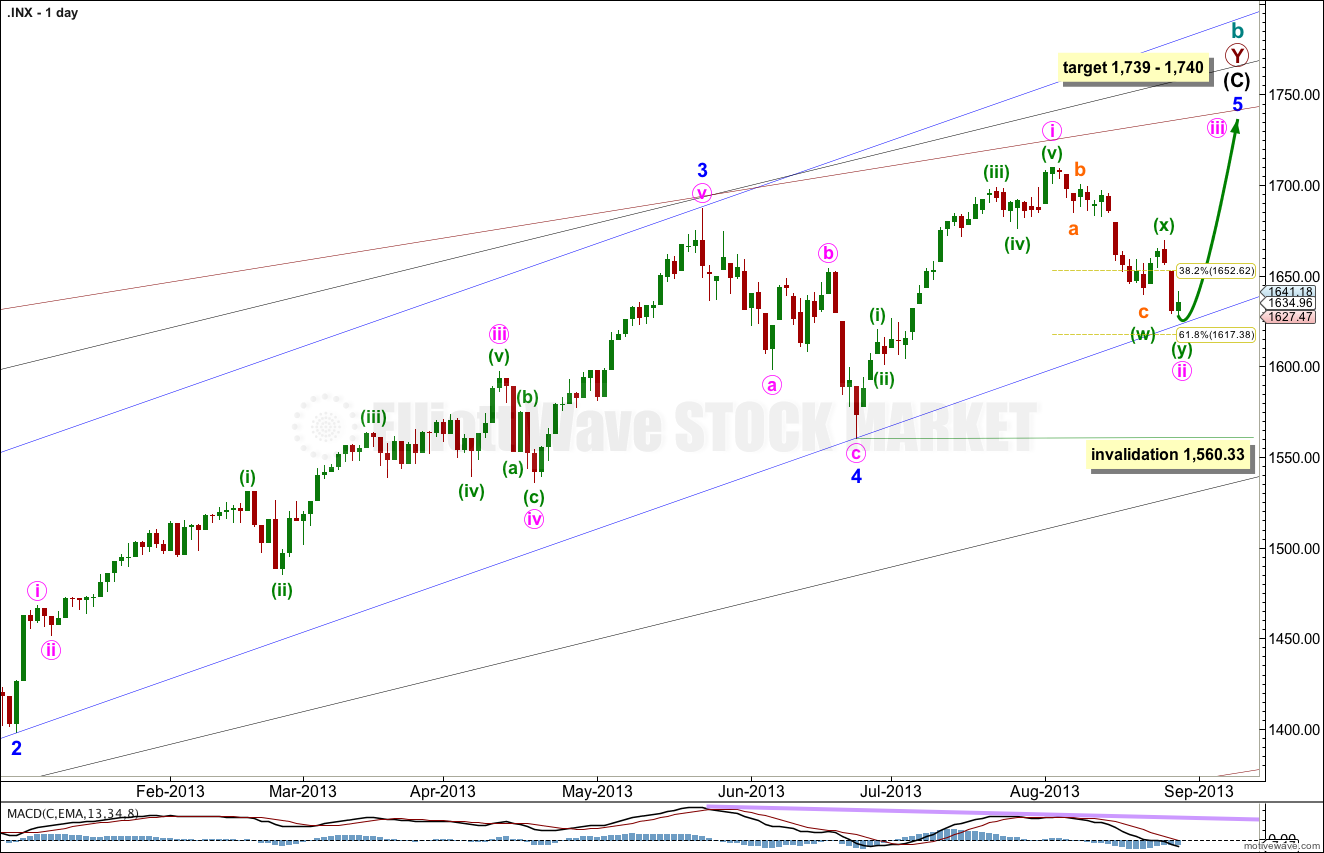
This wave count agrees with MACD and has some nice Fibonacci ratios in price and Fibonacci relationships in time.
Minor wave 3 is 15.1 points longer than 2.618 the length of minor wave 1.
Ratios within minor wave 3 are: there is no Fibonacci ratio between minute waves iii and i, and minute wave v is 5.44 points longer than equality with minute wave iii.
At 1,740 intermediate wave (C) would reach equality with intermediate wave (A). At 1,739 minor wave 5 would reach 0.618 the length of minor wave 3.
Within minor wave 5 minute wave ii may not move beyond the start of minute wave i. This wave count is invalidated with movement below 1,560.33.
Minor wave 1 lasted a Fibonacci 21 days, minor wave 2 lasted a Fibonacci 8 days, minor wave 3 has no Fibonacci duration at 98 days, and minor wave 4 lasted 22 days, just one day longer than a Fibonacci 21.
Minor wave 5 may not exhibit a Fibonacci time relationship. However, the next Fibonacci number in the sequence is 55 which could see minor wave 5 ending on 10th September (give or take a day or two either side). This may be the next possibility. At that time I will see if the structure could be considered complete, or not.
Keep drawing the wider parallel channels from the monthly chart and copy them over to the daily chart.
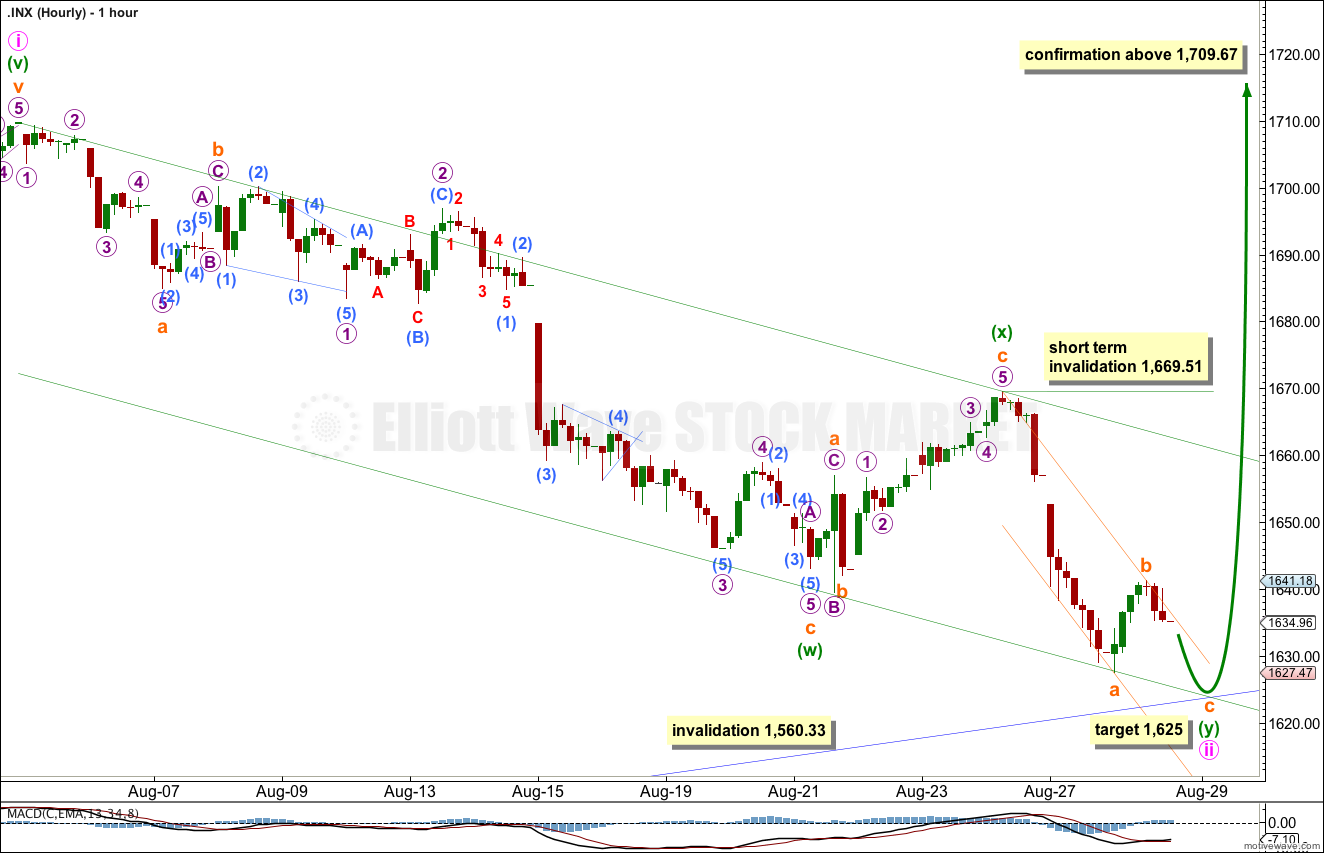
Upwards movement may have been subminuette wave b within the second zigzag in this double, labeled minuette wave (y). On the five and one minute chart this movement subdivides perfectly as a three wave zigzag.
It is likely that submiuette wave b is over here, but we may also move the degree of labeling down one degree and see this may have only been micro wave A within a flat, double or triangle for subminuette wave b. Either way, downwards movement for tomorrow would be most likely for all these structures.
If subminuette wave b is not over and moves higher then it may not move beyond the start of subminuette wave a at 1,669.51. When subminuette wave c is completed (a new low below 1,627.47) then this short term invalidation point no longer applies.
At 1,625 subminuette wave c would reach 0.382 the length of subminuette wave a, and price would come to touch the lower edge of the big blue channel drawn about intermediate wave (C) on the daily chart and copied over here. This trend line should provide support.
Minute wave ii may not move beyond the start of minute wave i. This wave count is invalidated with movement below 1,560.33.
Alternate Wave Count.
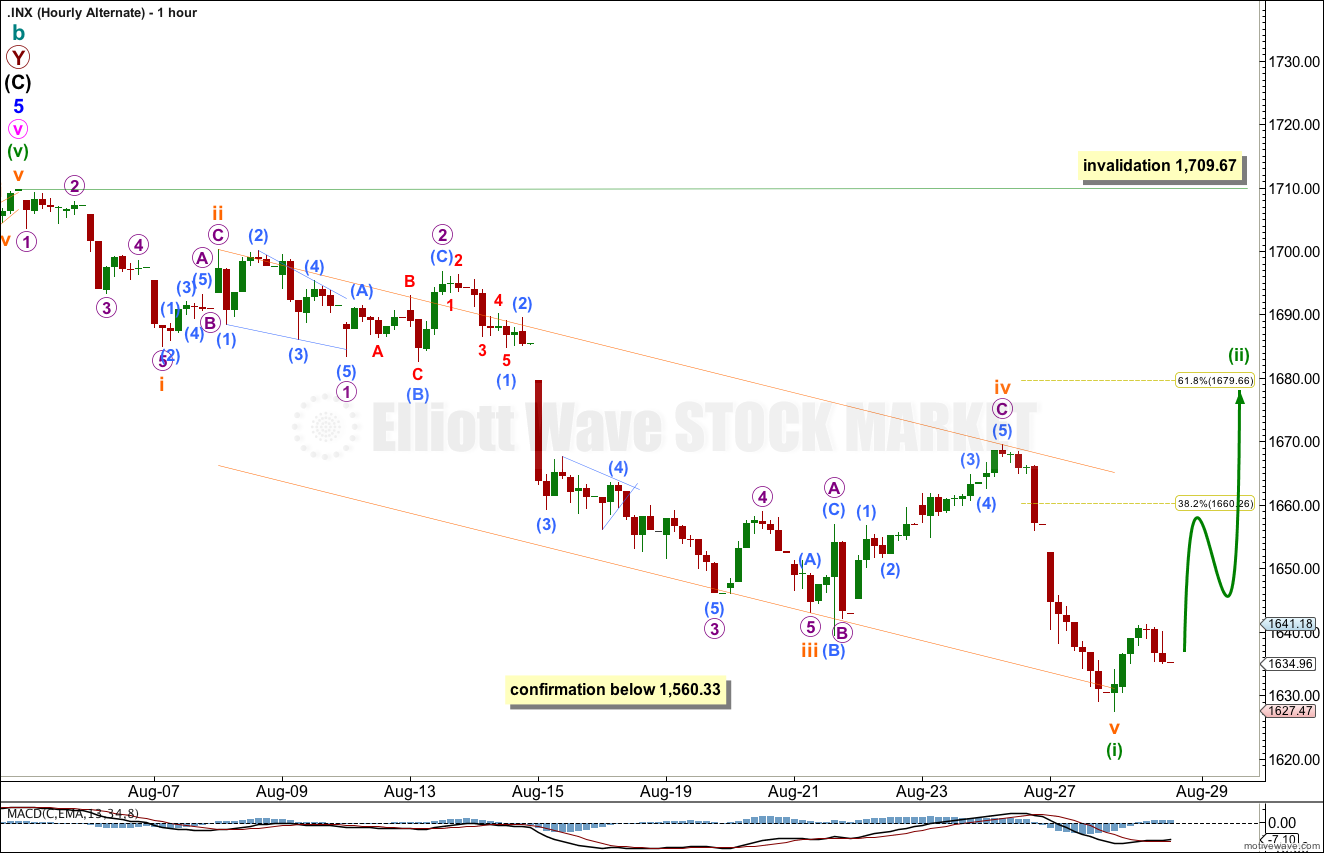
While price remains below 1,709.67 it will remain possible that we have recently seen a trend change at cycle degree. However, we should always assume the trend remains the same until proven otherwise.
This is a huge trend change. The new downwards trend should last from one to several years and take price substantially below 666.76. We need some confirmation before having confidence in this wave count.
We should assume the trend is upwards until this wave count is confirmed with movement below 1,560.33, and then with a breach of the black parallel channel on the daily chart.
This alternate hourly chart sees a five wave structure downwards now complete. This agrees nicely with MACD: subminuette wave iii has the strongest momentum, there is nice divergence between subminuette waves iii and v, and subminuette wave iv moved back to the zero line.
Minuette wave (ii) would be most likely to reach up to about the 0.618 Fibonacci ratio of minuette wave (i) at 1,679.66.
Minuette wave (ii) may not move beyond the start of minuette wave (i). This wave count is invalidated with movement above 1,709.67.