
Yesterday’s analysis expected more downwards movement overall for another two sessions. Price moved higher, but remains below the confirmation / invalidation point of the two wave counts.
Click on the charts below to enlarge.
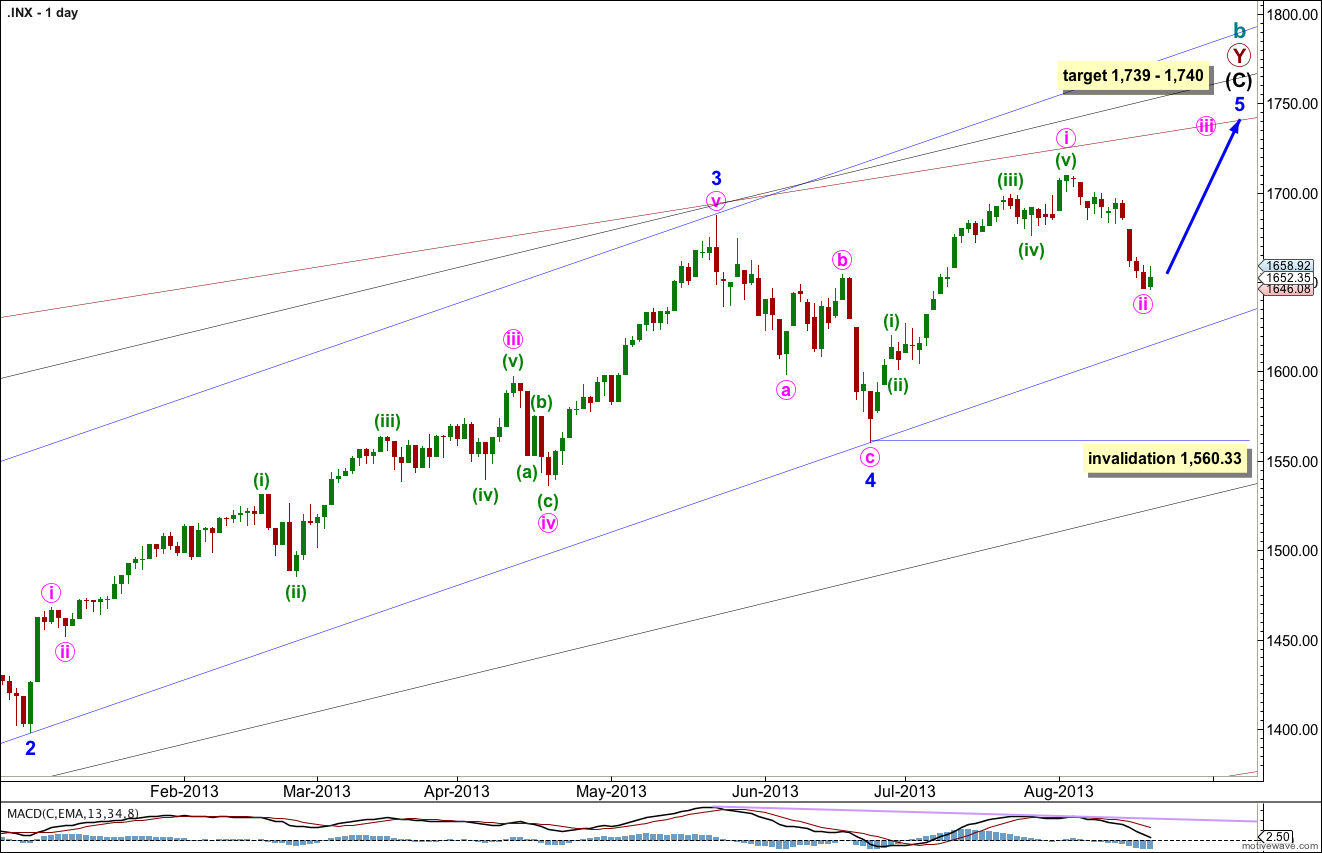
This wave count agrees with MACD and has some nice Fibonacci ratios in price and Fibonacci relationships in time.
Minor wave 3 is 15.1 points longer than 2.618 the length of minor wave 1.
Ratios within minor wave 3 are: there is no Fibonacci ratio between minute waves iii and i, and minute wave v is 5.44 points longer than equality with minute wave iii.
At 1,740 intermediate wave (C) would reach equality with intermediate wave (A). At 1,739 minor wave 5 would reach 0.618 the length of minor wave 3.
Within minor wave 5 minute wave ii may not move beyond the start of minute wave i. This wave count is invalidated with movement below 1,560.33.
Minor wave 1 lasted a Fibonacci 21 days, minor wave 2 lasted a Fibonacci 8 days, minor wave 3 has no Fibonacci duration at 98 days, and minor wave 4 lasted 22 days, just one day longer than a Fibonacci 21.
Minor wave 5 may not exhibit a Fibonacci time relationship. However, the next Fibonacci number in the sequence is 55 which could see minor wave 5 ending on 10th September (give or take a day or two either side). This may be the next possibility. At that time I will see if the structure could be considered complete, or not.
Keep drawing the wider parallel channels from the monthly chart and copy them over to the daily chart.
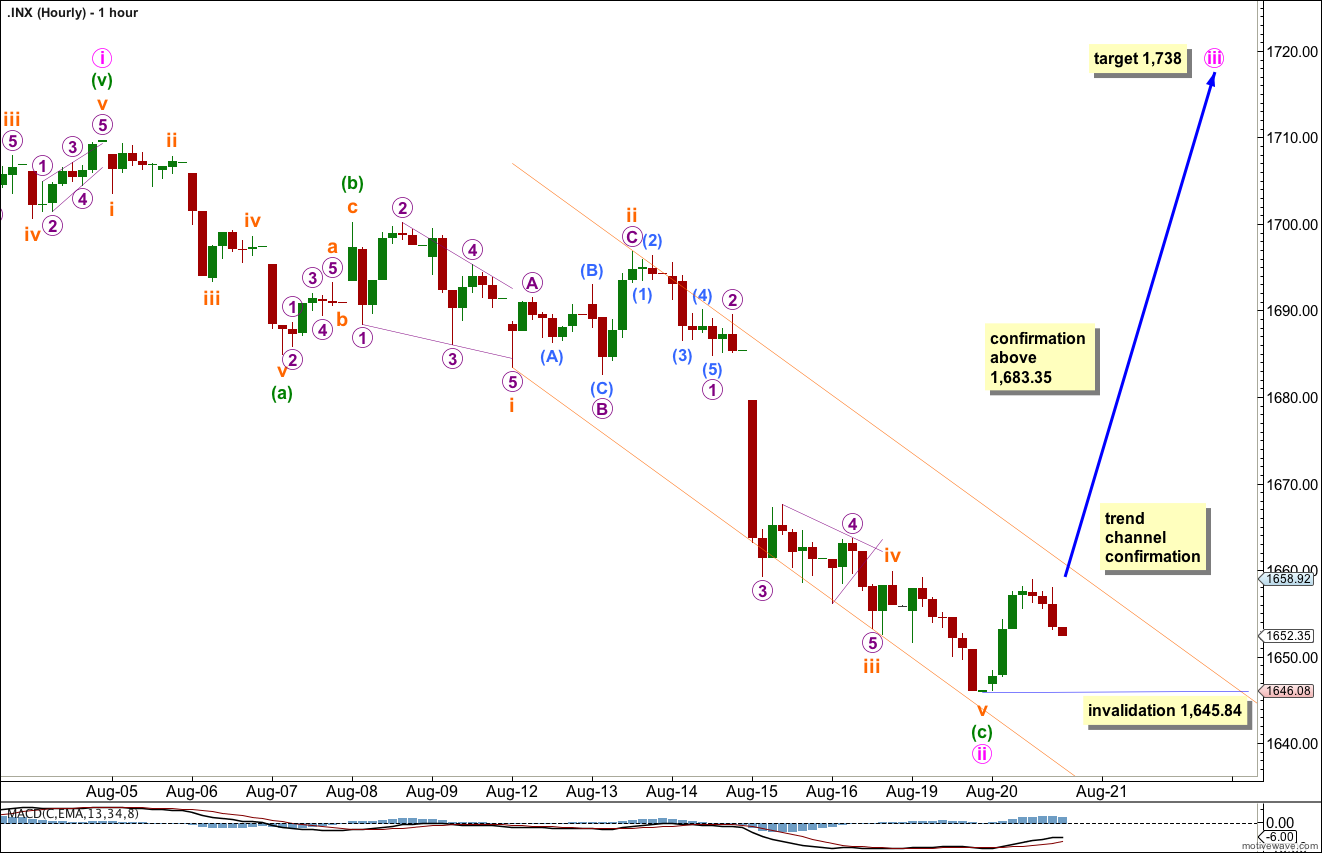
Minute wave ii may have been over two days earlier than expected as a shallow 42% zigzag.
There is no Fibonacci ratio between minuette waves (a) and (c) within the zigzag of minute wave ii.
Ratios within minuette wave (c) are: subminuette wave iii is just 0.46 points short of 2.618 the length of subminuette wave i, and subminuette wave v has no Fibonacci ratio to either of of subminuette waves i or iii.
On the five minute chart it is possible to see subminuette wave v as a completed five wave structure, although the proportions of the second and fourth wave corrections within it make it look more like a three than a five. Movement above its start confirms it must be over.
For this first hourly chart we would need to see movement above the parallel channel containing minuette wave (c) to confirm it is over, and then movement above 1,683.35 to provide price confirmation of a trend change. At that stage we may have some confidence in upwards targets. At 1,738 minute wave iii would reach 0.618 the length of minute wave i.
Within minute wave iii no second wave correction may move beyond the start of the first wave. This wave count is invalidated with movement below 1,645.84.
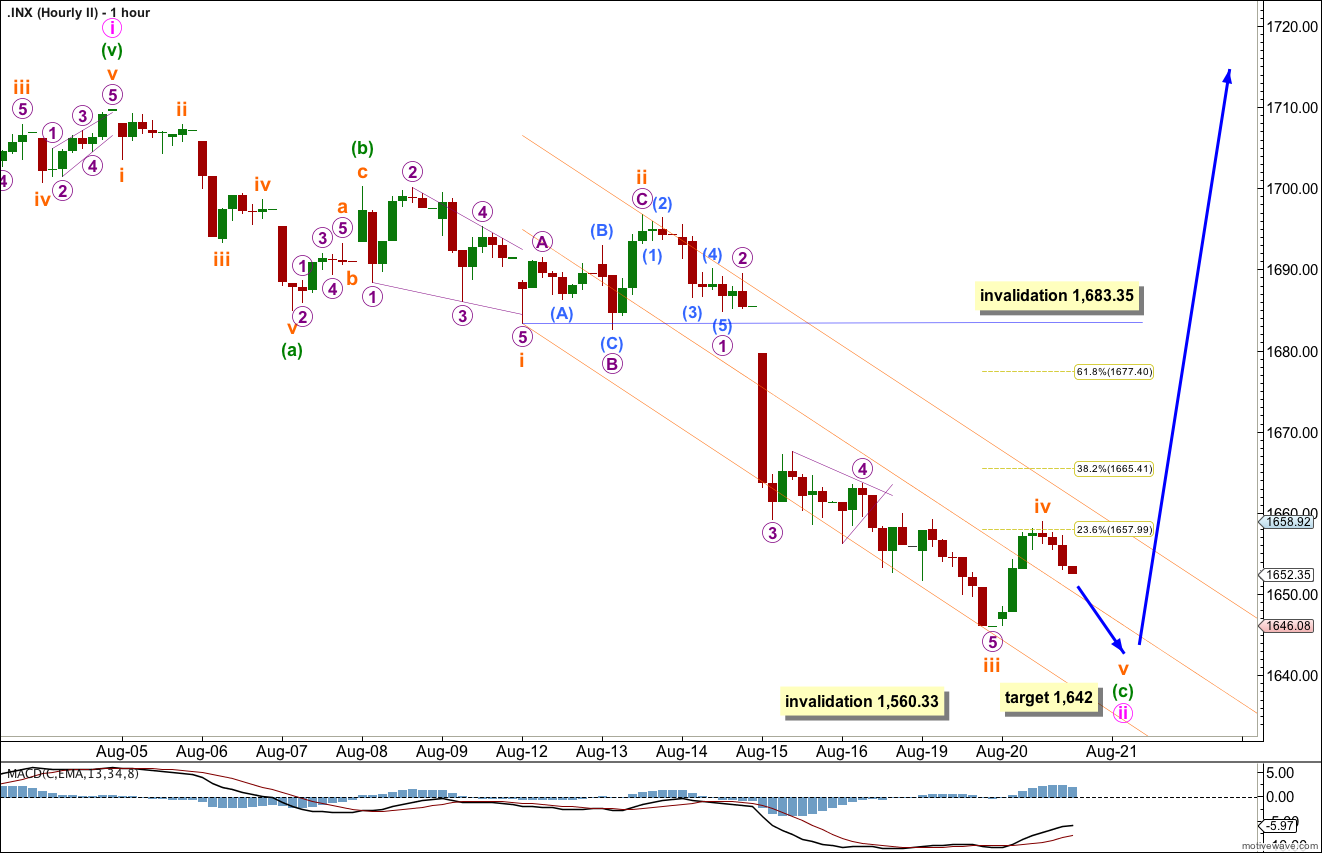
Upwards movement may have been the fourth wave correction I expected on one of the two prior days. On the five minute chart this movement can be seen as a completed zigzag which would provide nice alternation with subminuette wave ii expanded flat.
This wave count removes the close Fibonacci ratio between subminuette waves iii and i; there is now no Fibonacci ratio between these two waves. This makes it more likely we shall see a Fibonacci ratio with subminuette wave v and either of iii or i, with equality with subminuette wave i the most common relationship. This would be achieved at 1,642.
If subminuette wave iv moves higher it may not move into subminuette wave i price territory. This wave count is invalidated with movement above 1,683.35 (prior to subminuette wave v downwards being completed).
Once subminuette wave v completes the structure for minute wave ii zigzag at all degrees, the upper invalidation point no longer applies and we should expect a third wave upwards.
Alternate Wave Count.
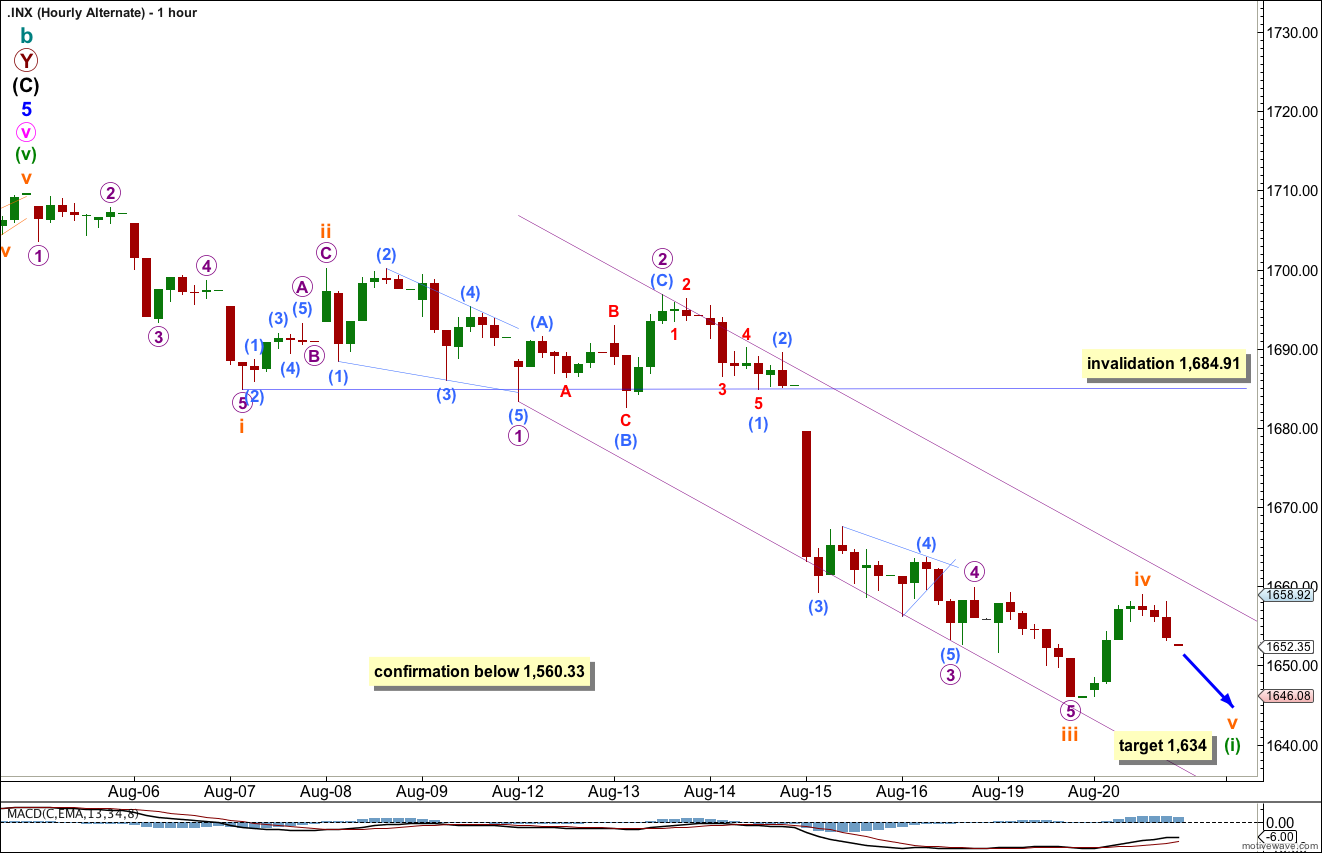
While price remains below 1,709.67 it will remain possible that we have recently seen a trend change at cycle degree. However, we should always assume the trend remains the same until proven otherwise.
We should assume the upwards trend remains valid until this wave count is confirmed with movement below 1,560.33, and then with a breach of the black parallel channel on the daily chart.
The recent increase in downwards momentum fits nicely with this wave count, but it is not enough to confirm it.
The subdivisions of this hourly wave count are the same as for the main wave count because A-B-C and 1-2-3 both subdivide in exactly the same way, 5-3-5.
At 1,634 subminuette wave v would reach equality with subminuette wave i. There is no Fibonacci ratio between subminuette waves i and iii.
When this downwards impulse for minuette wave (i) is completed, then this alternate wave count would expect upwards movement to be a second wave correction for minuette wave (ii). At that stage movement above 1,709.67 would invalidate this alternate wave count and confirm the main wave count.