
Last analysis had three hourly wave counts and the situation was unclear. Price moved lower, a little. All three wave counts remain valid.
Click on the charts below to enlarge.
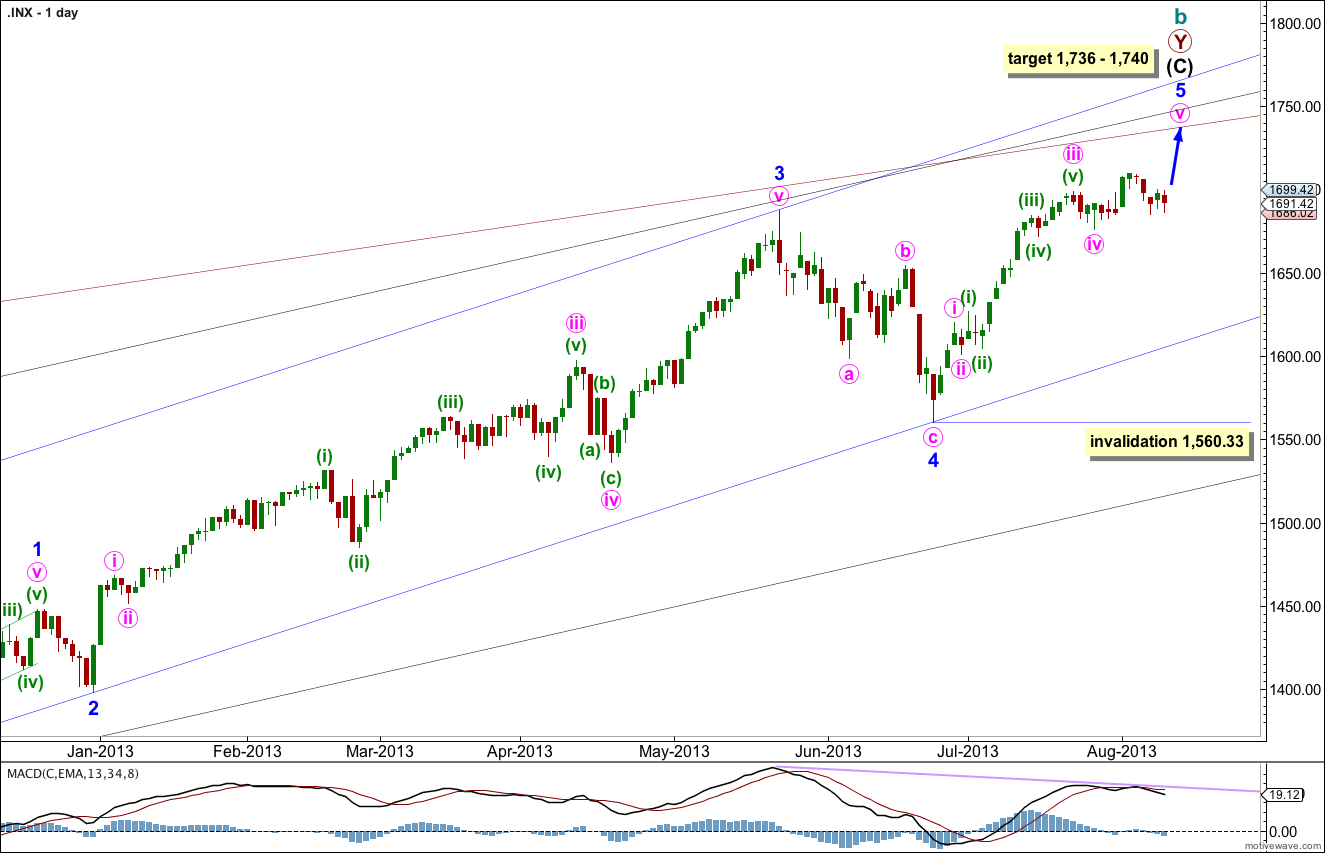
This wave count agrees with MACD and has some nice Fibonacci ratios in price and Fibonacci relationships in time.
Minor wave 3 is 15.1 points longer than 2.618 the length of minor wave 1.
Ratios within minor wave 3 are: there is no Fibonacci ratio between minute waves iii and i, and minute wave v is 5.44 points longer than equality with minute wave iii.
At 1,740 intermediate wave (C) would reach equality with intermediate wave (A). At 1,739 minor wave 5 would reach 0.618 the length of minor wave 3. At 1,736 minute wave v would reach 0.618 the length of minute wave iii.
Within minor wave 5 no second wave correction may move beyond the start of the first wave. This wave count is invalidated with movement below 1,560.33.
Minor wave 1 lasted a Fibonacci 21 days, minor wave 2 lasted a Fibonacci 8 days, minor wave 3 has no Fibonacci duration at 98 days, and minor wave 4 lasted 22 days, just one day longer than a Fibonacci 21.
At this stage it looks like minor wave 5 may not exhibit a Fibonacci time relationship.
Keep drawing the wider parallel channels from the monthly chart and copy them over to the daily chart.
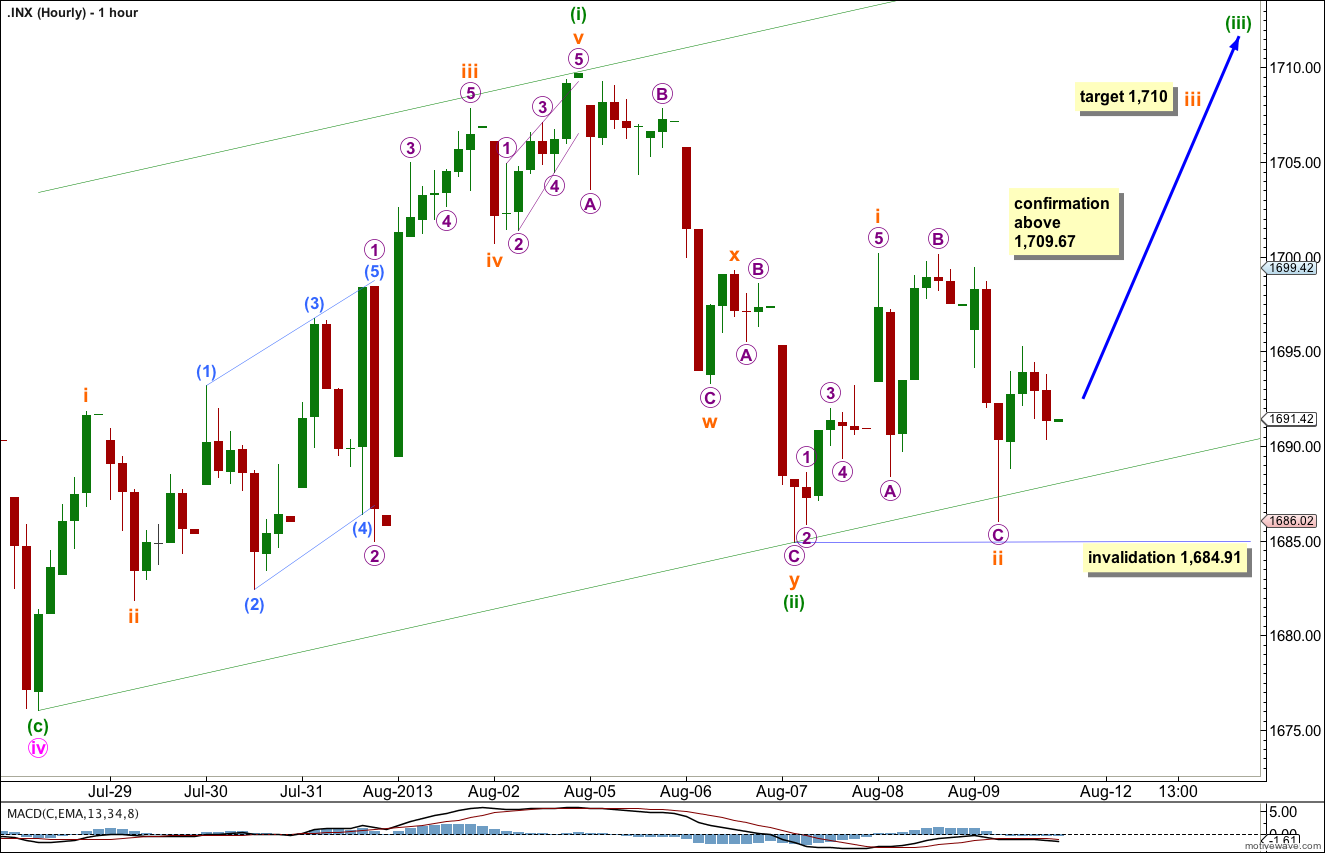
Friday’s downwards movement may have been a continuation of subminuette wave ii within minuette wave (iii). We need price to move above 1,709.67 to confirm this wave count.
At 1,710 subminuette wave iii would reach 1.618 the length of subminuette wave i.
This wave count is an okay fit, and overall for the main wave count it has the best look. But for the upwards movement labeled here subminuette wave i the next chart below has a better fit.
If subminuette wave ii moves any lower it may not move beyond the start of subminuette wave i. This wave count is invalidated with movement below 1,684.91.
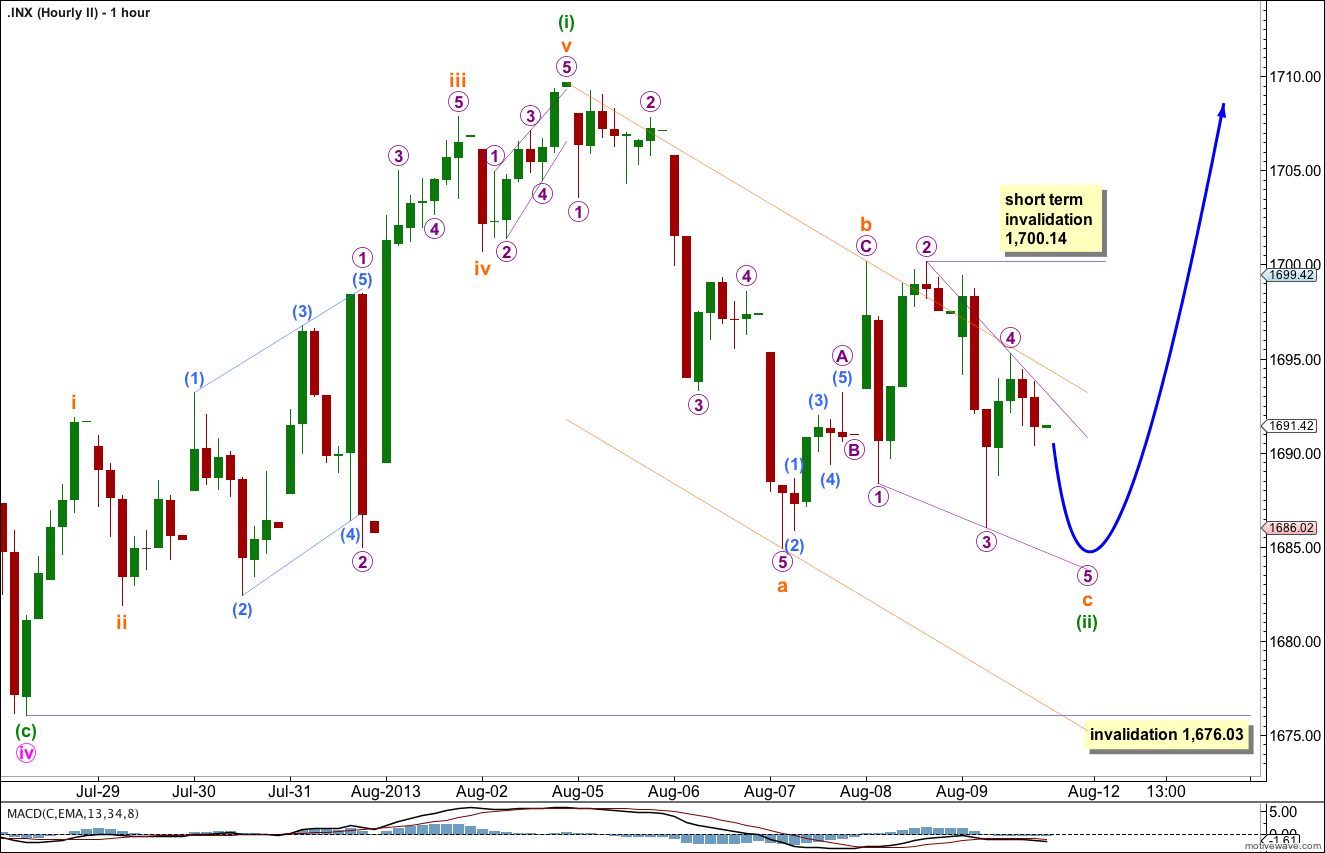
It is still possible that minuette wave (ii) is incomplete. Within minuette wave (ii) subminuette wave a is a complete five wave impulse, subminuette wave b is a zigzag and subminuette wave c may be completing as an ending contracting diagonal.
I would expect micro wave 5 of the diagonal to find support at the 1-3 trend line and end there.
This wave count does not have as nice a fit for the downwards movement labeled subminuette wave a. This fits better as a double zigzag. As an impulse there is no alternation between micro waves 2 and 4 within it.
Minuette wave (ii) may not move beyond the start of minuette wave (i). This wave count is invalidated with movement below 1,676.03.
Alternate Wave Count.
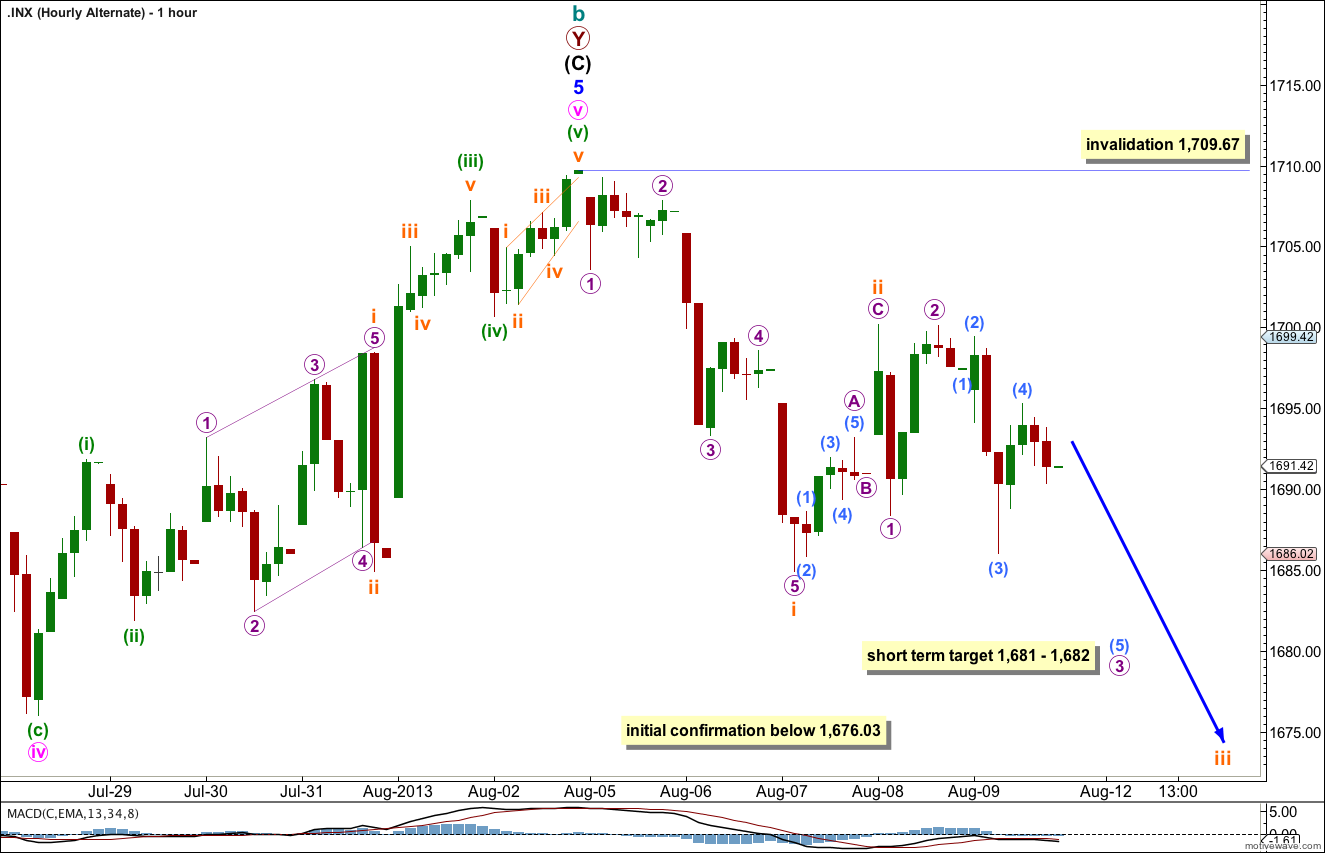
While price remains below 1,709.67 it will remain possible that we have recently seen a trend change at cycle degree. However, we should always assume the trend remains the same until proven otherwise.
We should assume the upwards trend remains valid until this wave count is confirmed with movement below 1,560.33, and then with a breach of the black parallel channel on the daily chart.
If we have seen a trend change then we should see some increase in downwards momentum next week.
Movement below 1,676.03 would provide initial indication that this wave count may be correct.
At 1,681 micro wave 3 would reach 1.618 the length of micro wave 1. At 1,682 submicro wave (5) would reach equality in length with submicro wave (3).
Subminuette wave ii may not move beyond the start of subminuette wave i. This wave count is invalidated with movement above 1,709.67.