
As expected, upwards movement at the beginning of Tuesday’s session took price into the short term target zone of 1,698 to 1,702 before price turned downwards for the day.
Click on the charts below to enlarge.
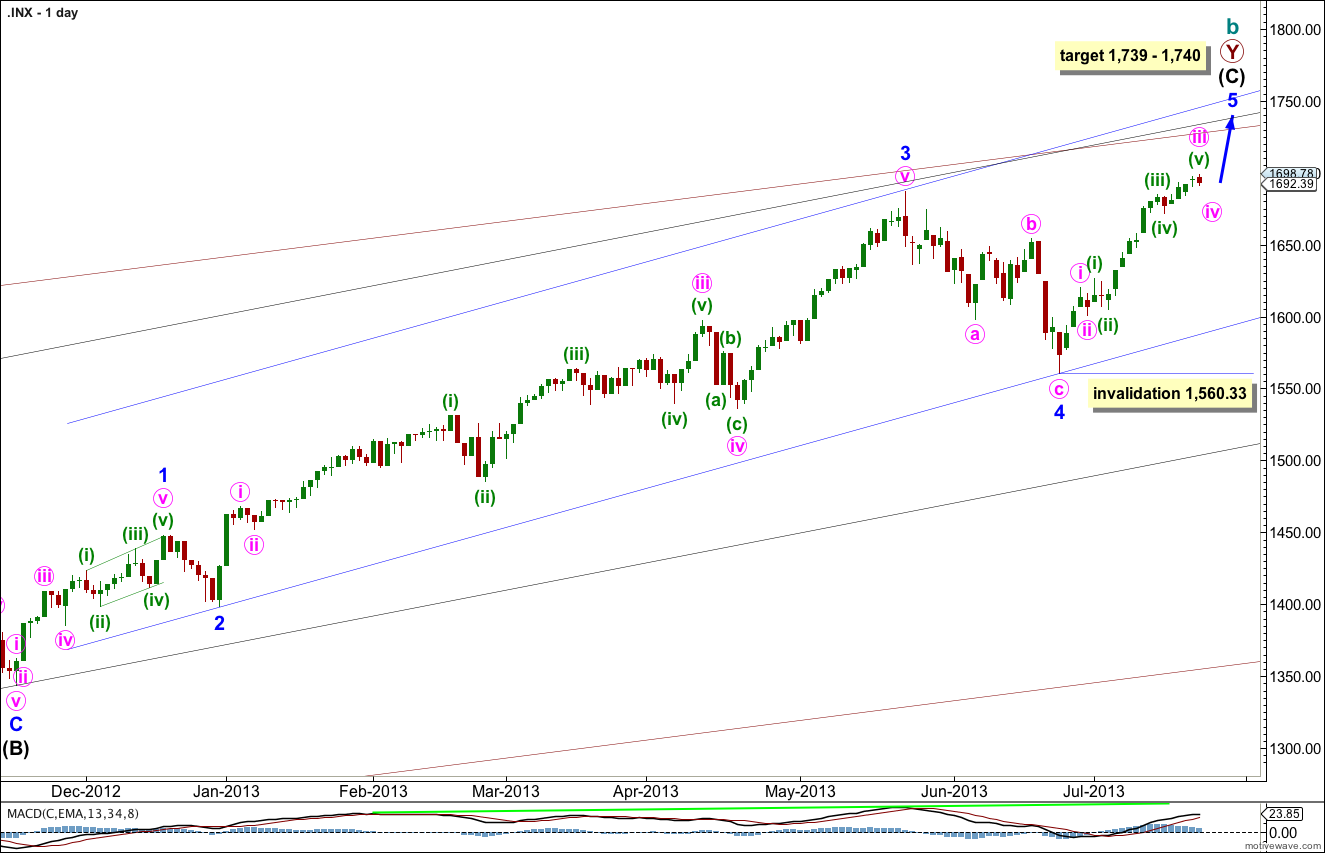
This wave count agrees with MACD and has some nice Fibonacci ratios in price and Fibonacci relationships in time.
Minor wave 3 is 15.1 points longer than 2.618 the length of minor wave 1.
Ratios within minor wave 3 are: there is no Fibonacci ratio between minute waves iii and i, and minute wave v is 5.44 points longer than equality with minute wave iii.
At 1,740 intermediate wave (C) would reach equality with intermediate wave (A). At 1,739 minor wave 5 would reach 0.618 the length of minor wave 3.
Within minor wave 5 no second wave correction may move beyond the start of the first wave. This wave count is invalidated with movement below 1,560.33.
Minor wave 1 lasted a Fibonacci 21 days, minor wave 2 lasted a Fibonacci 8 days, minor wave 3 has no Fibonacci duration at 98 days, and minor wave 4 lasted 22 days, just one day longer than a Fibonacci 21.
At this stage minor wave 5 has lasted 20 sessions. In another one session it would have lasted a Fibonacci 21. It is unlikely to be over there. A further 13 sessions beyond that would see it ending in a Fibonacci 34. At each of these dates I will look to see if the structure could be considered complete. If it can we shall have an alternate wave count to consider the possibility again of a trend change at cycle degree.
Keep drawing the wider parallel channels from the monthly chart and copy them over to the daily chart.
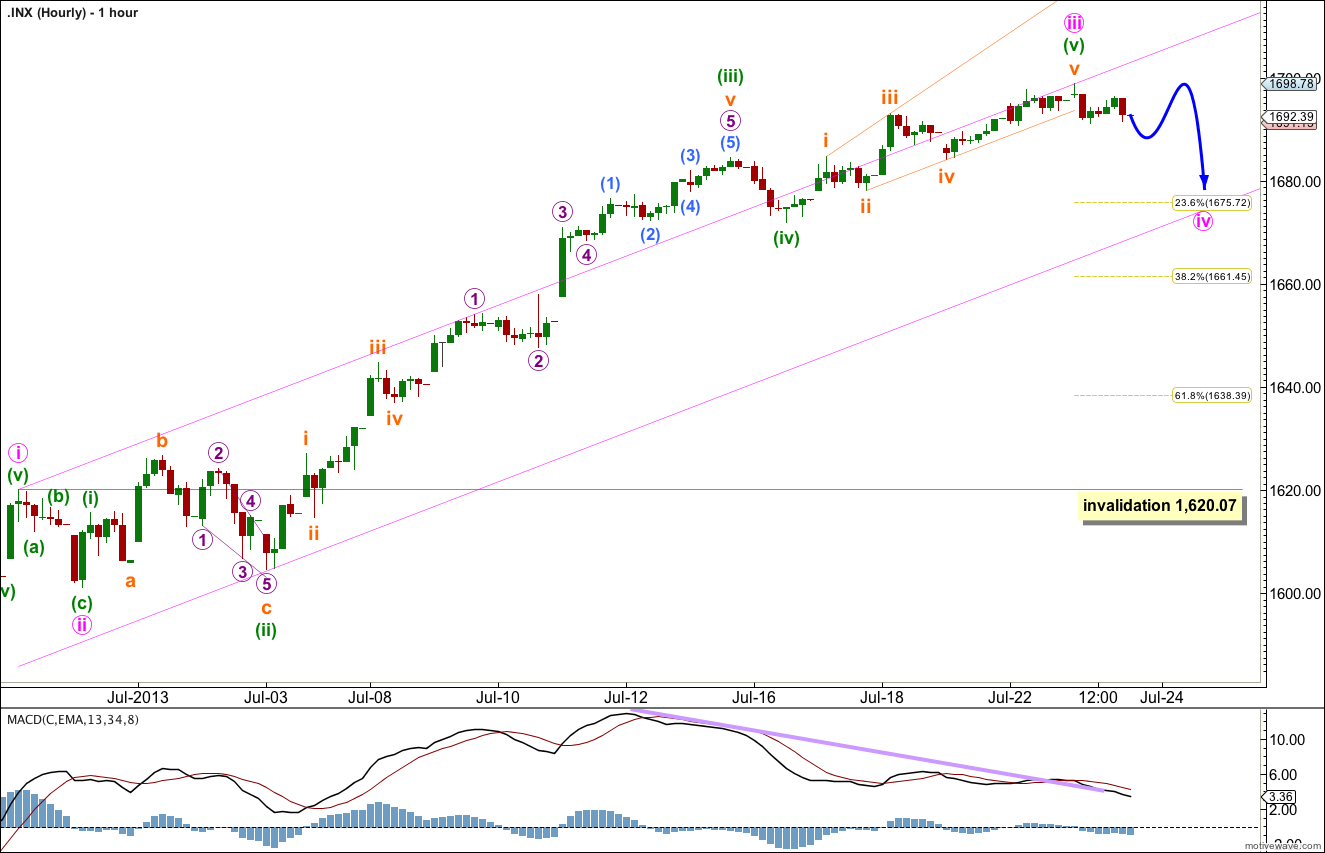
Minute wave iii is probably now completed. Minute wave iii is just 1.06 points short of 1.618 the length of minute wave i.
Within minute wave iii there are no adequate Fibonacci ratios between minuette waves (i), (iii) and (v).
Minute wave ii was a shallow 32% zigzag correction of minute wave i. We may expect minute wave iv to show alternation in depth and / or structure. Minute wave iv is most likely to be a flat, triangle or combination. If it is very shallow, about the 0.236 Fibonacci ratio of minute wave iii, it may have some alternation in terms of depth with minute wave ii. Alternatively, it could be a very deep correction ending about the 0.618 Fibonacci ratio at 1,638.39.
Minute wave ii lasted just one session. If minute wave iv is a more time consuming structure (particularly if it is a triangle or combination) it should be longer in duration, about three sessions.
I have redrawn the channel slightly today. The first trend line is drawn from the highs of minute waves i to iii, then a parallel copy is placed upon the low of minuette wave (ii) within minute wave iii. The lower edge of this channel may provide some support.
Minute wave iv may not move into minute wave i price territory. This wave count is invalidated with movement below 1,620.07.