
Price has moved higher as expected for Monday’s session with a lack of momentum which was also expected. Price is now just 0.39 points short of the short term target zone on the hourly chart.
Click on the charts below to enlarge.
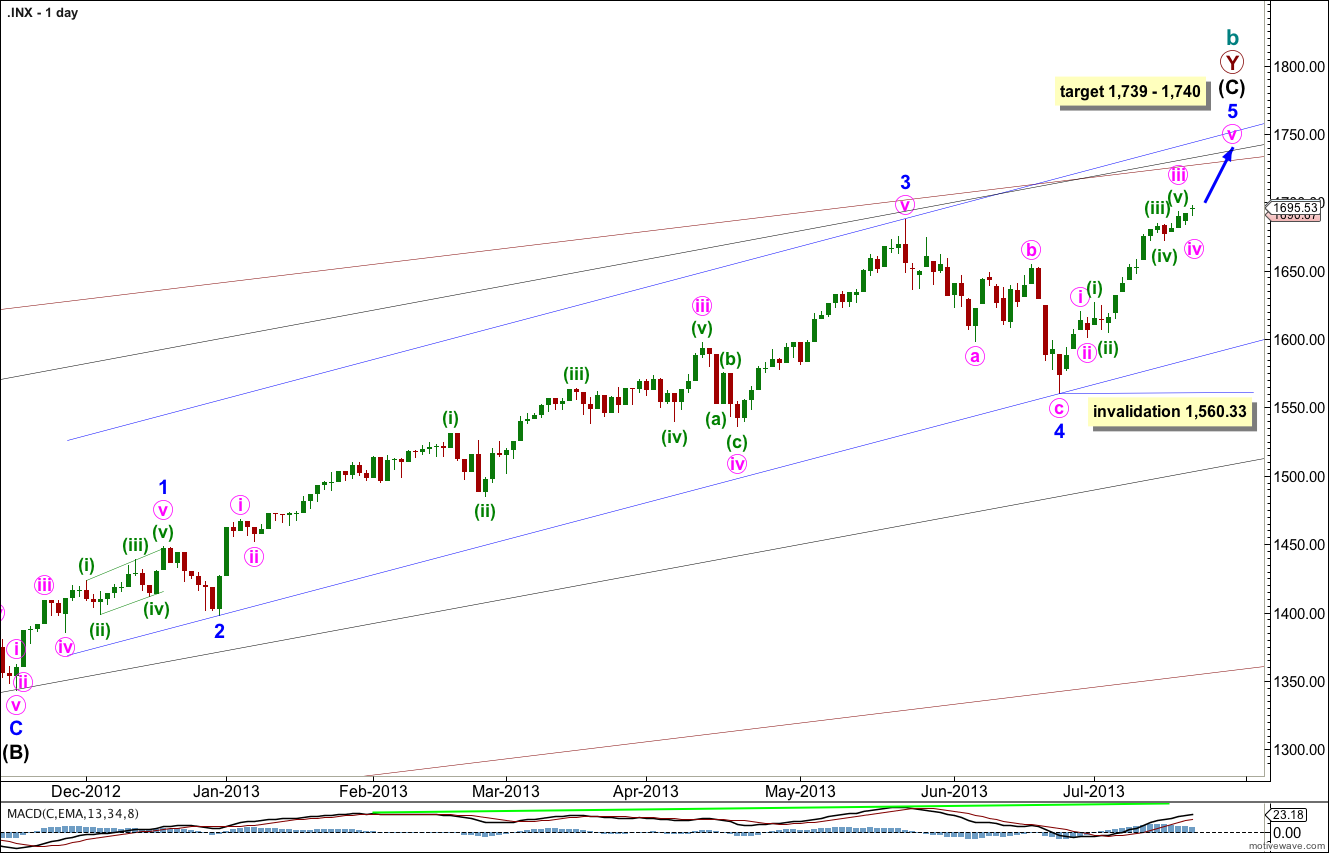
This wave count agrees with MACD and has some nice Fibonacci ratios in price and Fibonacci relationships in time.
Minor wave 3 is 15.1 points longer than 2.618 the length of minor wave 1.
Ratios within minor wave 3 are: there is no Fibonacci ratio between minute waves iii and i, and minute wave v is 5.44 points longer than equality with minute wave iii.
At 1,740 intermediate wave (C) would reach equality with intermediate wave (A). At 1,739 minor wave 5 would reach 0.618 the length of minor wave 3.
Within minor wave 5 no second wave correction may move beyond the start of the first wave. This wave count is invalidated with movement below 1,560.33.
Minor wave 1 lasted a Fibonacci 21 days, minor wave 2 lasted a Fibonacci 8 days, minor wave 3 has no Fibonacci duration at 98 days, and minor wave 4 lasted 22 days, just one day longer than a Fibonacci 21.
At this stage minor wave 5 has lasted 19 sessions. In another two sessions it would have lasted a Fibonacci 21. A further 13 sessions beyond that would see it ending in a Fibonacci 34. At each of these dates I will look to see if the structure could be considered complete. If it can we shall have an alternate wave count to consider the possibility again of a trend change at cycle degree.
Keep drawing the wider parallel channels from the monthly chart and copy them over to the daily chart.
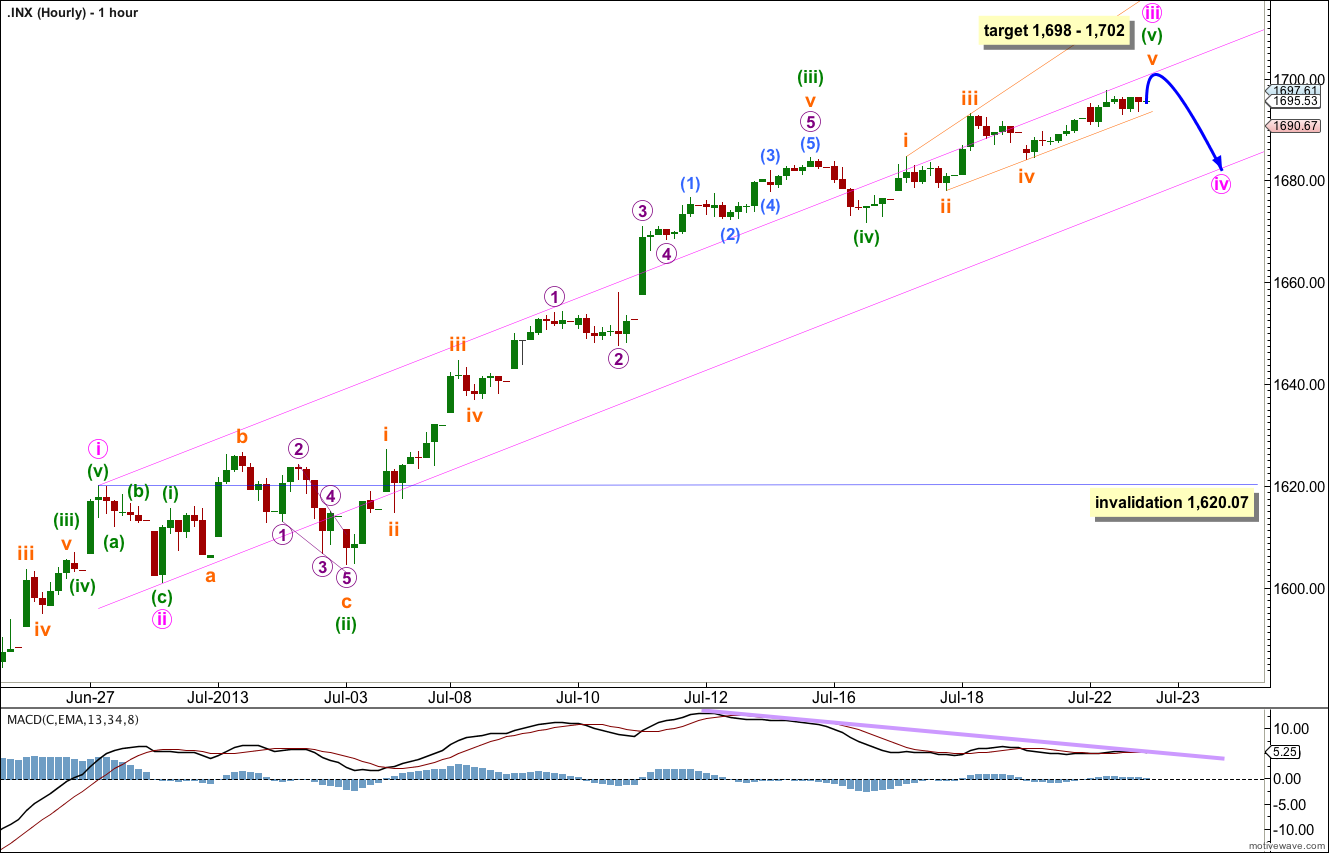
Upwards movement within subminuette wave v so far looks most likely to be an incomplete zigzag on the five minute chart. I would expect a little further upwards movement tomorrow before minute wave iv begins.
At 1,698 minute wave iii would reach 1.618 the length of minute wave i. At 1,702 minute wave (v) would reach 0.382 the length of minute wave (iii).
There is continuing divergence on the hourly chart between price trending slowly higher and MACD trending lower. This is an indication of an upcoming trend change which I expect will be a short term trend change for minute wave iv.
I have redrawn the parallel channel about minor wave 5 today using Elliott’s first technique. It will have to be redrawn if minute wave iii moves a little higher as expected. Draw the first trend line from the highs of minute waves i to iii, then place a parallel copy upon the low of minute wave ii. The lower trend line may show us where price finds support as minute wave iv unfolds.
Minute wave iv may not move into minute wave i price territory. Movement below 1,620.07 would invalidate this wave count.
I would expect minute wave iv to show up on the daily chart as a red downwards candlestick. It may last only one session to do this, but it is more likely to last about two or three sessions.