
We have probably seen a trend change at least for the short term. With price failing to break above 1,687.18 and turning just before this point both wave counts remain valid. They still have an even probability.
Click on the charts below to enlarge.
Main Wave Count.
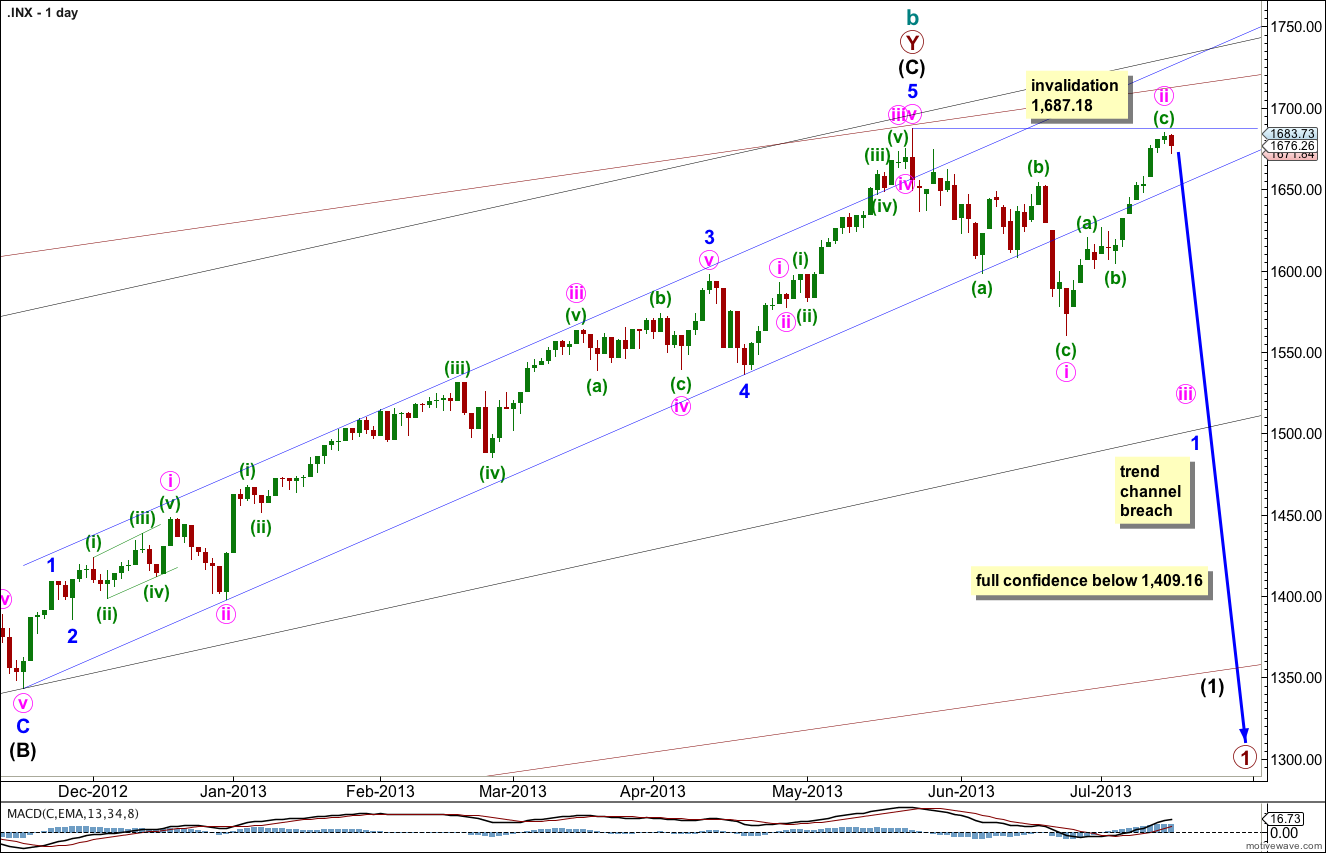
The widest maroon channel is copied over from the monthly chart and contains all of cycle wave b. It may be that price found final resistance at the upper edge of this channel.
The black channel in the middle is drawn about the zigzag of primary wave Y. Draw the first trend line from the start of primary wave Y to the end of intermediate wave (B). Place a parallel copy upon the extreme within intermediate wave (A). The upper edge of this channel also may be where price found resistance and where intermediate wave (C) ended.
The smallest blue channel is the most conservative best fit I can see for intermediate wave (C). It is very clearly breached by downwards movement.
What would give me confidence in this trend change is a clear breach of the black intermediate degree channel. When that is breached I will calculate long term downwards targets for you.
There is no classic technical divergence between price and MACD on the daily or weekly charts. This is possible, but unusual for the S&P 500. This must reduce the probability of this wave count.
There are no Fibonacci ratios between minor waves 1, 3 and 5 within intermediate wave (C). There is no Fibonacci ratio between intermediate waves (A) and (C). This lack of Fibonacci ratios slightly reduces the probability of this main wave count.
Minor wave 1 must be unfolding as a leading diagonal. Within the diagonal minute wave i is complete. Minute wave ii is now also probably complete although the channel about it on the hourly chart has not been clearly breached.
Minute wave ii may not move beyond the start of minute wave i. This wave count is invalidated with movement above 1,687.18.
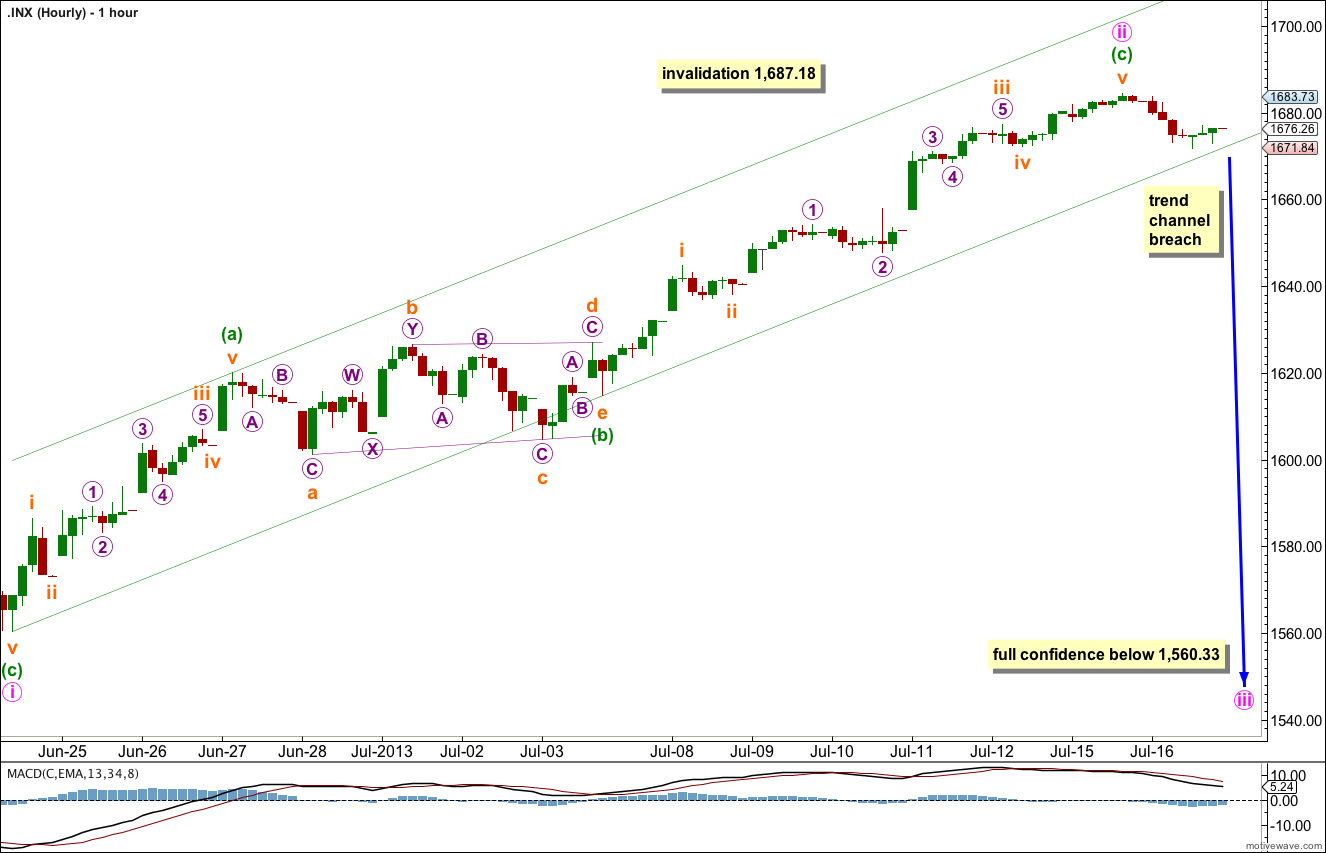
Downwards movement has so far remained within the small parallel channel drawn about minute wave ii using Elliott’s technique. At this stage although it looks highly likely we have seen at least a short term trend change, we do not have trend channel confirmation of this yet. We may get it tomorrow.
If minor wave 1 is unfolding as a leading diagonal then within it minute wave iii is unlikely to have a Fibonacci ratio to minute wave i. When there is structure to analyse within minute wave iii then the ratios between minuette waves within it may be used to calculate a target for it to end.
At this stage for a diagonal minute wave iii must make a new price extreme beyond the end of minute wave i. This wave count requires movement below 1,560.33. Movement below this price point would provide strong confirmation of this wave count at both the hourly and daily chart level.
While price remains within the parallel channel the invalidation point must remain at 1,687.18 and we must accept the possibility that minute wave ii may move a little higher. Minute wave ii may not move beyond the start of minute wave i. This wave count is invalidated with movement above 1,687.18.
Alternate Wave Count.
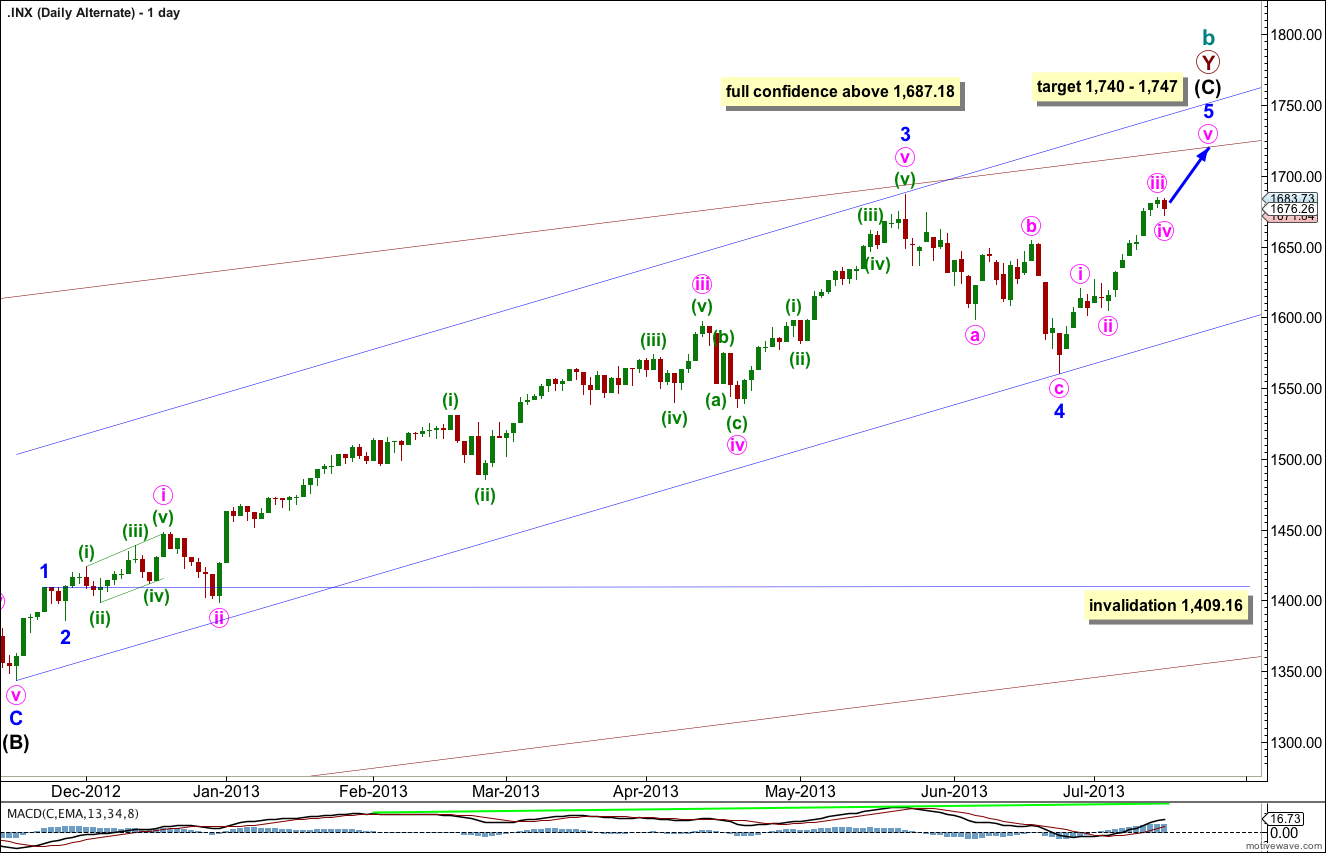
Minor wave 4 is out of proportion to all the other corrections within intermediate wave (C) reducing the probability of this wave count and giving it an odd look.
Within intermediate wave (C) minor wave 3 is 23 points longer than 4.236 the length of minor wave 1.
The lack of classic technical divergence between price and MACD supports this wave count. A final fifth wave up with slowing momentum would provide divergence and give a typical look in terms of momentum. So far within minor wave 5 minute waves i, ii and now also iii may be complete.
At 1,740 intermediate wave (C) would reach equality with intermediate wave (A). At 1,747 minor wave 5 would reach 0.618 the length of minor wave 3.
Minor wave 4 may not move into minor wave 1 price territory. This wave count is invalidated with movement below 1,409.16. However, if a new low below 1,560.33 were to occur this wave count would look so strange and wrong it would be discarded.
Downwards movement for Tuesday’s session shows on the daily chart and so is likely to be a fourth wave correction, counterpart to the earlier second wave correction which shows on the daily chart also.
At this stage I will label these waves at minute degree but it is also possible to move this labeling down one degree and see minute wave i only as close to completion. If this wave count is confirmed with movement above 1,687.18 then that would be the next alternate we must consider. However, it makes no difference to expected direction for this wave count which is still up.
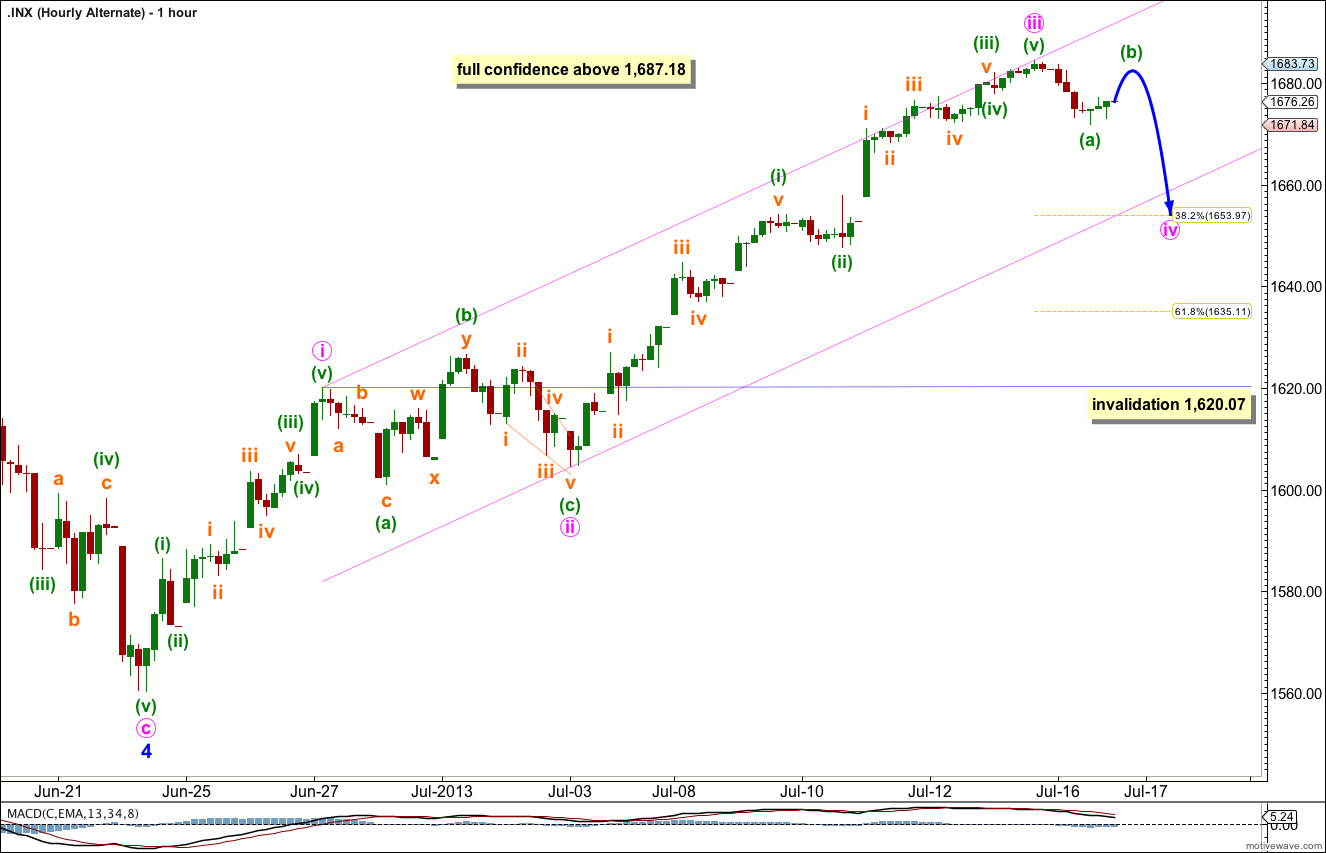
If minor wave 5 is unfolding as an impulse then within it minute waves i, ii and now most likely iii are complete. Downwards movement for Tuesday’s session would be the start of minute wave iv.
Minute wave ii was a very shallow 26% running flat correction. Given the guideline of alternation this wave count would be expecting a relatively deep zigzag for minute wave iv. We may expect alternation in depth and / or structure.
On the five minute chart the downwards movement labeled minuette wave (a) is ambiguous. It subdivides most easily as an impulse, but it may also be seen as a zigzag. If it is an impulse then minute wave iv may be unfolding as a 5-3-5 zigzag structure and within it minuette wave (b) may not move beyond the start of minuette wave (a) above 1,684.51. If minuette wave (a) is seen as subdividing as a zigzag (a three wave structure) then minute wave iv may be unfolding as a flat correction and within it minuette wave (b) may move above the start of minuette wave (a) at 1,684.51. For this reason there can be no upper invalidation point for minute wave iv, but it is unlikely to make a new price extreme above 1,684.51.
Draw a parallel channel about minor wave 5 using Elliott’s first technique. Draw the first trend line from the highs of minute waves i to iii, then place a parallel copy upon the low of minute wave ii. Minute wave iv may find some support at the lower edge of this channel. If that happens then minute wave iv may reach down only to about the 0.382 Fibonacci ratio of minute wave iii. If this is the case then minute wave iv may show alternation in structure and not so much in depth with minute wave ii.
Minute wave iv may not move into minute wave i price territory. This wave count is invalidate with movement below 1,620.07.
If price moves below 1,620.07 this week then there is one other structural possibility for minor wave 5, an ending diagonal. An ending diagonal requires all subwaves to subdivide into zigzags. Downwards movement may be a zigzag for minute wave ii which may not move beyond the start of minute wave i. The invalidation point for this structure would be at 1,560.33.
Only movement below 1,560.33 would invalidate this wave count fully at the hourly chart level.