
More upwards movement was expected by the alternate wave count. However, price has not breached the invalidation point for the main wave count and both wave counts remain valid.
The main and alternate wave counts have an even probability. We need to see price break above 1,687.18 or below 1,560.33 to have one wave count confirmed and the other invalidated.
Click on the charts below to enlarge.
Main Wave Count.
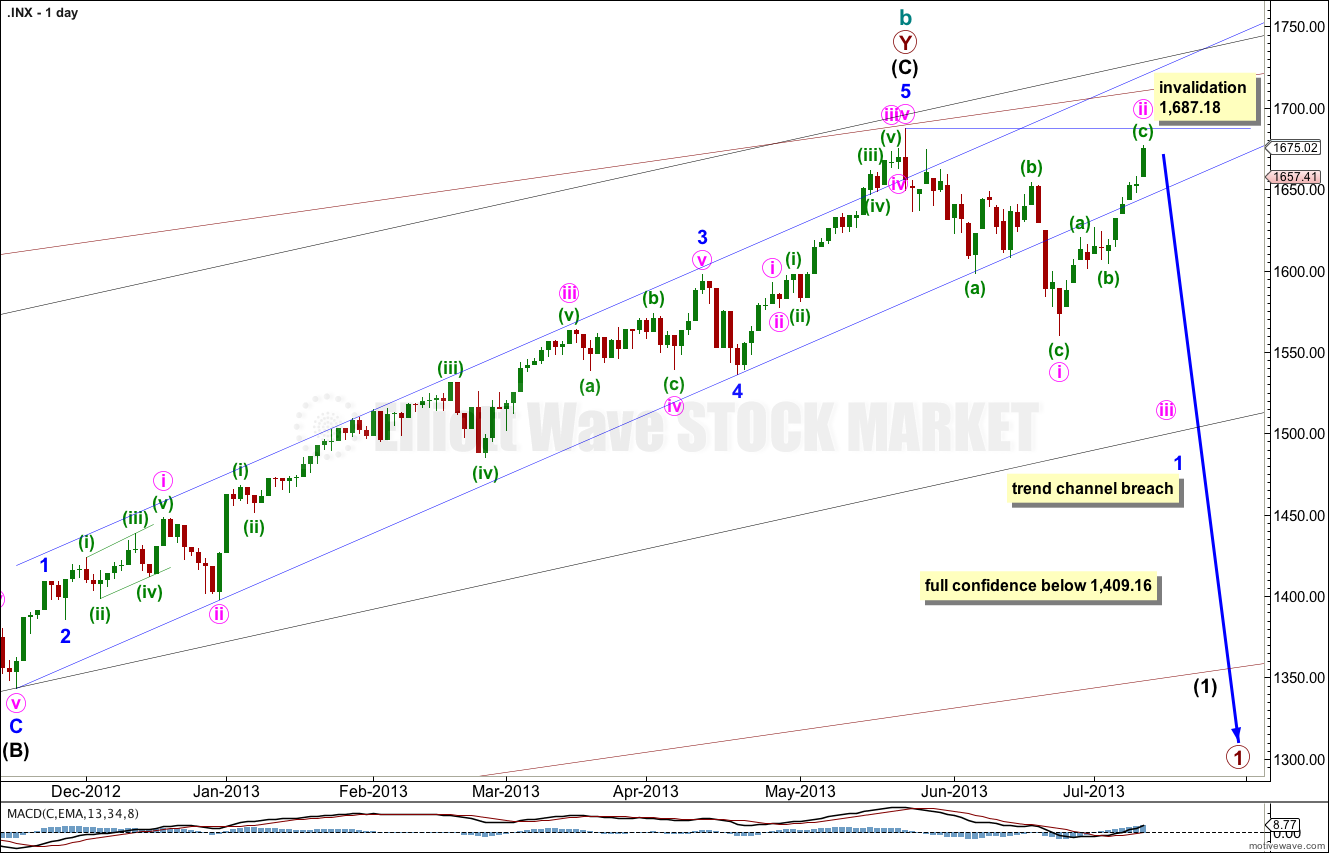
The widest maroon channel is copied over from the monthly chart and contains all of cycle wave b. It may be that price found final resistance at the upper edge of this channel.
The black channel in the middle is drawn about the zigzag of primary wave Y. Draw the first trend line from the start of primary wave Y to the end of intermediate wave (B). Place a parallel copy upon the extreme within intermediate wave (A). The upper edge of this channel also may be where price found resistance and where intermediate wave (C) ended.
The smallest blue channel is the most conservative best fit I can see for intermediate wave (C). It is very clearly breached by downwards movement.
What would give me confidence in this trend change is a clear breach of the black intermediate degree channel. When that is breached I will calculate long term downwards targets for you.
There is no classic technical divergence between price and MACD on the daily or weekly charts. This is possible, but unusual for the S&P 500. This must reduce the probability of this wave count.
There are no Fibonacci ratios between minor waves 1, 3 and 5 within intermediate wave (C). There is no Fibonacci ratio between intermediate waves (A) and (C). This lack of Fibonacci ratios slightly reduces the probability of this main wave count.
Minor wave 1 must be unfolding as a leading diagonal. Within the diagonal minute wave i is complete. Minute wave ii is either complete or very close to completion.
Minute wave ii may not move beyond the start of minute wave i. This wave count is invalidated with movement above 1,687.18.
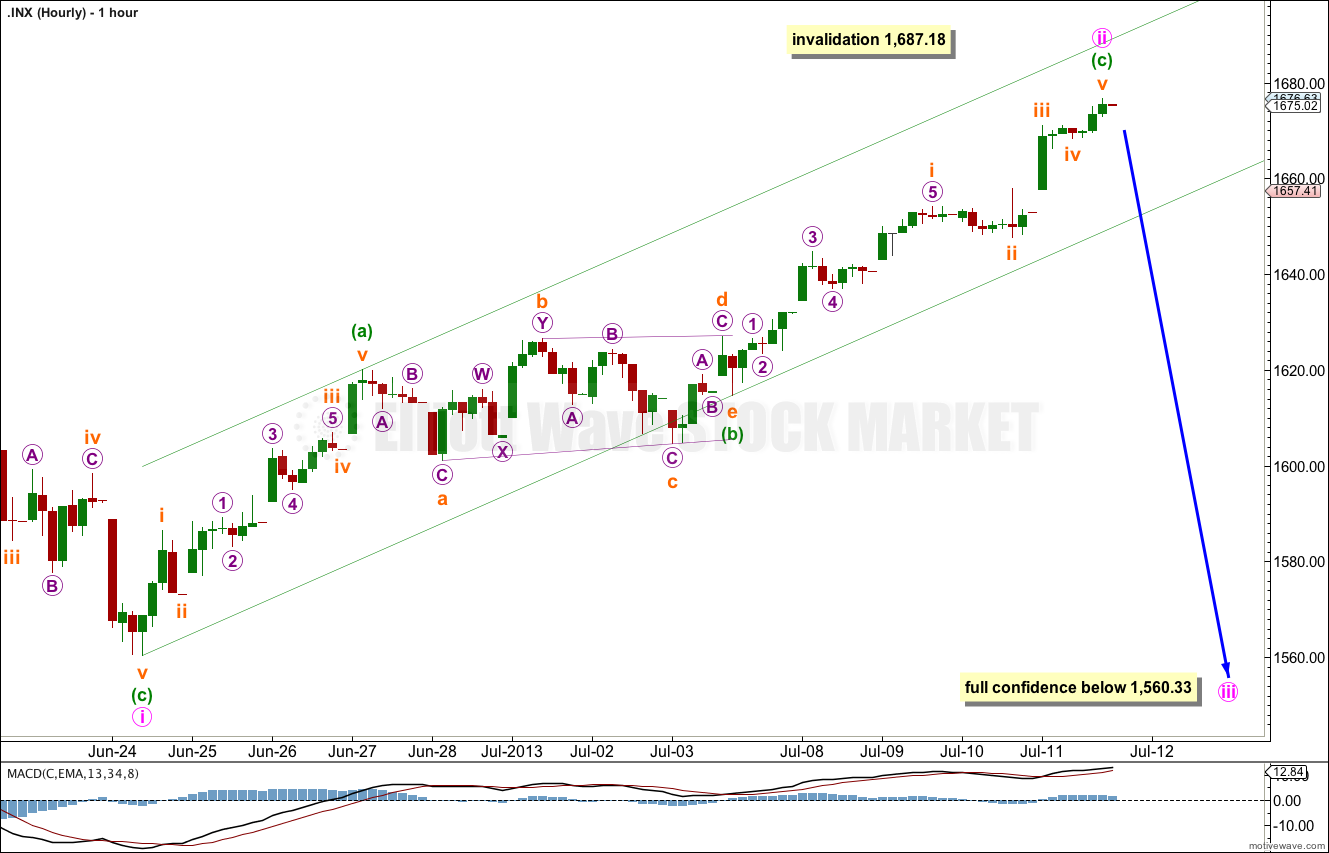
The small parallel channel about minute wave ii zigzag has not been breached and so we have not had confirmation nor indication of a trend change yet.
Minute wave ii is now 0.92 the length of minute wave i. It is now longer than the common length for second waves within diagonals which is between 0.66 to 0.81. This further slightly reduces the probability of this wave count today.
Within minuette wave (c) of minute wave iii it may have been subminuette wave i which was extended.
Ratios within minuette wave (c) are: subminuette wave iii is 1 point shorter than 0.618 the length of subminuette wave i, and subminuette wave v is 0.64 short of 0.382 the length of subminuette wave iii. This labeling agrees with MACD, it sees the strongest momentum as within the third wave.
We need to see the small parallel channel containing this upwards movement breached with at least one full hourly candlestick below the channel to have confirmation that minute wave ii is over and minute wave iii is underway. Until we have this confirmation we must accept the possibility that minute wave ii may move higher.
Minute wave ii may not move beyond the start of minute wave i. This wave count is invalidated with movement above 1,687.18.
Alternate Wave Count.
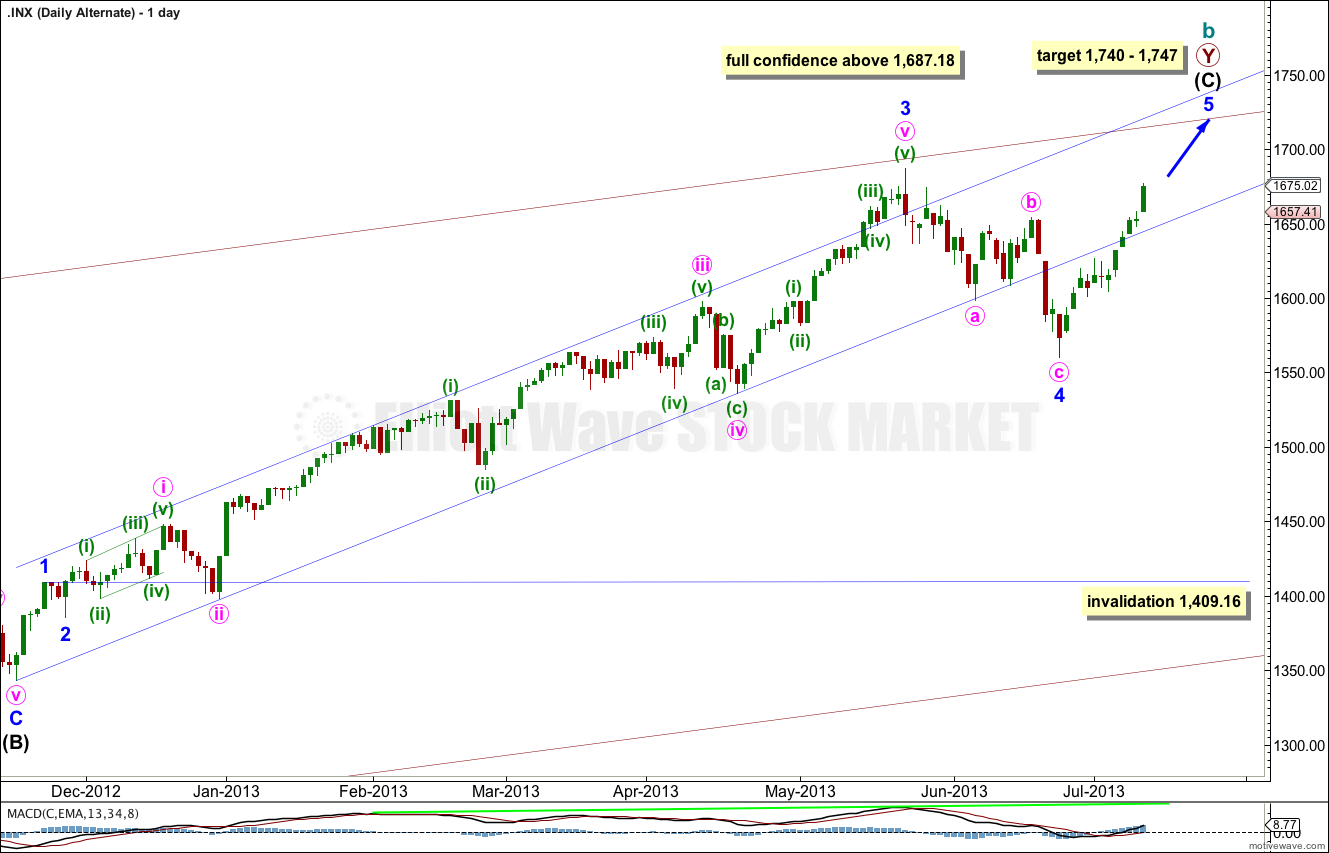
Minor wave 4 is out of proportion to all the other corrections within intermediate wave (C) and clearly breaches a channel containing intermediate wave (C) no matter how that channel is drawn. Sometimes fourth waves do this and so we must consider this possibility.
Within intermediate wave (C) minor wave 3 is 23 points longer than 4.236 the length of minor wave 1.
The lack of classic technical divergence between price and MACD supports this wave count. A final fifth wave up with slowing momentum would provide divergence and give a typical look in terms of momentum.
At 1,740 intermediate wave (C) would reach equality with intermediate wave (A). At 1,747 minor wave 5 would reach 0.618 the length of minor wave 3.
Minor wave 4 may not move into minor wave 1 price territory. This wave count is invalidated with movement below 1,409.16. However, if a new low below 1,560.33 were to occur this wave count would look so strange and wrong it would be discarded.
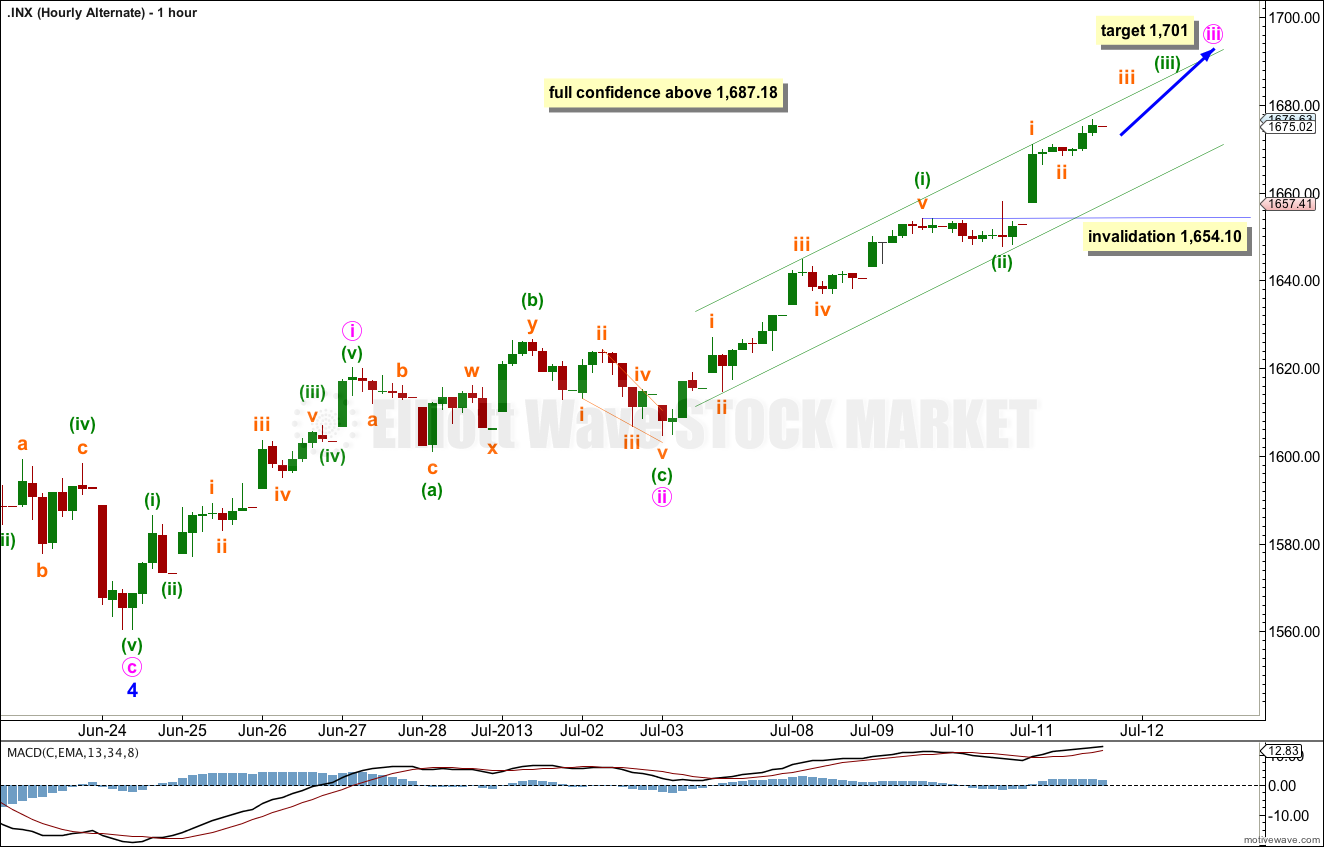
At the hourly chart level because momentum is increasing it is likely that minute wave iii is not over and is passing the middle. It is also likely that within minute wave iii minuette wave (iii) would be longer than equality with minuette wave (i).
The target remains the same. At 1,701 minute wave iii would reach 1.618 the length of minute wave i.
We may have full confidence in this wave count if price moves above 1,687.18. At that stage the main daily wave count would be firmly invalidated.